3583
Spatial comparison of MR perfusion and radio-pathomic model derived cell density in newly diagnosed glioma patients: prognostic implications1Radiology, Medical College of Wisconsin, Milwaukee, WI, United States, 2Medical College of Wisconsin, Milwaukee, WI, United States
Synopsis
Keywords: Tumors (Pre-Treatment), Tumor, perfusion, glioma
Motivation: Deliniating non-angiogenic and early-angiogenic areas of tumor prevents detection of the full extent of glioblastoma invasion.
Goal(s): This study investigated the relationship between perfusion and radio-pathomic estimates of cell density in glioblastoma.
Approach: This study compared ASL- and DSC-based perfusion estimates to predicted cellularity maps in two large publicly available datasets.
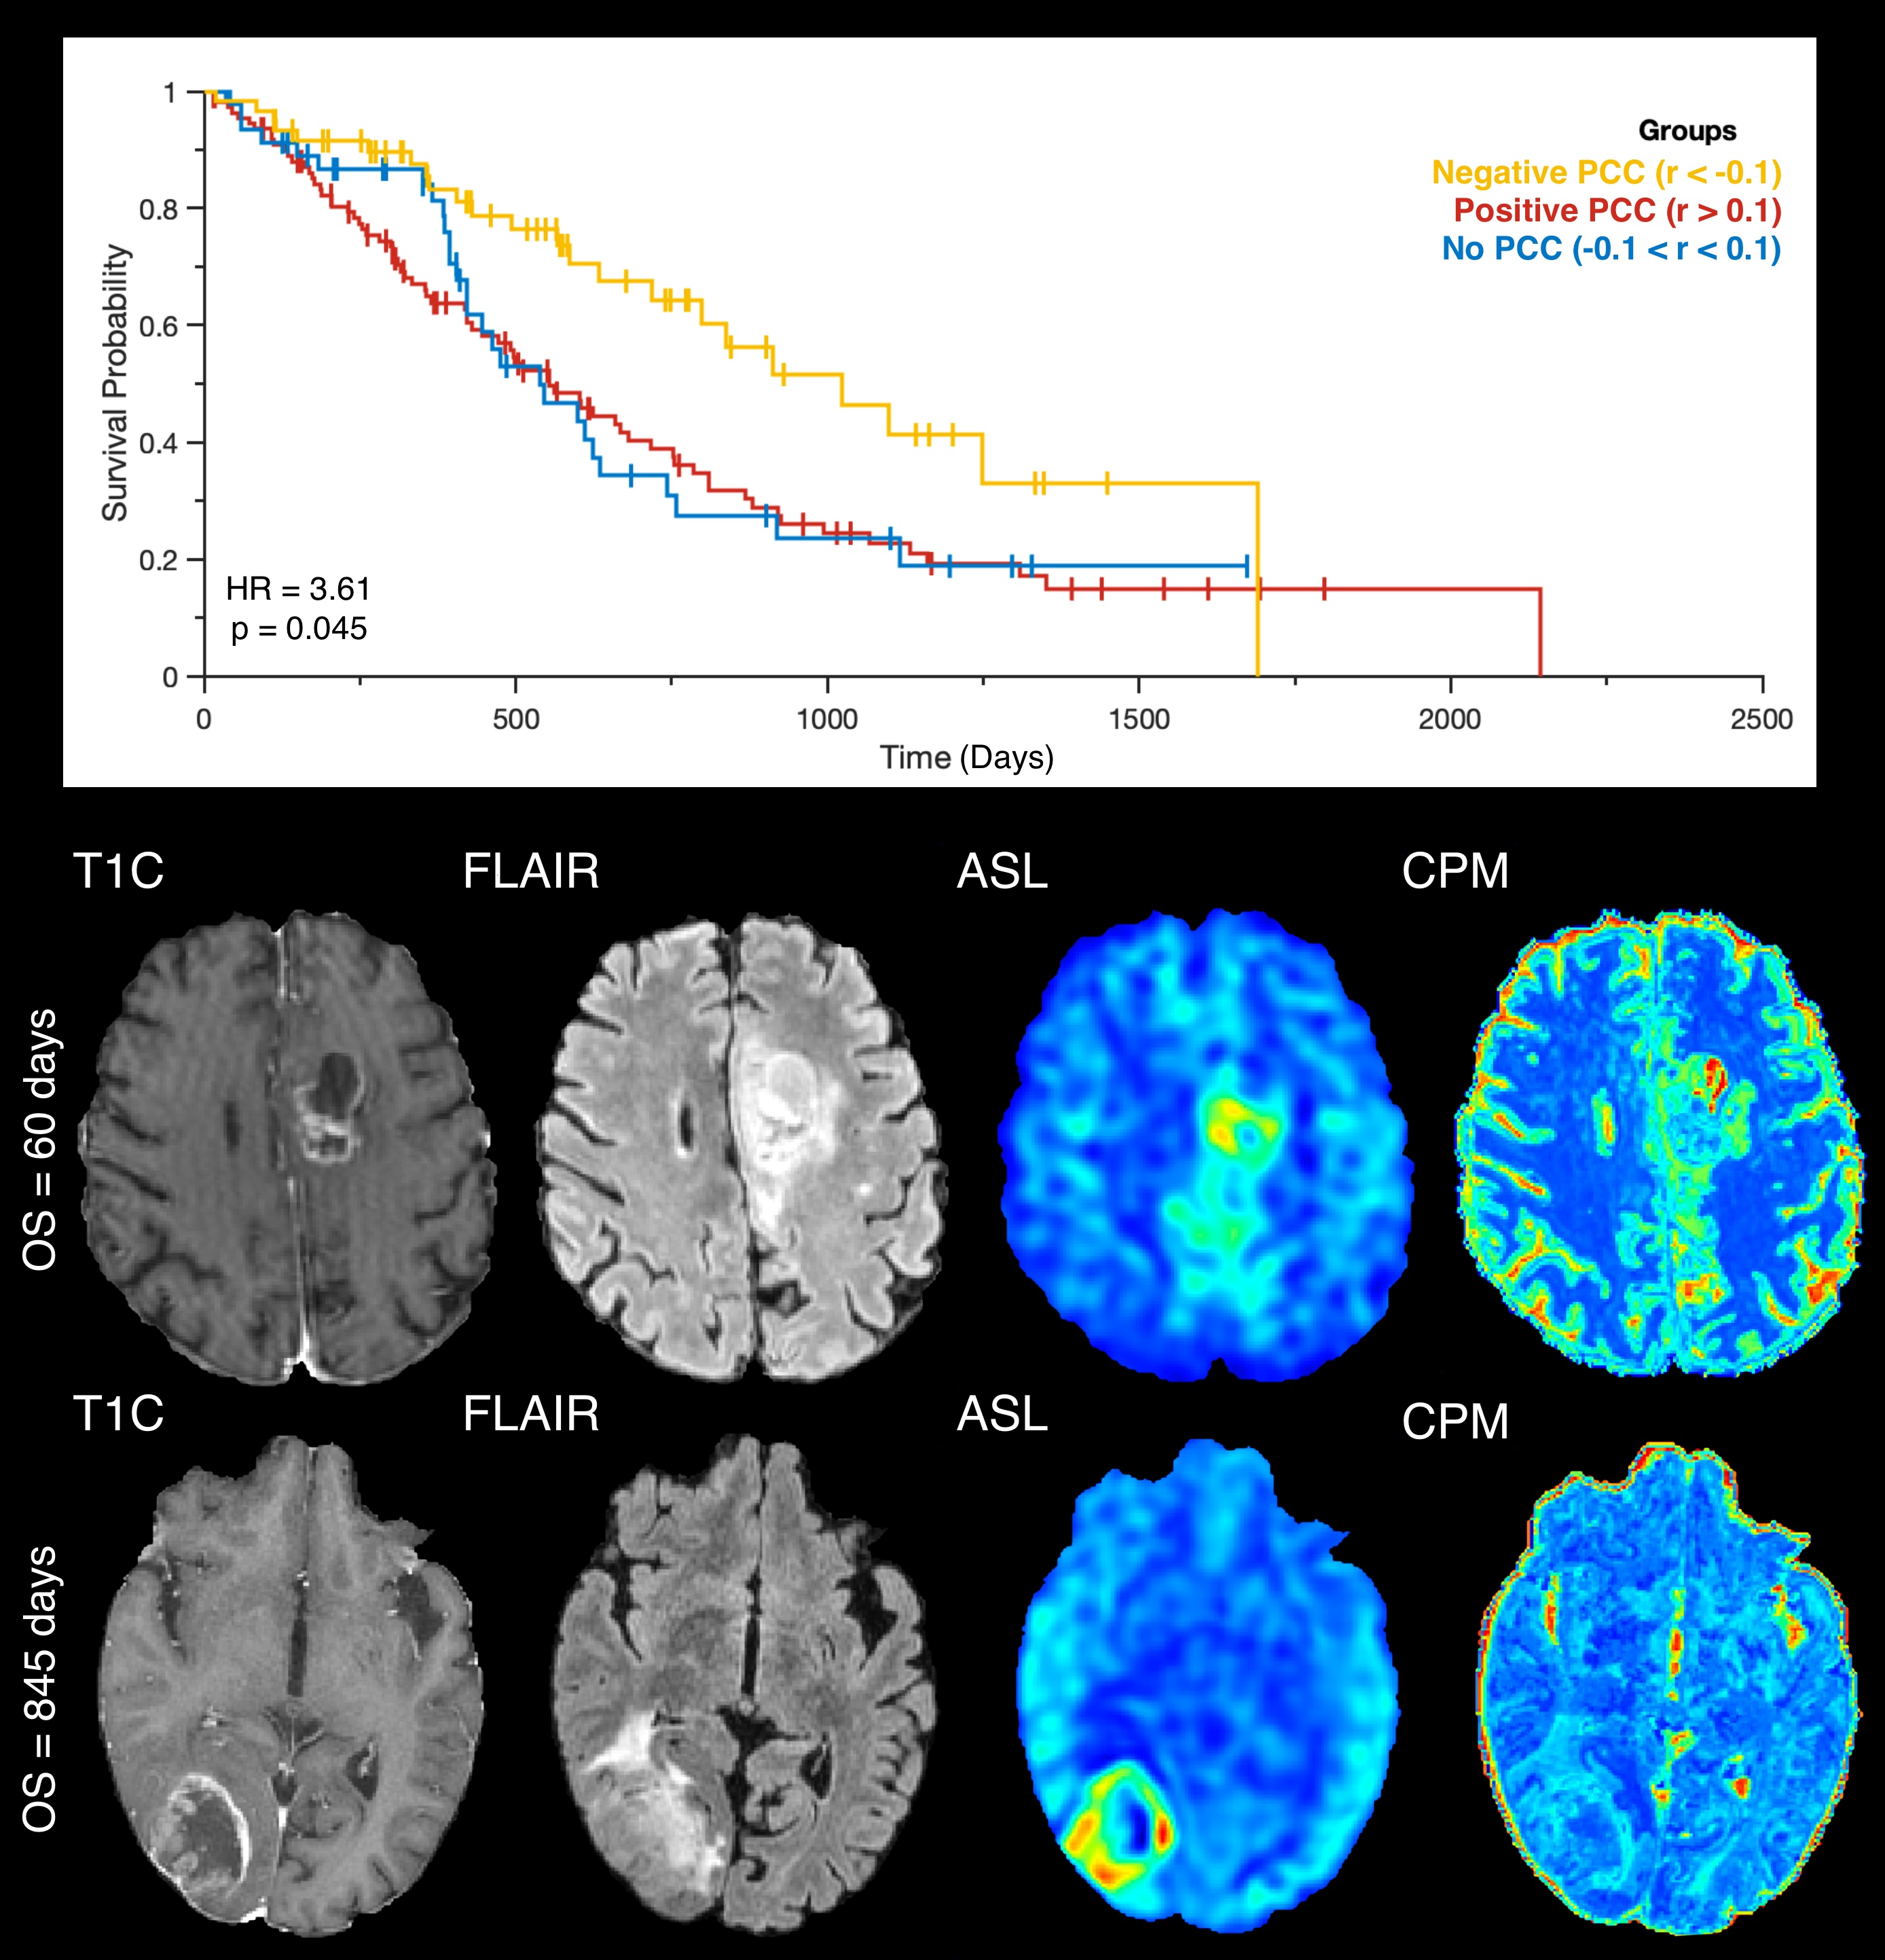
Results: Positive cellularity-perfusion associations were observed within contrast enhancement but not in non-enhancing regions. Per-subject positive cellularity-perfusion associations within FLAIR hyperintensity were associated with worse prognosis in glioblastoma patients following gross total resection.
Impact: Areas of increased perfusion and hypercellularity can be used to direct surgical intervention to capture early-angiogenic areas of tumor missed by contrast enhancement, which may in turn improve survival outcomes. Non-angiogenic hypercellular tumor may persist outside even this margin.
Introduction
Glioblastoma is a devastating illness with only 6% of patients reaching 5-year survival (1). Early tumor proliferation depletes oxygen and other resources from affected tissue, which induces hypoxia and in turn, angiogenesis to support tumor growth. This leaky vasculature is exploited in imaging with gadolinium-based contrast agents that cross the blood brain barrier and highlight the tumor mass. However, this signature is known to miss the full extent of tumor, leading potentially to areas of tumor being spared from treatment. Perfusion imaging using both contrast and non-contrast based methods have shown promise in more directly measuring angiogenic activity via increases in cerebral blood flow. Additionally, radio-pathomic maps of cell density trained using MRI and aligned autopsy tissue have shown promise in identifying areas of hypercellularity beyond the contrast enhancing margin (2). This study examined the spatial and prognostic relationships associated with the perfusion-cell density relationship.Methods
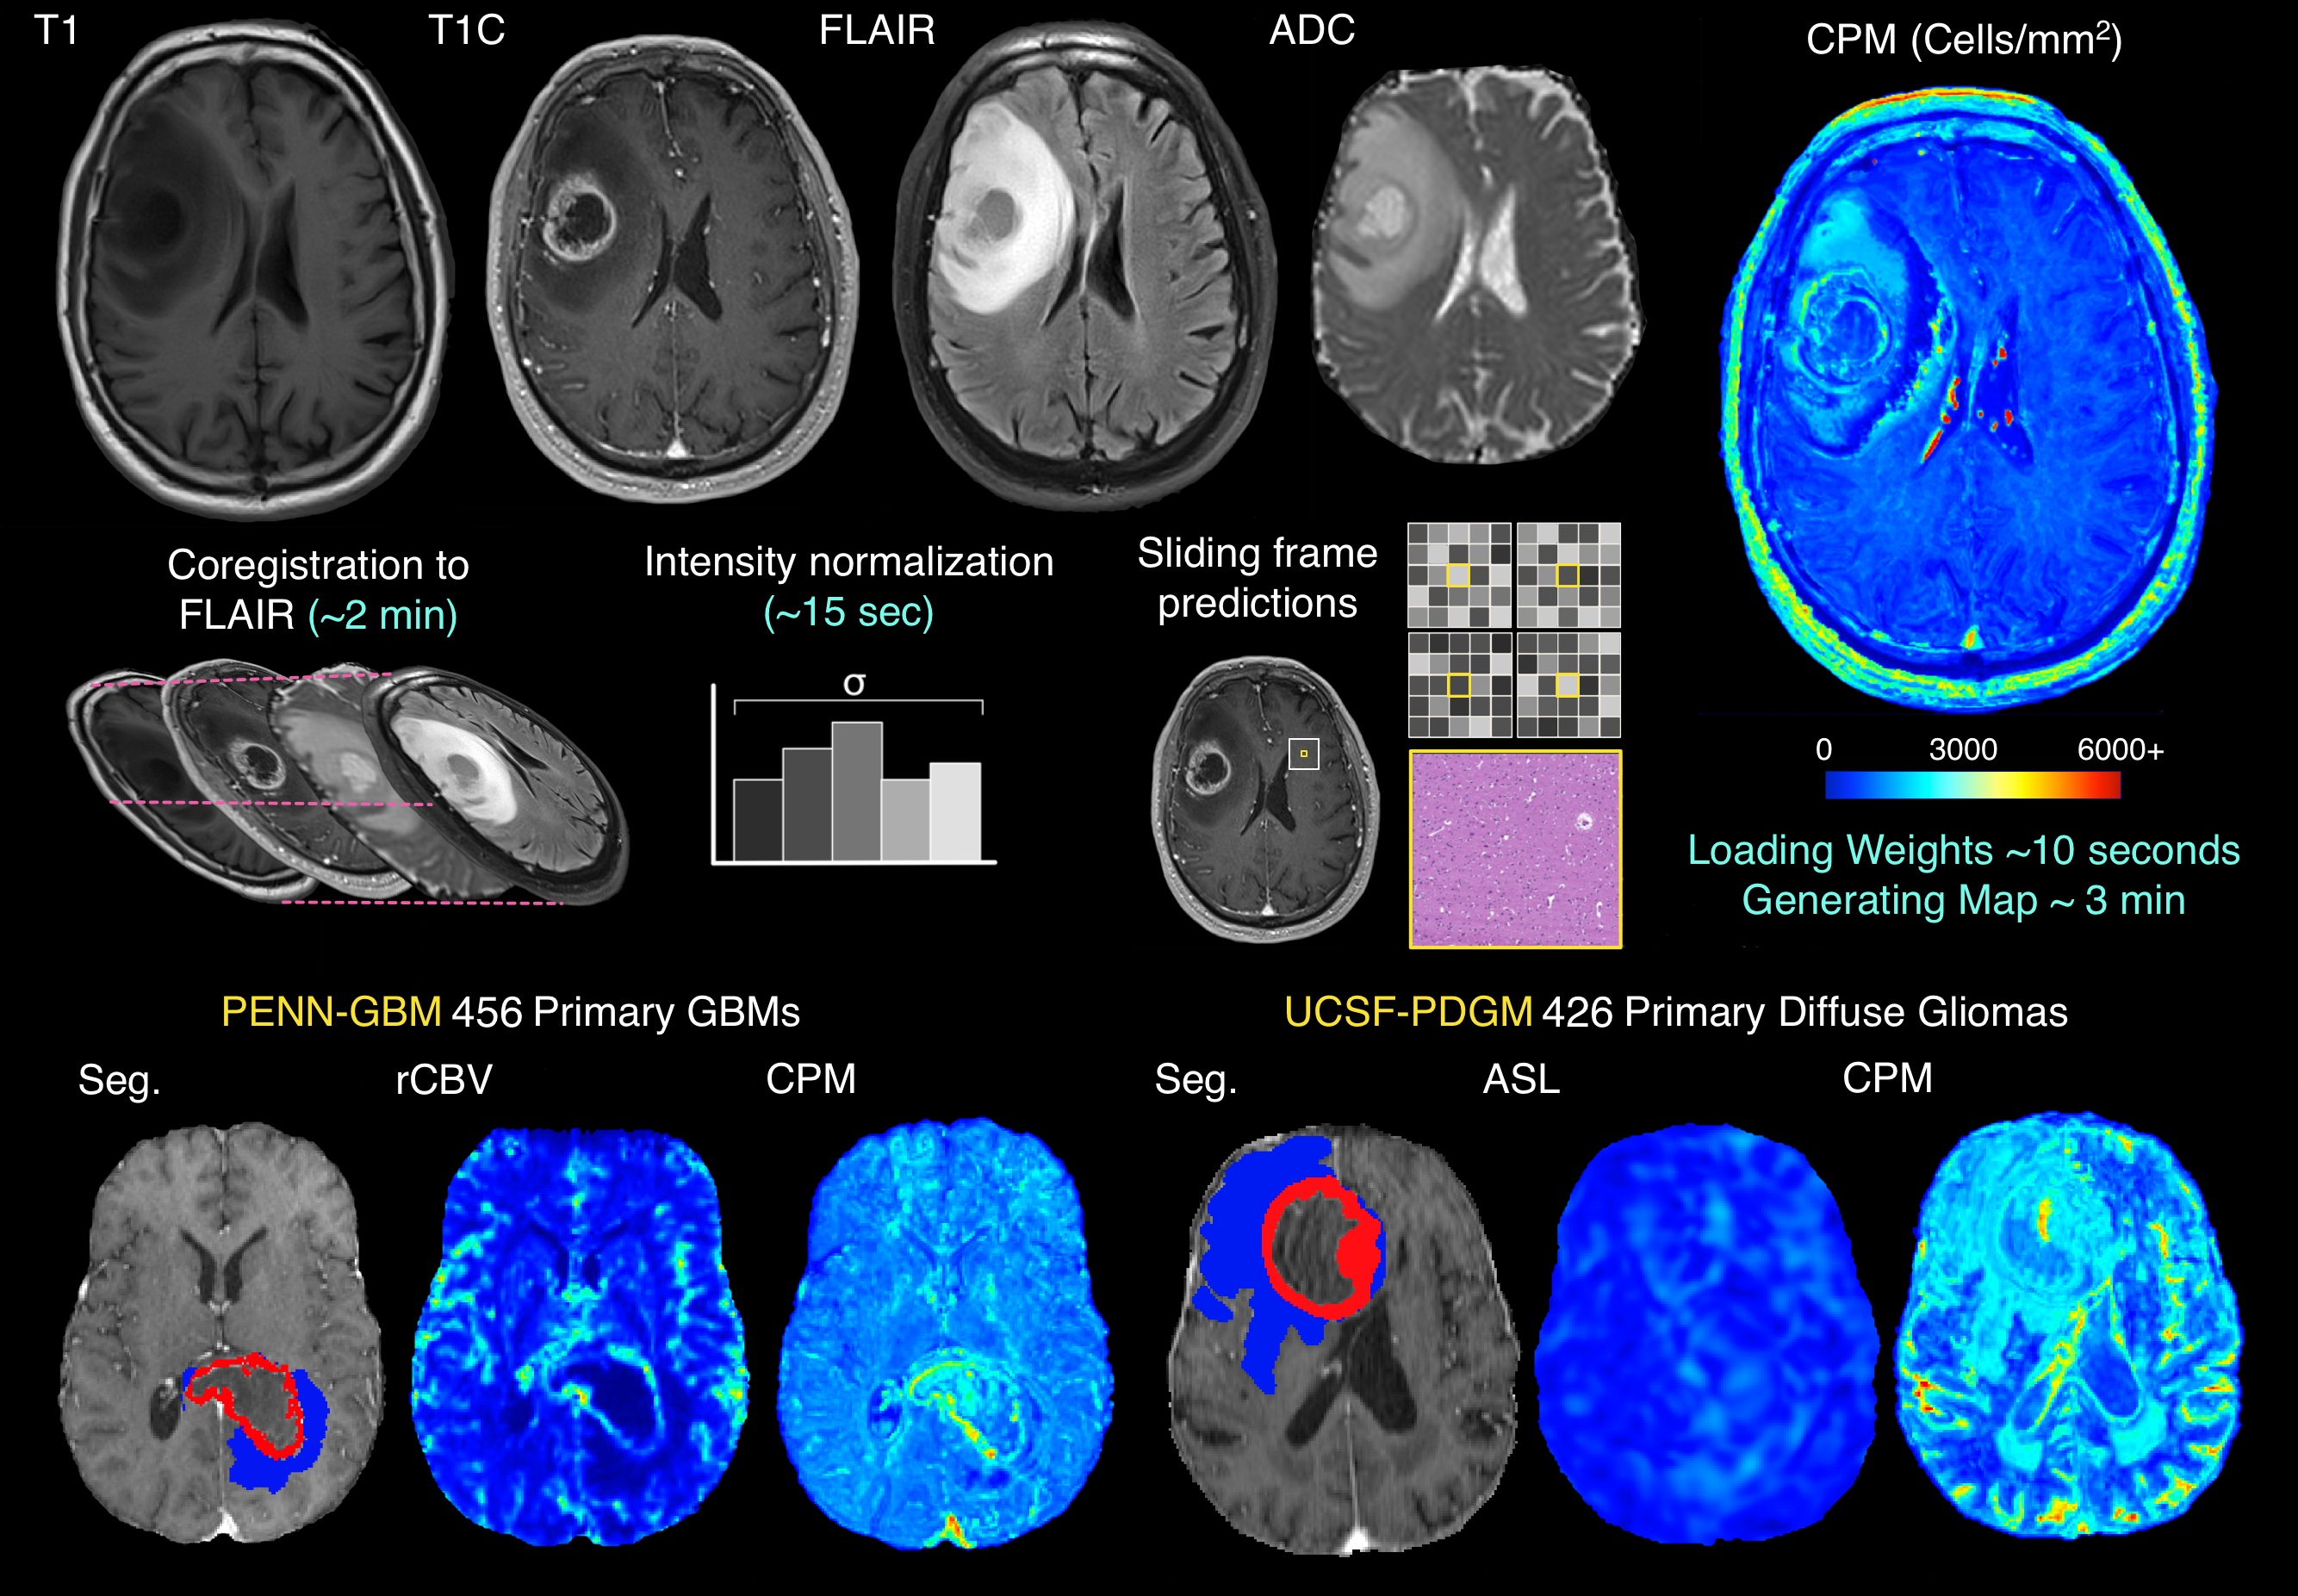
This study used imaging data from two large publicly available datasets. A summary of study methods is presented in Figure 1. Pre- and post-contrast T1-weighted images (T1, T1C), FLAIR images, ADC images, and rCBV images derived from contrast-based DSC perfusion imaging were collected from the PENN-GBM dataset (n=456). T1, T1C, FLAIR, ADC, and arterial spin labelling (ASL) non-contrast-based perfusion images were collected from the UCSF-PDGM dataset (n=426). Conventional imaging from each patient was used to compute radio-pathomic maps of cell density using a previously published and validated method, where 5 by 5 tiles from each acquisition are used to predict voxelwise cell density using aligned autopsy tissue samples as ground truth and have shown substantial utility at identifying areas of non-enhancing hypercellularity. Mean values for cell density and perfusion data from each dataset were computed within both the contrast-enhancing region (CE) and the non-enhancing FLAIR hyperintense region (FH), and Pearson’s correlations were used to test the association between cell density and perfusion estimates within CE/FH for each dataset. To supplement the findings from the cell density predictive maps, 2 glioblastoma patients from our local autopsy brain bank dataset were used to visually compare histological tumor presence with locally collected rCBV/ASL maps acquired close to death. Additionally, the per-subject cell density-perfusion correlation within CE and FH was computed for patients from the UCSF-PDGM dataset that had undergone gross total resection of their tumor to examine the relationship between cell density-ASL concordance and overall patient survival.Results
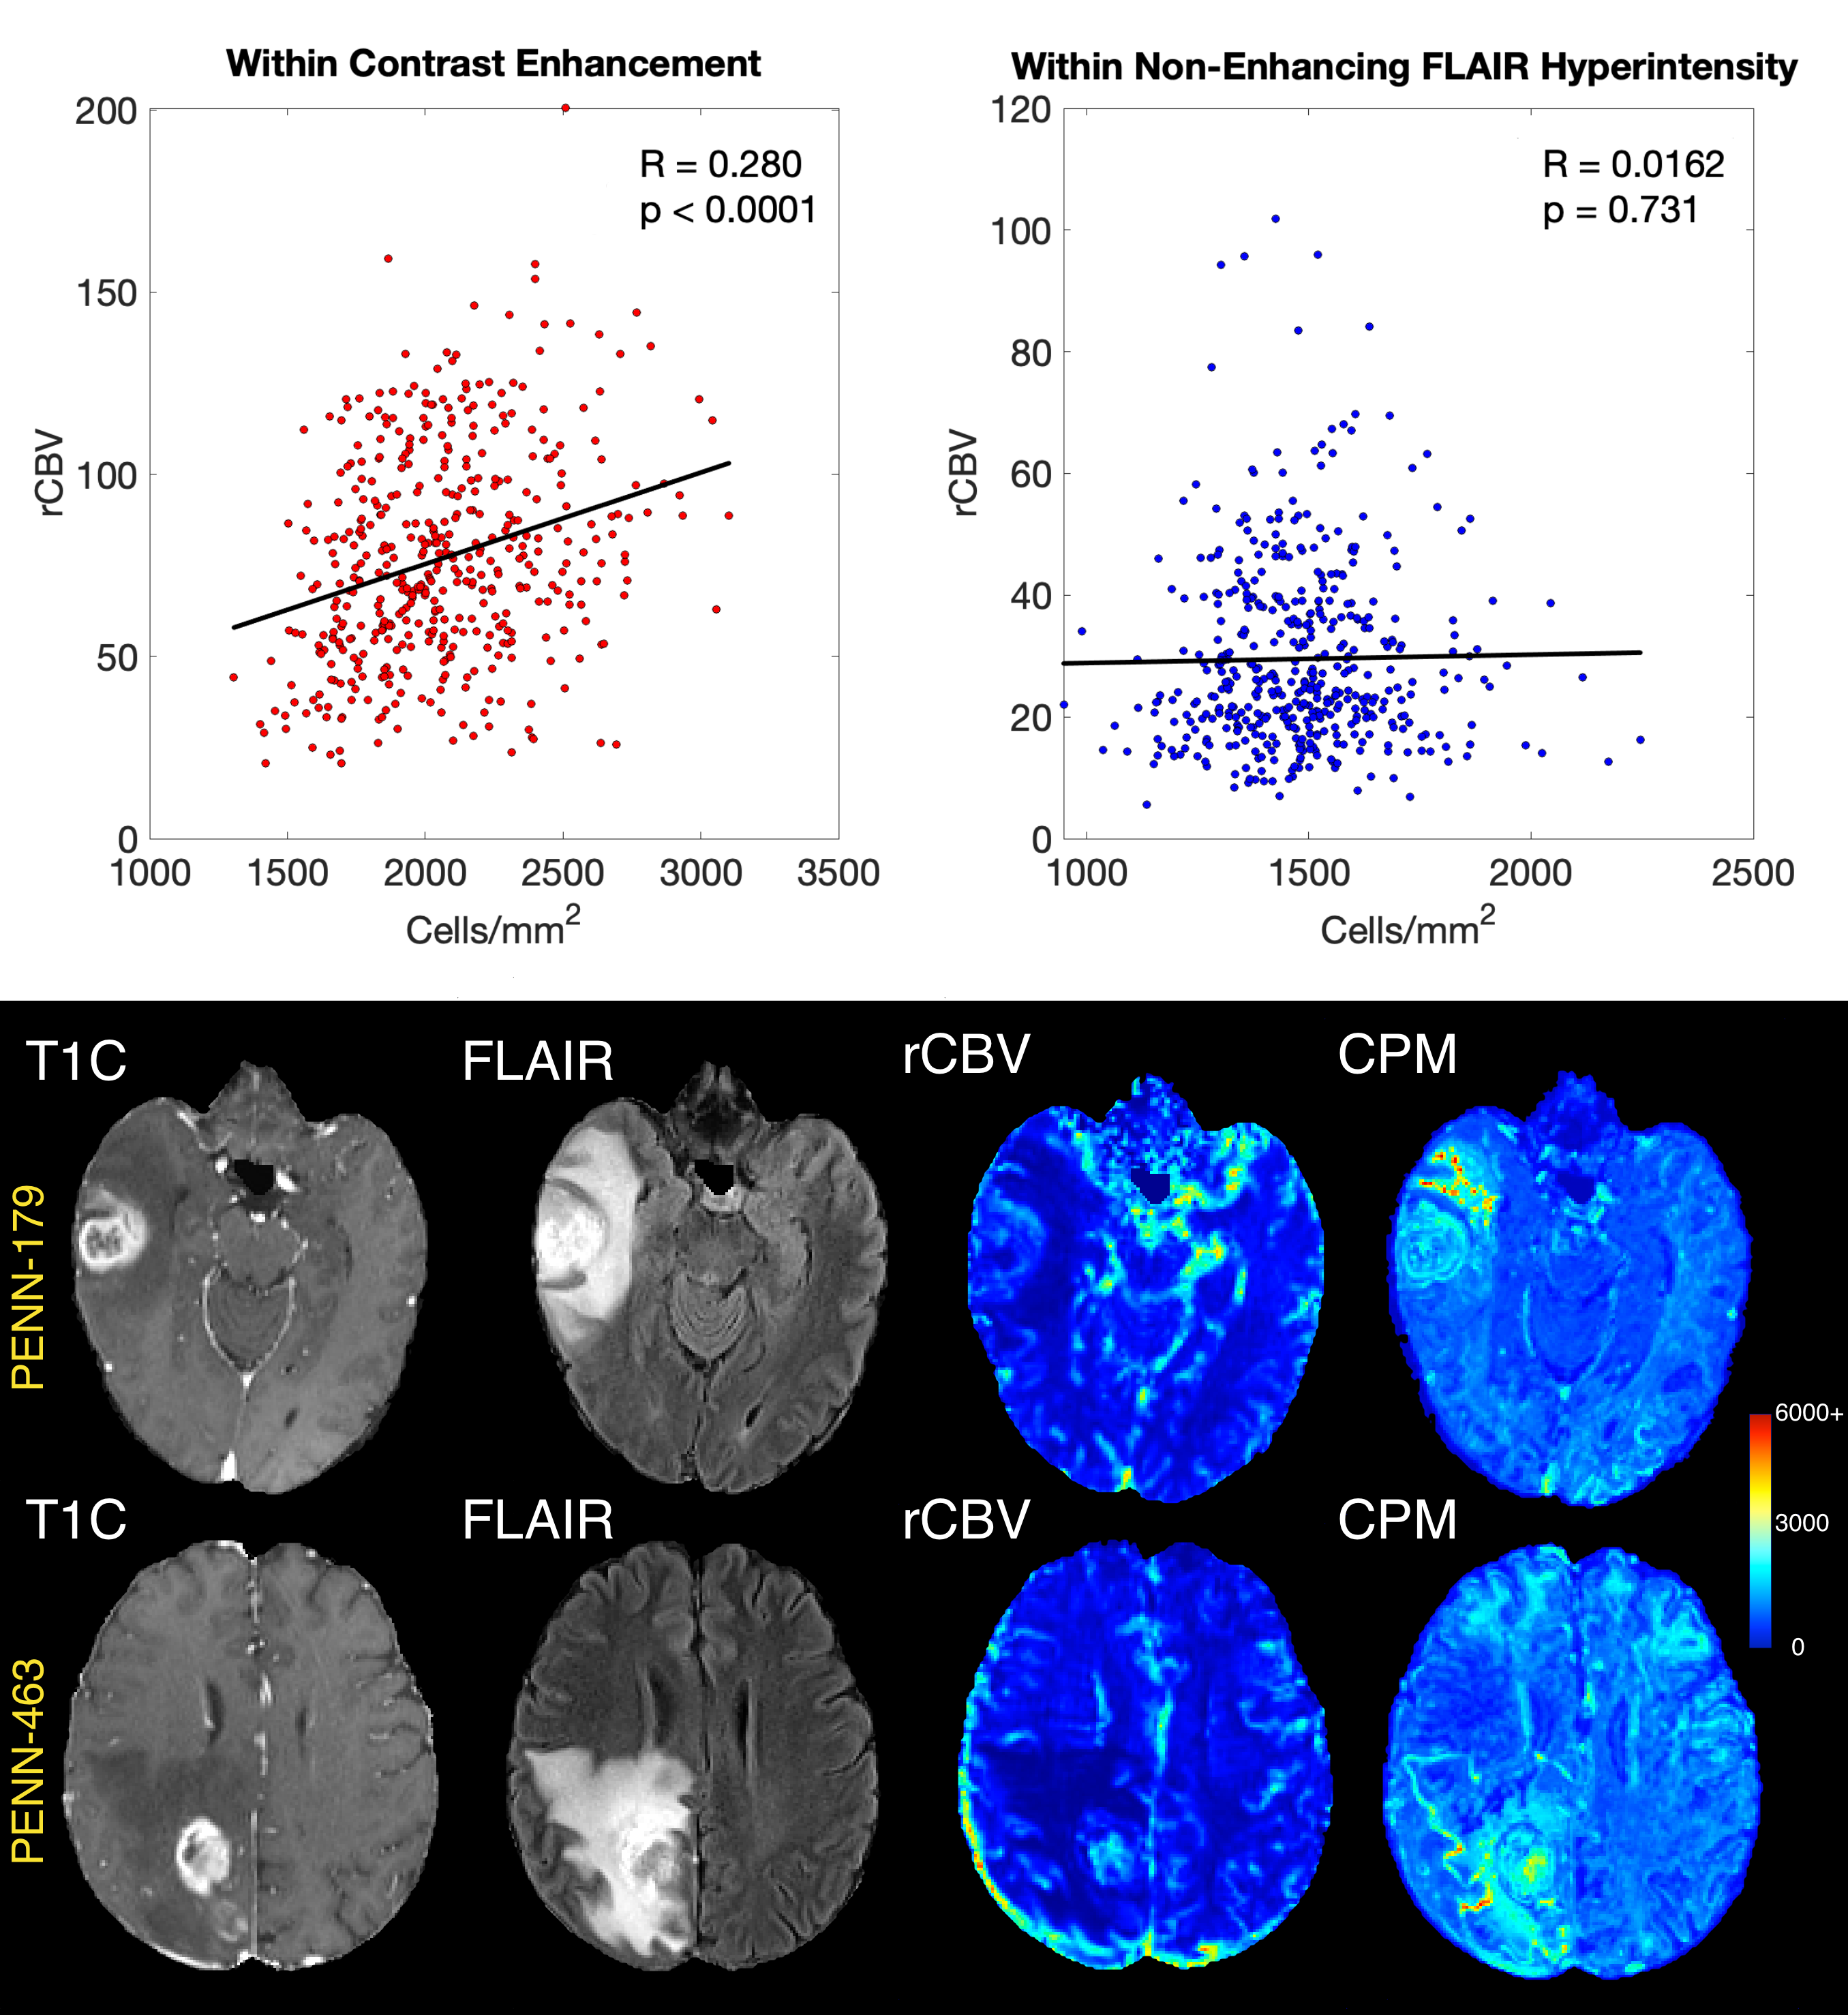
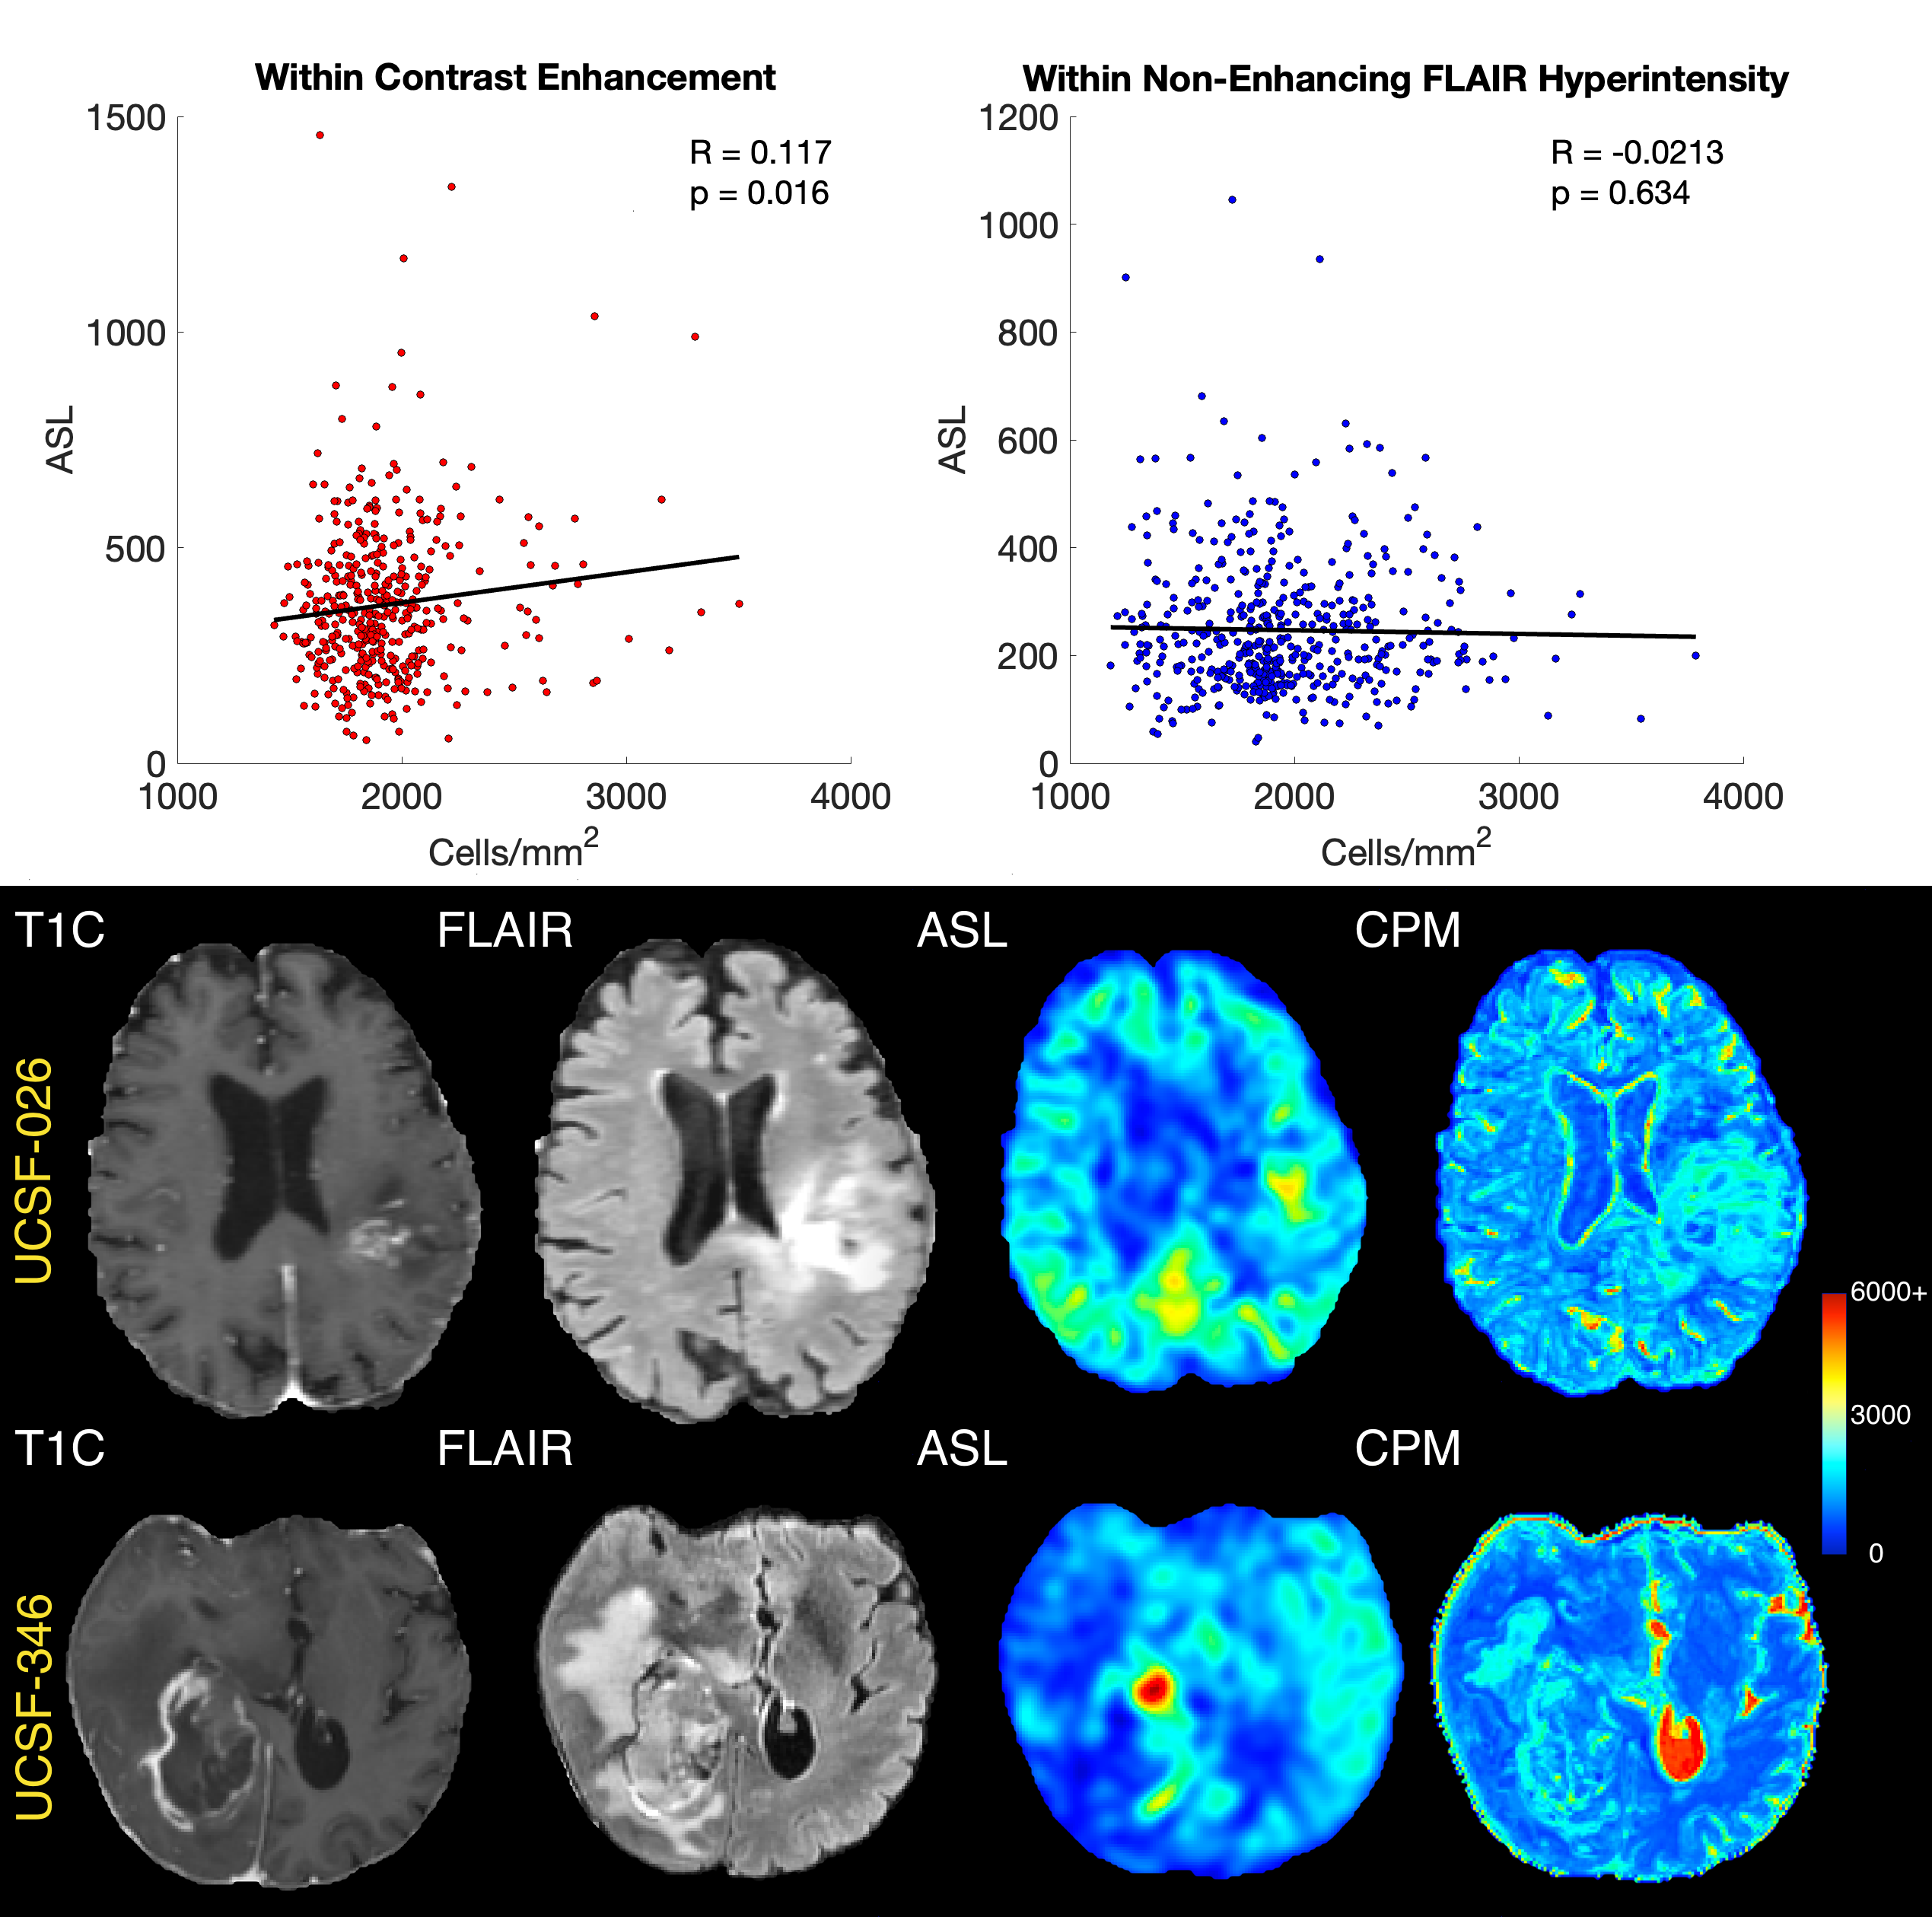
Within the PENN-GBM dataset, a positive association between rCBV and cell density was observed within contrast enhancement (R=0.280, p<0.001) but not within the non-enhancing FLAIR-hyperintense region (R=0.0162, p=0.731) (Figure 2). A similar pattern was observed in the UCSF-PDGM dataset, where again ASL and cell density demonstrated positive associations within enhancement (R=0.117, p=0.016), but not within non-enhancing FLAIR hyperintensity (R=-0.213, p= 0.634) (Figure 3). Examples at autopsy tended to support this relationship, with increased perfusion colocalizing with heightened cellularity in contrast enhancement more reliably than in non-enhancing FLAIR hyperintensity (Figure 4). A positive ASL-cell density correlation per subject within FLAIR hyperintensity was associated with worse survival prognosis (HR=3.61, p=0.045, Figure 5). Hypercellularity, occurring in areas with increased perfusion, was observed in patients with low survival, with subtle non-angiogenic hypercellularity seen in patients with longer survival.Conclusions
These results suggest that perfusion-cell density relationships can highlight aspects of tumor development related to the spatial location of tumor as well as patient prognosis. Reduced association between the two measures outside of contrast enhancement suggests that perfusion may be less sensitive to pre-angiogenic areas of hypercellularity than radio-pathomic maps of cell density. Patients with non-enhancing regions of increased cell density and perfusion had worse survival, suggesting the existence of ultimately untreated advanced disease. Future research is warranted to better understand the biological underpinnings of these relationships and to better assess their prognostic utility at the individual level for aiding clinical decision making.Acknowledgements
No acknowledgement found.References
(1) Ostrom QT, Bauchet L, Davis FG, Deltour I, Fisher JL, Langer CE, Pekmezci M, Schwartzbaum JA, Turner MC, Walsh KM, Wrensch MR, Barnholtz-Sloan JS. The epidemiology of glioma in adults: a "state of the science" review. Neuro Oncol. 2014 Jul;16(7):896-913. doi: 10.1093/neuonc/nou087. PMID: 24842956; PMCID: PMC4057143.
(2) Bobholz SA, Lowman AK, Brehler M, Kyereme F, Duenweg SR, Sherman J,
McGarry SD, Cochran EJ, Connelly J, Mueller WM, Agarwal M, Banerjee A,
LaViolette PS. Radio-Pathomic Maps of Cell Density Identify Brain Tumor
Invasion beyond Traditional MRI-Defined Margins. AJNR Am J Neuroradiol.
2022 May;43(5):682-688. doi: 10.3174/ajnr.A7477. Epub 2022 Apr 14. PMID:
35422419; PMCID: PMC9089258.
Figures
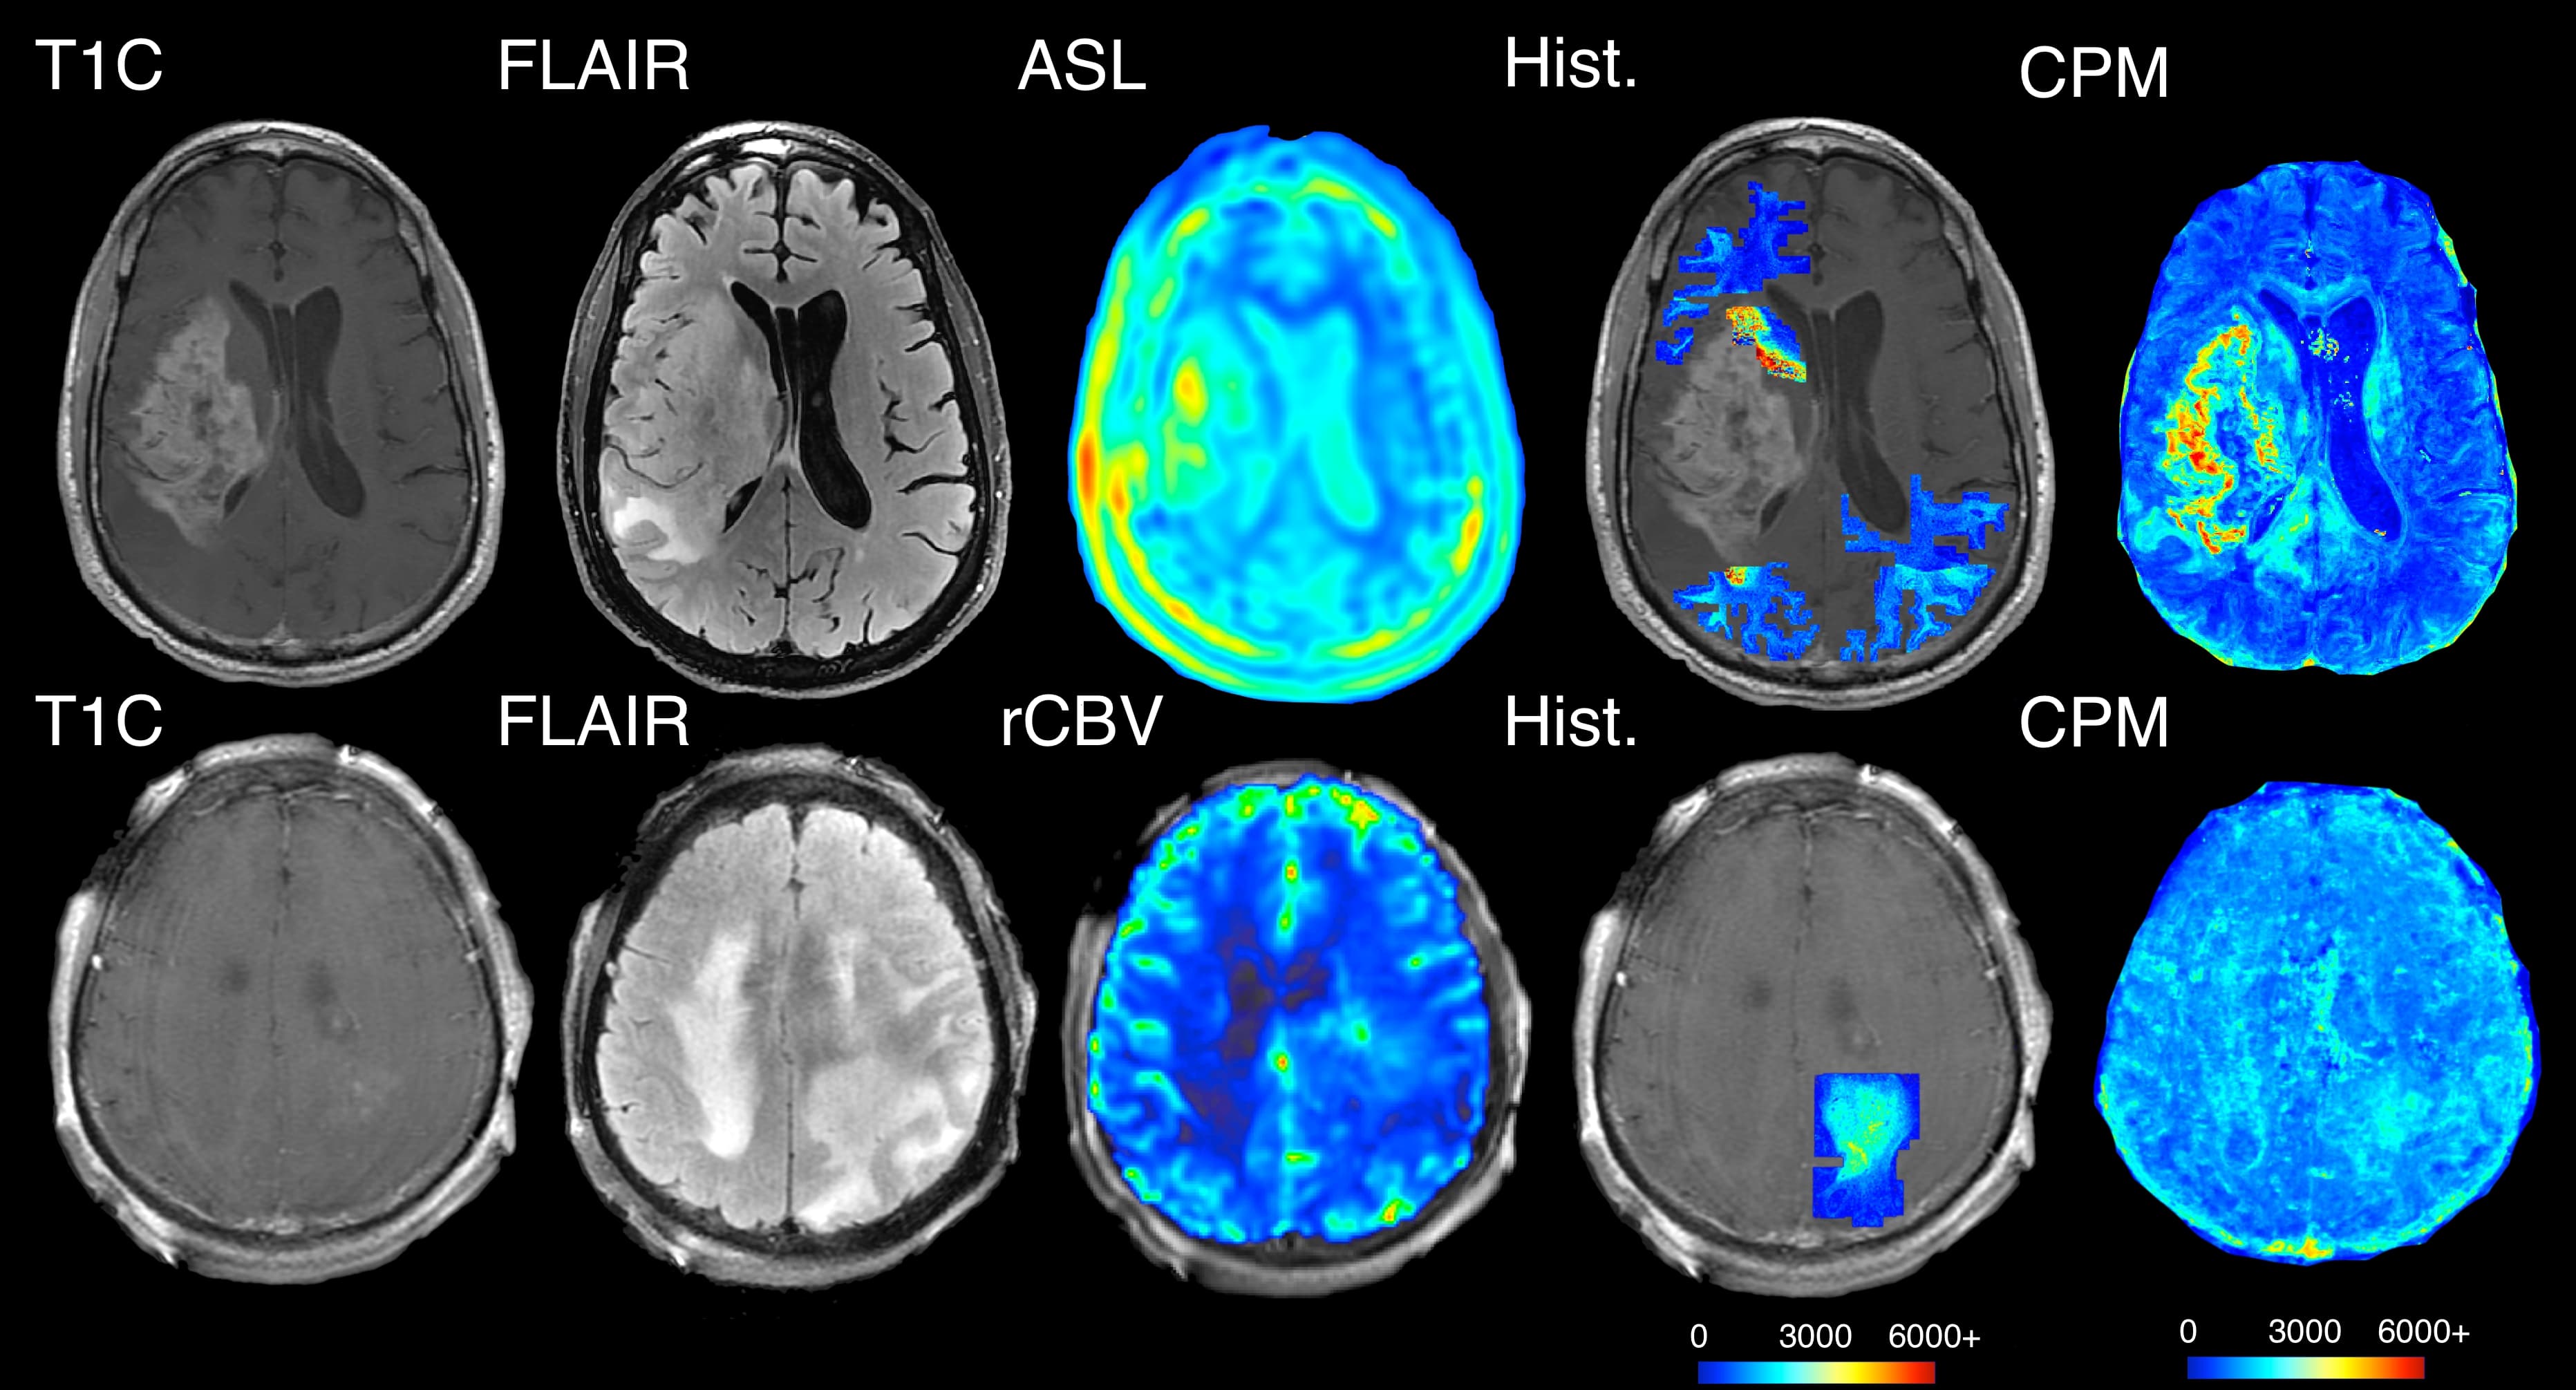
Example histology supporting the relationships seen with the predicted cellularity values, where hypercellularity exists beyond contrast enhancement in the absence of hyperperfusion.