3578
Spatial Habitats Features Derived from Multiparametric MRI Predicts Prognosis in High Grade Glioma1Department of Radiology, The First Affiliated Hospital, Sun Yat-sen University, Guangzhou, China, 2MR Research Collaboration, Siemens Healthineers Ltd., Beijing, China, 3MR Research Collaboration Team, Siemens Healthineers Ltd, Shanghai, China, 4Shanghai Key Laboratory of Magnetic Resonance, East China Normal University, Shanghai, China
Synopsis
Keywords: Tumors (Pre-Treatment), Tumor, Glioma,Tumor habitat,prognosis
Motivation: High-grade glioma (HGG) is a highly invasive neoplasm characterized by significant intra-tumoral spatial heterogeneity. However, the clinical relevance of the observed spatial and physical imaging characteristics remains unknown.
Goal(s): To identify tumor subregions and quantify their image-based habitat characteristics associated with survival time.
Approach: We retrospectively analyzed quantitative tumor habitat based on initial MRI scans in 2 groups (long-term and short-term survivals) of patients diagnosed with HGGs. Kmeans clustering, Univariate and multivariate logistic and survival analysis were used.
Results: The features of the high MK and low FLAIR habitat was most effective for predicting survival groups (AUC 0.91, Sensitivity 0.844, Specificity 0.867).
Impact: Tumor habitat is a novel method and It’s an earlier attempt to use habitats from diffusion and T1 based perfuison to predict the survival time of HGG. It has high prediction capabilities for prognosis.
Introduction
High-grade glioma (HGG) is the most aggressive intracranial tumor with a poor prognosis[1]. Most GBMs exhibit extensive regional heterogeneity, personalizing therapy for this tumor requires non-invasive tools to visualize its heterogeneity. In recent years, efforts to characterize glioblastoma’s imaging features and heterogeneity have focused on high-throughput radiomic approaches that consider a vast number of imaging variables across the tumor as a whole[2–6]. However, the application value of the spatial habitat features in evaluating survival time remains unclear. Habitat imaging is an emerging imaging technique to delineate the tumor into distinct spatial regions with shared imaging characteristics based on different pathophysiological characteristics. These regions can be visualized and their image-based habitat characteristics can be quantified to monitor their treatment response[7–12]. We investigated pretreatment magnetic resonance imaging (MRI) of HGG to identify tumor habitats and quantify their image-based spatial characteristics to evaluate the efficacy of these features in predicting survival time.Methods
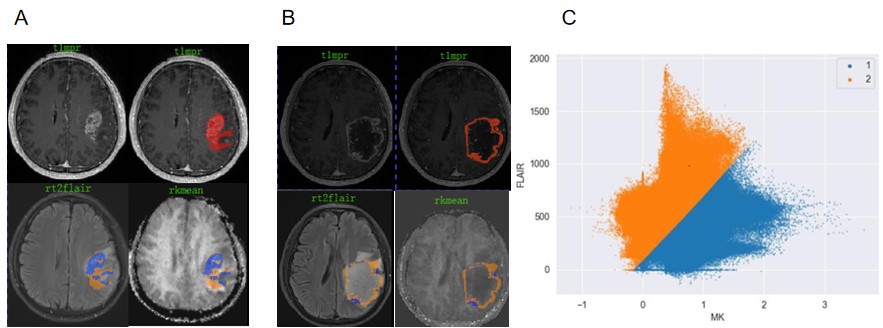
Retrospectively included forty-nine patients (female:15;average age:52) with pathology proved HGGs according to the WHO 2021. All the survival information was collected and divided into two groups with long- (>15 months, n=32) versus short-term (<15 months, n=17) survival. All the patients underwent gadolinium-contrast T1WI(T1-CE), FLAIR, dynamic contrast-enhanced MRI (DCE), and diffusion kurtosis imaging (DKI) examinations before surgery on a 3T system (MAGNETOM Prisma, Siemens Healthcare, Erlangen, Germany). DCE and DKI were further analyzed, and their corresponding parameter maps (Ktrans (Transfer constant) and MK (Mean Kurtosis)) were obtained. The DCE parameters were: TR = 4.89ms;TE=1.88ms;FOV = 220×220mm ;Flip angle=12;Averages=75;The DKI parameters were:TR=4800ms,TE=83ms, FOV=220×220mm, b-Value=0、1000、2000;Diff.directions=32. For each patient, all images were co-registered with the T1-CE and ROIs of the CE portions were manually drawn. Pairwise combination of MRI images including T1-CE, FLAIR, Ktrans and MK were grouped into 2 spatial habitats by using k-means clustering in our in-house software nnFAE (V.0.0.10) Forty spatial features were extracted by nnFAE software for each region. Mann-Whitney u-test, t-test, Univariate and multivariate regression were used to build models and select the most predictive features. ROC curve, calibration curve, nomogram, decision curve analysis (DCA), and survival analysis were performed.Results
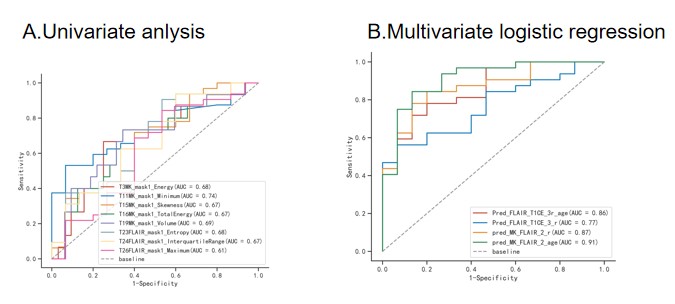
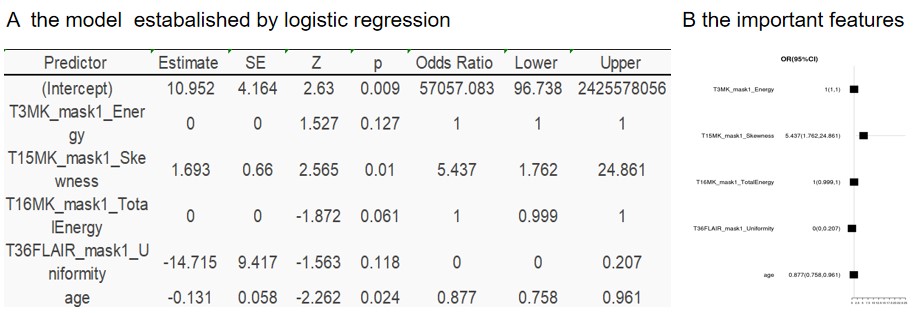
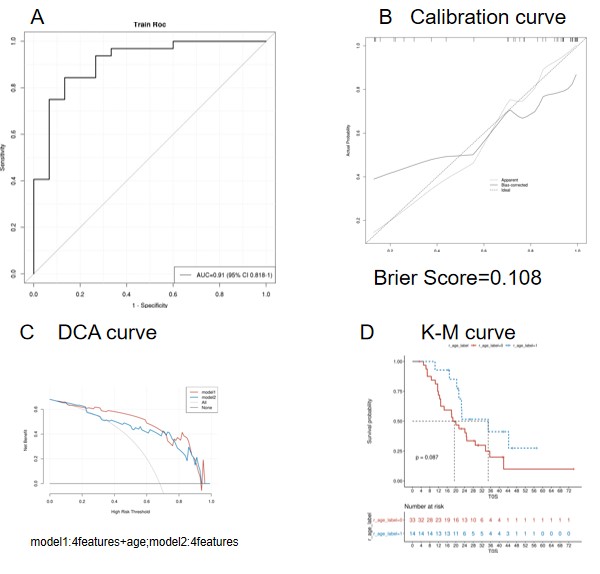
There was no statistically significant difference in mean tumor habitat volumes at diagnosis between the long- and short-term groups, although there was a trend toward smaller percent of high-enhancing tissue (High T1-CE) habitat, hyper vascular-permeability (High Ktrans), high tumor-complexity(High MK) habitat and high tumor-density(High FLAIR) in HGG with long survival compared with HGG with short survival. ROC analysis showed that MK-Minimum of mask1(high MK and low FLAIR habitat) can best predicting the survival group in univariate analysis (AUC 0.73, P<0.05). And the model based on 4 MRI features (MK-Energy ,MK-Skewness, MK-TotalEnergy, FLAIR-Uniformity) and age of mask1was most effective for predicting survival groups (AUC 0.91, Sensitivity 0.84, Specificity 0.87) . In addition, the brier score of the calibration curve about the model was 0.108 and net benefit was higher than treat-all and treat-none. Kaplan–Meier survival analyses were then carried out using the radiomics risk score (a weighted sum of radiomics features) cutpoint. Based on the optimal threshold, low and high fractions of radiomics risk score from mask1 were not associated with overall survival(P=0.087). Kaplan–Meier 3-year survival rates were 45% and 55% in the subgroups.Discussion
This was a preliminary feasibility study of tumor habitat based on T1-CE, FLAIR, MK and Ktrans to predicting long versus short-term survival in HGG. The in-house software nnFAE was independently researched and developed by the research team of our co-authors. The results suggest that habitat features based on initial MRI can predicting survival time with HGG, and the habitats based on MK and FLAIR performed better in differentiating survival groups. In addition, MK features mainly played a more important role rather than FLAIR features. Besides, mask1 was vital in predicting survival group. It has a trend toward smaller percent of mask1with long survival compared with short survival in HGG. And then, it may mean that mask1 has hyper cell complexity and thus may be correlated with poor prognosis. In further research, more participators, and in-depth description of statistics should be applied and chosen for obtaining the best MRI habitats relevant with prognosis.Conclusion
Spatial habitats features have been proven to have high prediction capabilities for survival status in HGGs, providing a set of quantifiable habitats associated with tumor permeability and complexity heterogeneity.Acknowledgements
No acknowledgement found.References
[1] The Medical Administration of the National Health Commission, the Glioma Professional Committee of China Anti-Cancer Association, and the Glioma Professional Committee of Chinese Physicians Association. Guidelines for diagnosis and treatment of brain Glioma (2022 Edition) [J]. Chinese Journal of Neurosurgery, 2022, 38 (08): 757-777.
[2] PRASANNA P, PATEL J, PARTOVI S, et. Radiomic features from the peritumoral brain parenchyma on treatment-naïve multi-parametric MR imaging predict long versus short-term survival in glioblastoma multiforme: Preliminary findings[J/OL]. European Radiology, 2017, 27(10): 4188-4197. https://doi.org/10.1007/s00330-016-4637-3.
[3] VERMA R, CORREA R, HILL V B, et. Tumor Habitat–derived Radiomic Features at Pretreatment MRI That Are Prognostic for Progression-free Survival in Glioblastoma Are Associated with Key Morphologic Attributes at Histopathologic Examination: A Feasibility Study[J/OL]. Radiology: Artificial Intelligence, 2020, 2(6): e190168. https://doi.org/10.1148/ryai.2020190168.
[4] SALA E, MEMA E, HIMOTO Y, et. Unravelling tumour heterogeneity using next-generation imaging: radiomics, radiogenomics, and habitat imaging[J/OL]. Clinical Radiology, 2017, 72(1): 3-10. https://doi.org/10.1016/j.crad.2016.09.013.
[5] RIZZO S, BOTTA F, RAIMONDI S, et. Radiomics: the facts and the challenges of image analysis[J/OL]. European Radiology Experimental, 2018, 2(1): 36. https://doi.org/10.1186/s41747-018-0068-z.
[6] NAPEL S, MU W, JARDIM‐PERASSI B V, et. Quantitative imaging of cancer in the postgenomic era: Radio(geno)mics, deep learning, and habitats[J/OL]. Cancer, 2018, 124(24): 4633-4649. https://doi.org/10.1002/cncr.31630.
[7] DEXTRAZE K, SAHA A, KIM D, et. Spatial habitats from multiparametric MR imaging are associated with signaling pathway activities and survival in glioblastoma[J/OL]. Oncotarget, 2017, 8(68): 112992-113001. https://doi.org/10.18632/oncotarget.22947.
[8] STRINGFIELD O, ARRINGTON J A, JOHNSTON S K, et. Multiparameter MRI Predictors of Long-Term Survival in Glioblastoma Multiforme[J/OL]. Tomography, 2019, 5(1): 135-144. https://doi.org/10.18383/j.tom.2018.00052.
[9] WEI J, YANG G, HAO X, et. A multi-sequence and habitat-based MRI radiomics signature for preoperative prediction of MGMT promoter methylation in astrocytomas with prognostic implication[J/OL]. European Radiology, 2019, 29(2): 877-888. https://doi.org/10.1007/s00330-018-5575-z.
[10] WU H, TONG H, DU X, et. Vascular habitat analysis based on dynamic susceptibility contrast perfusion MRI predicts IDH mutation status and prognosis in high-grade gliomas[J/OL]. European Radiology, 2020, 30(6): 3254-3265. https://doi.org/10.1007/s00330-020-06702-2.
[11] ÁLVAREZ‐TORRES M del M, FUSTER‐GARCÍA E, REYNÉS G, et. Differential effect of vascularity between long‐ and short‐term survivors with IDH1/2 wild‐type glioblastoma[J/OL]. NMR in Biomedicine, 2021, 34(4)[2022-10-16]. https://onlinelibrary.wiley.com/doi/10.1002/nbm.4462.
[12] XU X, SAMARAS D, PRASANNA P. Radiologically Defined Tumor-habitat Adjacency as a Prognostic Biomarker in Glioblastoma[C/OL]//2021 43rd Annual International Conference of the IEEE Engineering in Medicine & Biology Society (EMBC). Mexico: IEEE, 2021: 3998-4001[2022-10-13]. https://ieeexplore.ieee.org/document/9629779/.
Figures