3569
MR Vascular Fingerprinting with Deep Learning to Estimate Brain Physiological Parameters1Biomedical Engineering, University of California, Davis, DAVIS, CA, United States, 2Neurology, University of California, Davis, DAVIS, CA, United States
Synopsis
Keywords: MR Fingerprinting, MR Fingerprinting
Motivation: Magnetic resonance vascular fingerprinting quantitatively measures microvascular blood oxygen saturation, cerebral blood volume, and vessel radii. Matching simulated signals to in-vivo data is computationally expensive, therefore, we leverage deep learning to alleviate the burden.
Goal(s): Build a model to simultaneously and accurately estimate three physiological parameters from a GESFIDE (gradient echo sampling of free induction decay and echo) sequence.
Approach: The model has two fully-connected layers to estimate three parameters, and was validated with synthetic signals and healthy subject parameter mapping.
Results: The model achieves comparable root-mean-squared-error to traditional fingerprint matching in test signals. We show physiological reasonable values in healthy subject maps.
Impact: We leverage deep learning in MR vascular fingerprinting to simultaneously estimate brain physiological parameters through training with simulated vascular dictionaries. The model enables quantitative measurements of oxygenation, blood volume and vessel radius in test signals and in-vivo mapping.
Introduction
Magnetic resonance fingerprinting is a novel approach for MRI to simultaneously retrieve multiple tissue properties from a single acquisition1. Magnetic resonance vascular fingerprinting (MRvF) focuses on the quantification of cerebrovascular properties to access brain physiology and monitor disease, such as tumor progression2,3. Deep learning has recently sparked a paradigm shift in MRvF, significantly enhancing its capabilities of rapid and robust parameter reconstruction from signal evolutions4,5. These methods expedite the speed and accuracy of finding the best match between acquired data and dictionary entries, thus enabling real-time quantification of microvascular properties. In this work, we construct a neural network to estimate blood oxygen saturation (SO2), cerebral blood volume (CBV), and vessel radius (R) simultaneously from the Gradient Echo Sampling of the Free Induction Decay and Echo (GESFIDE) sequence. We trained separate networks using three simulated dictionaries corresponding to different sampling methods of the underlying vascular parameters. We compare neural network performance with traditional inner product dictionary matching algorithm.Methods
Dictionary generationWe simulated the signal evolution with a GESFIDE sequence with 40 echoes to generate a dictionary with different sets of parameters (SO2, CBV, and R) using MRVox3,6 in MATLAB. The range of each parameter is chosen to reflect healthy and disease conditions, namely 0%-100% for SO2, 0.25%-15% for CBV, and 2µm-25µm for R. We explored different sampling strategies, including regular sampling in evenly spaced intervals of 2.5% for SO2, 0.25% for CBV and 1µm for R; random sampling7 across the physiological range; and quasi-random sampling using Sobol sequences8 to achieve a more uniform distribution of points in the parameter space. Three dictionaries were generated with each 61,500 unique signal curves.
Neural network architecture and training process
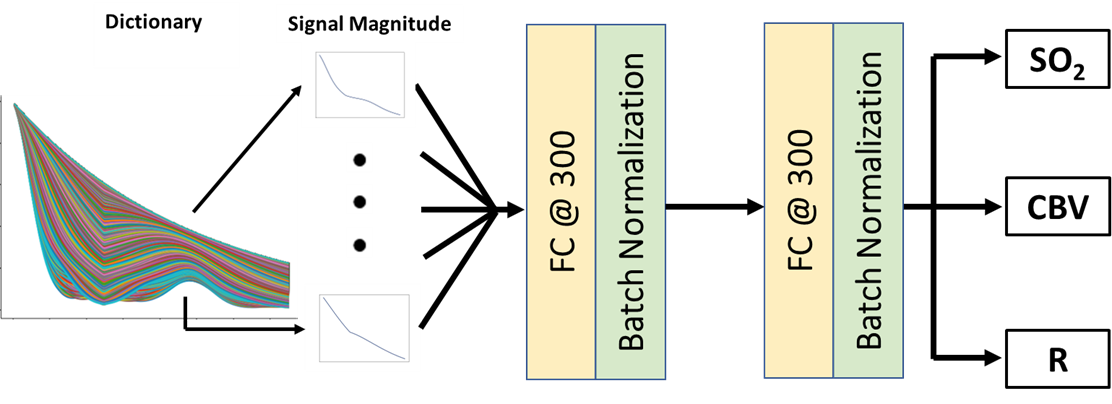
The model architecture shown in Figure 1 consists of one input layer, two hidden layers, and one output layer. Separate networks were trained using each simulated dictionary of 61,500 samples; the input can be replaced with signal courses of single voxels from in-vivo images. The hidden layers each have 300 nodes and a batch normalization layer prior feeding to the next hidden layer. The output layer has three nodes, corresponding to SO2, CBV and R. We use ReLu as the activation function and mean-absolute-error as the loss function. We use learning rate of 1*10-6 and Adam optimization with 200 epochs.
Numerical simulation and in-vivo analysis
We generated an independent set of synthetic test signals with SNR of 160, including 61,500 samples with varying SO2, CBV, and R. These test signals have known “ground truth” parameter values and served to test the accuracy of each network (for each of the three dictionaries) as well as standard dictionary matching. Retrospective GESFIDE scans in three healthy volunteers with matched TEs were also inputted into the network to estimate in-vivo vascular parameter maps. The matching procedure was repeated with each of the three networks and compared to standard fingerprint matching results.
Results and Discussions
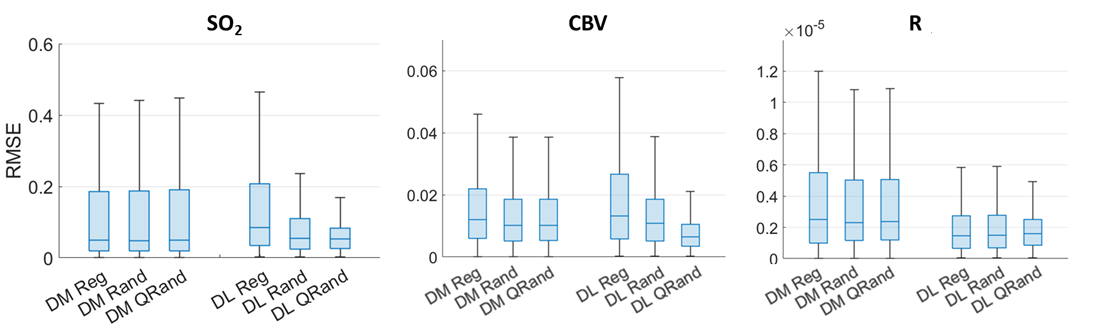
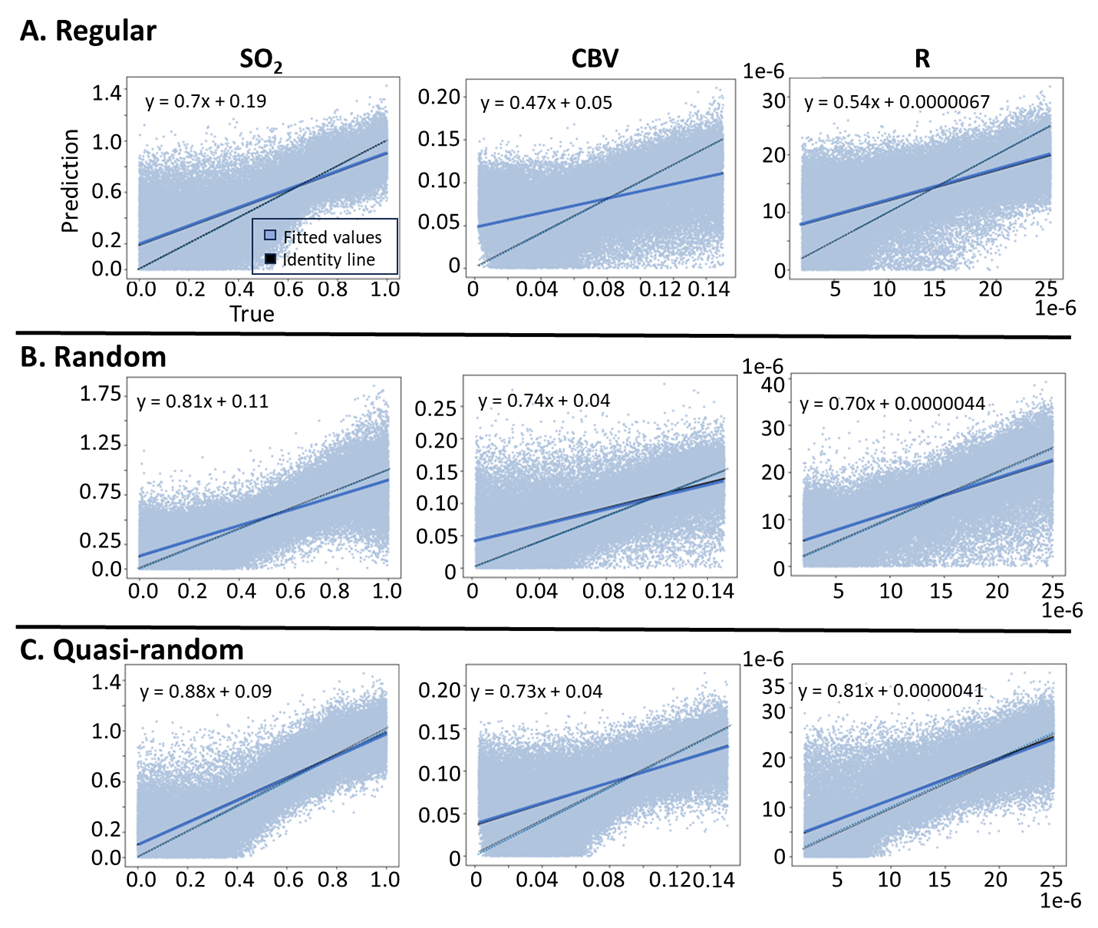
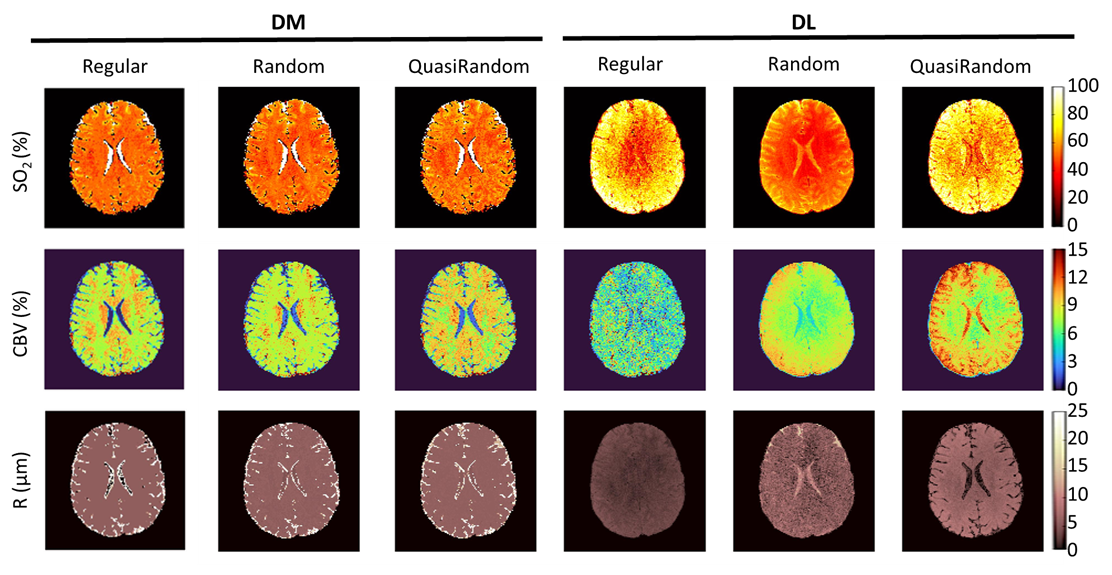
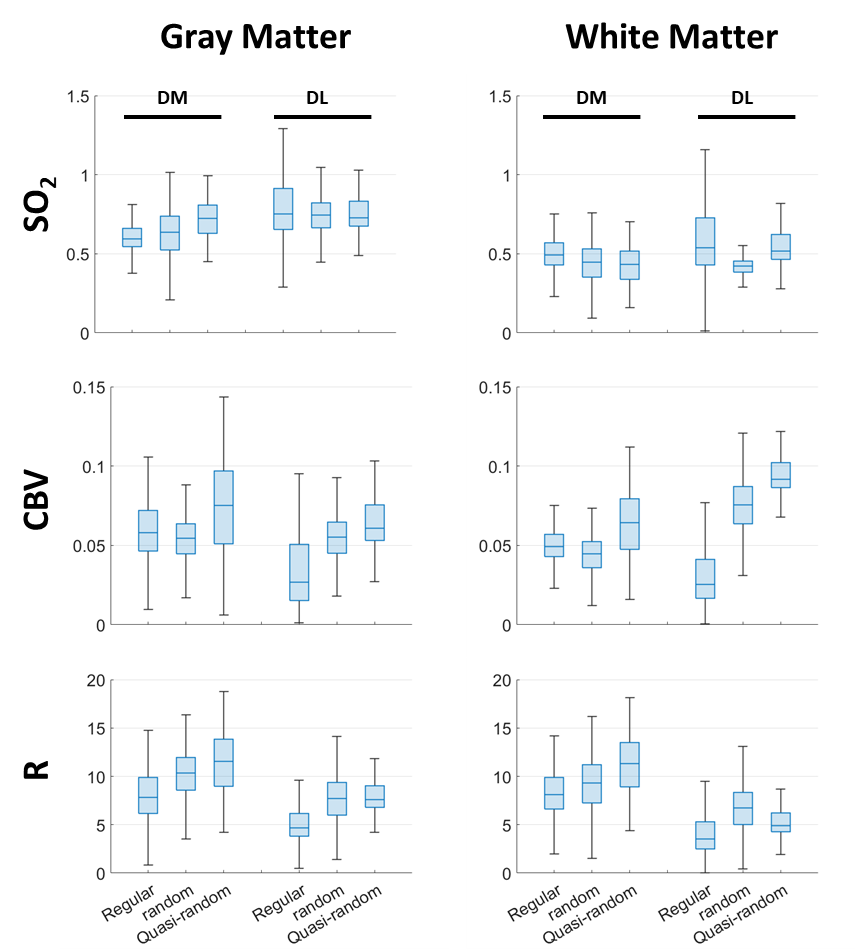
Boxplots of the root-mean-squared-error (RMSE) for each physiological parameter from numerical simulation are shown in Figure 2 and compared between dictionary matching (DM) and deep learning (DL) methods The plot shows similar RMSE median and standard deviation in DM across dictionary sampling patterns. For DL matching, the smallest standard deviation and reduced RMSE was observed for neural network trained on quasi-random dictionary compared to other dictionaries. Figure 3 provides scatter plots of predicted and actual values in DL estimations for each sampling pattern, with best performance achieved by the network trained on quasi-random samples. In-vivo parameter mapping in one subject is provided in Figure 4. DM shows similar maps across dictionary sampling patterns, with less noise when matched to a regularly sampled dictionary. For DL matching, the estimation in quasi-random method provides the most physiologically reasonable maps. Figure 5 demonstrates the quantification of gray and white matter estimates across three subjects. The network trained on quasi-random dictionary shows the lowest standard deviation of vascular parameter estimates in both tissue types.Conclusions
This study leverages a neural network to learn the simulated dictionary and enhance the matching process in MRvF. The model shows a better performance in RMSE than traditional matching when compared to underlying ground truth values in numerical simulations, with lowest median RMSE for quasi-random sampling. For in-vivo analysis, DM shows physiologically reasonable parameter mapping with the regular sampling, and DL provides viable maps with the quasi-random method. In summary, we demonstrate the integration of deep learning in MRvF and show effective vascular parameter estimations. In future work, we will perform model architecture modification for more accurate estimation and in-vivo mapping for both healthy and disease populations.Acknowledgements
This study was funded by the National Institutes of Health R21-EB032485.References
1. Ma, Dan, et al. "Magnetic resonance fingerprinting." Nature 495.7440 (2013): 187-192.
2. Lemasson, B., et al. "MR vascular fingerprinting in stroke and brain tumors models." Scientific reports 6.1 (2016): 37071.
3. Christen, Thomas, et al. "MR vascular fingerprinting: A new approach to compute cerebral blood volume, mean vessel radius, and oxygenation maps in the human brain." Neuroimage 89 (2014): 262-270.
4. Cohen, Ouri, Bo Zhu, and Matthew S. Rosen. "MR fingerprinting deep reconstruction network (DRONE)." Magnetic resonance in medicine 80.3 (2018): 885-894.
5. Zhang, Qiang, et al. "Deep learning–based MR fingerprinting ASL ReconStruction (DeepMARS)." Magnetic resonance in medicine 84.2 (2020): 1024-1034.
6. Pannetier, Nicolas Adrien, et al. "A simulation tool for dynamic contrast enhanced MRI." PloS one 8.3 (2013): e57636.
7. Barbieri, Marco, et al. "Circumventing the curse of dimensionality in magnetic resonance fingerprinting through a deep learning approach." NMR in Biomedicine 35.4 (2022): e4670.
8. Bilal, Nasir. "Implementation of Sobol’s method of global sensitivity analysis to a compressor simulation model." (2014).
Figures