3568
Rapid Multiparametric Quantitative Bilateral Breast MR Fingerprinting Using a Phase-Sensitive Deep Learning Network.1Medical Physics, Memorial Sloan Kettering Cancer Center, New York,, NY, United States, 2Radiology, Memorial Sloan Kettering Cancer Center, New York,, NY, United States
Synopsis
Keywords: MR Fingerprinting, MR Fingerprinting, Quantitative Susceptibility Mapping
Motivation: To rapidly obtain MRF-based multiparametric quantitative maps in the breast.
Goal(s): To explore the feasibility of using PS-DRONE and an EPI-MRF sequence in breast imaging to simultaneously quantify T1, T2, PD, B1, phase, and QSM maps.
Approach: MRF data were acquired at 3T. Tissue parameters were reconstructed using PS-DRONE, including QSM maps computed from the estimated phase.
Results: Bilateral breast T1, T2, PD, B1 and phase (for QSM analysis) maps were obtained using PS-DRONE and an EPI-MRF sequence. Scan time was 2 minutes and 30 seconds. Parameter reconstruction time was one second. Maps presented differences between the two breasts consistent with diffusion images.
Impact: Comprehensive quantitative T1, T2, PD, B1 and phase (QSM) bilateral breast imaging in under 2.5 minutes can potentially improve the detection and characterization of breast cancer and treatment response in a clinical setting without the use of a contrast agent.
Introduction
Quantitative MRI has enabled improved detection and characterization of breast cancer1. MR fingerprinting allows for efficient multiparametric tissue characterization within a single MRI acquisition for T1, T2 and Proton Density (PD) mapping2 and deep learning (for example DRONE3) has accelerated the parameter matching process. A phase-sensitive Deep Reconstruction Network (PS-DRONE) has been proposed to derive T1, T2, PD, B1, and phase maps in brain imaging4. However, the potential use of PS-DRONE in breast imaging is unexplored. This study aims to assess the feasibility of utilizing PS-DRONE in conjunction with an optimized EPI-MRF sequence to enable the simultaneous quantification of T1, T2, PD, B1, and phase maps in breast imaging, and to utilize the phase maps for conducting a quantitative Susceptibility Mapping (QSM) analysis, as previously demonstrated in the brain4. QSM can provide supplementary insights in breast imaging, since it can characterize cancerous lessions and calcification5.Methods
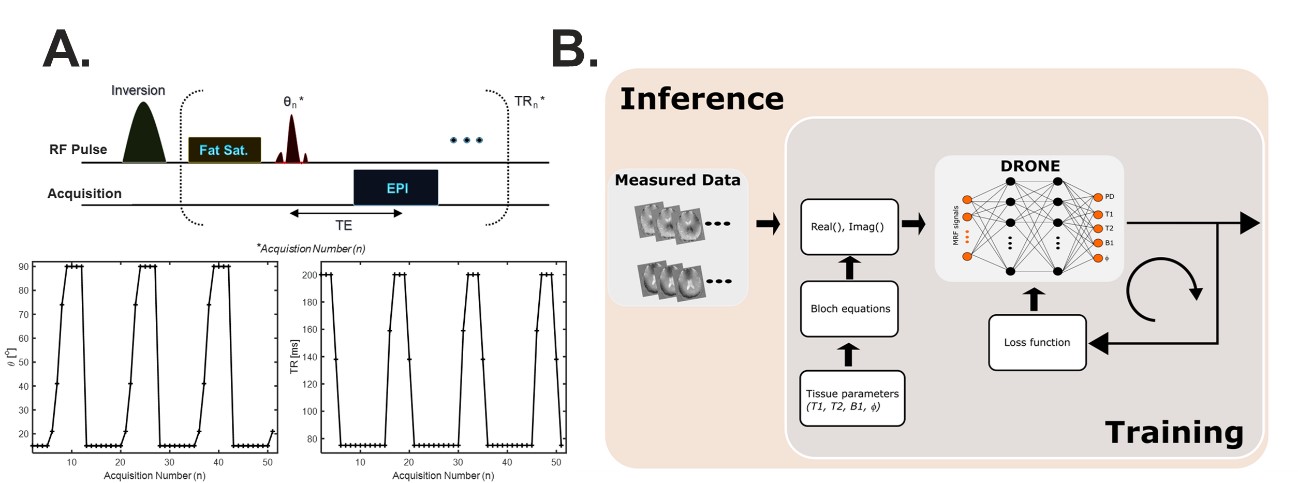
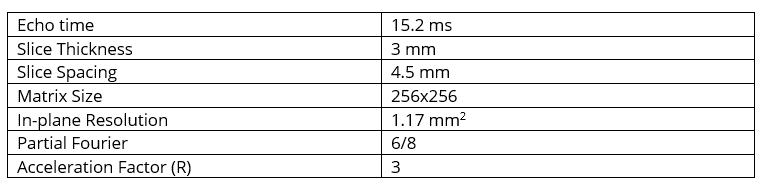
Data were acquired at 3T (Signa Premier, GE Healthcare, Waukesha, WI) on a female healthy volunteer in accordance with an approved IRB protocol. A 16-channel breast receiver coil was employed in conjunction with an EPI-based MRF sequence. A diffusion-weighted (DWI, b-values =0, 800 mm2/s) and two T2 FSE Fat and Water Separation sequences were acquired for reference.The EPI-based MRF sequence comprised a series of preparation pulses, including an adiabatic inversion and frequency-selective fat saturation. followed by n=50 excitation pulses and repetition times (θn, TRn), as outlined in Figure 1-A. The sequences parameters are summarized in Table 1. The total scan time for 20 slices was 2 minutes and 30 seconds.
PD, T1, T2, B1, and phase MRF maps were generated with PS-DRONE3 (Figure 1-B). Prior to data acquisition, the neural network was trained with a dictionary containing 400,000 entries with parameter ranges for T1= [1, 4000], T2= [1, 3000], B1= [0, 1.5], and Φ= [-π, π]. The proton density (PD) was calculated as a scaling factor from the reconstructed data. Total reconstruction time was 1 second.
The acquired phase maps were subsequently processed to produce QSM maps using the Morphology Enabled Dipole Inversion (MEDI) toolbox6. The magnitude of the derived PD map served as the image magnitude in the MEDI pipeline. A mask was manually defined. Since the network estimates the inverse of the measured phase, the phase was multiplied by a -1 factor and then unwrapped using the SEGUE and Region Growing techniques. The Projection onto Dipole Fields (PDF) method7 was applied to retrieve the local fields.
Results
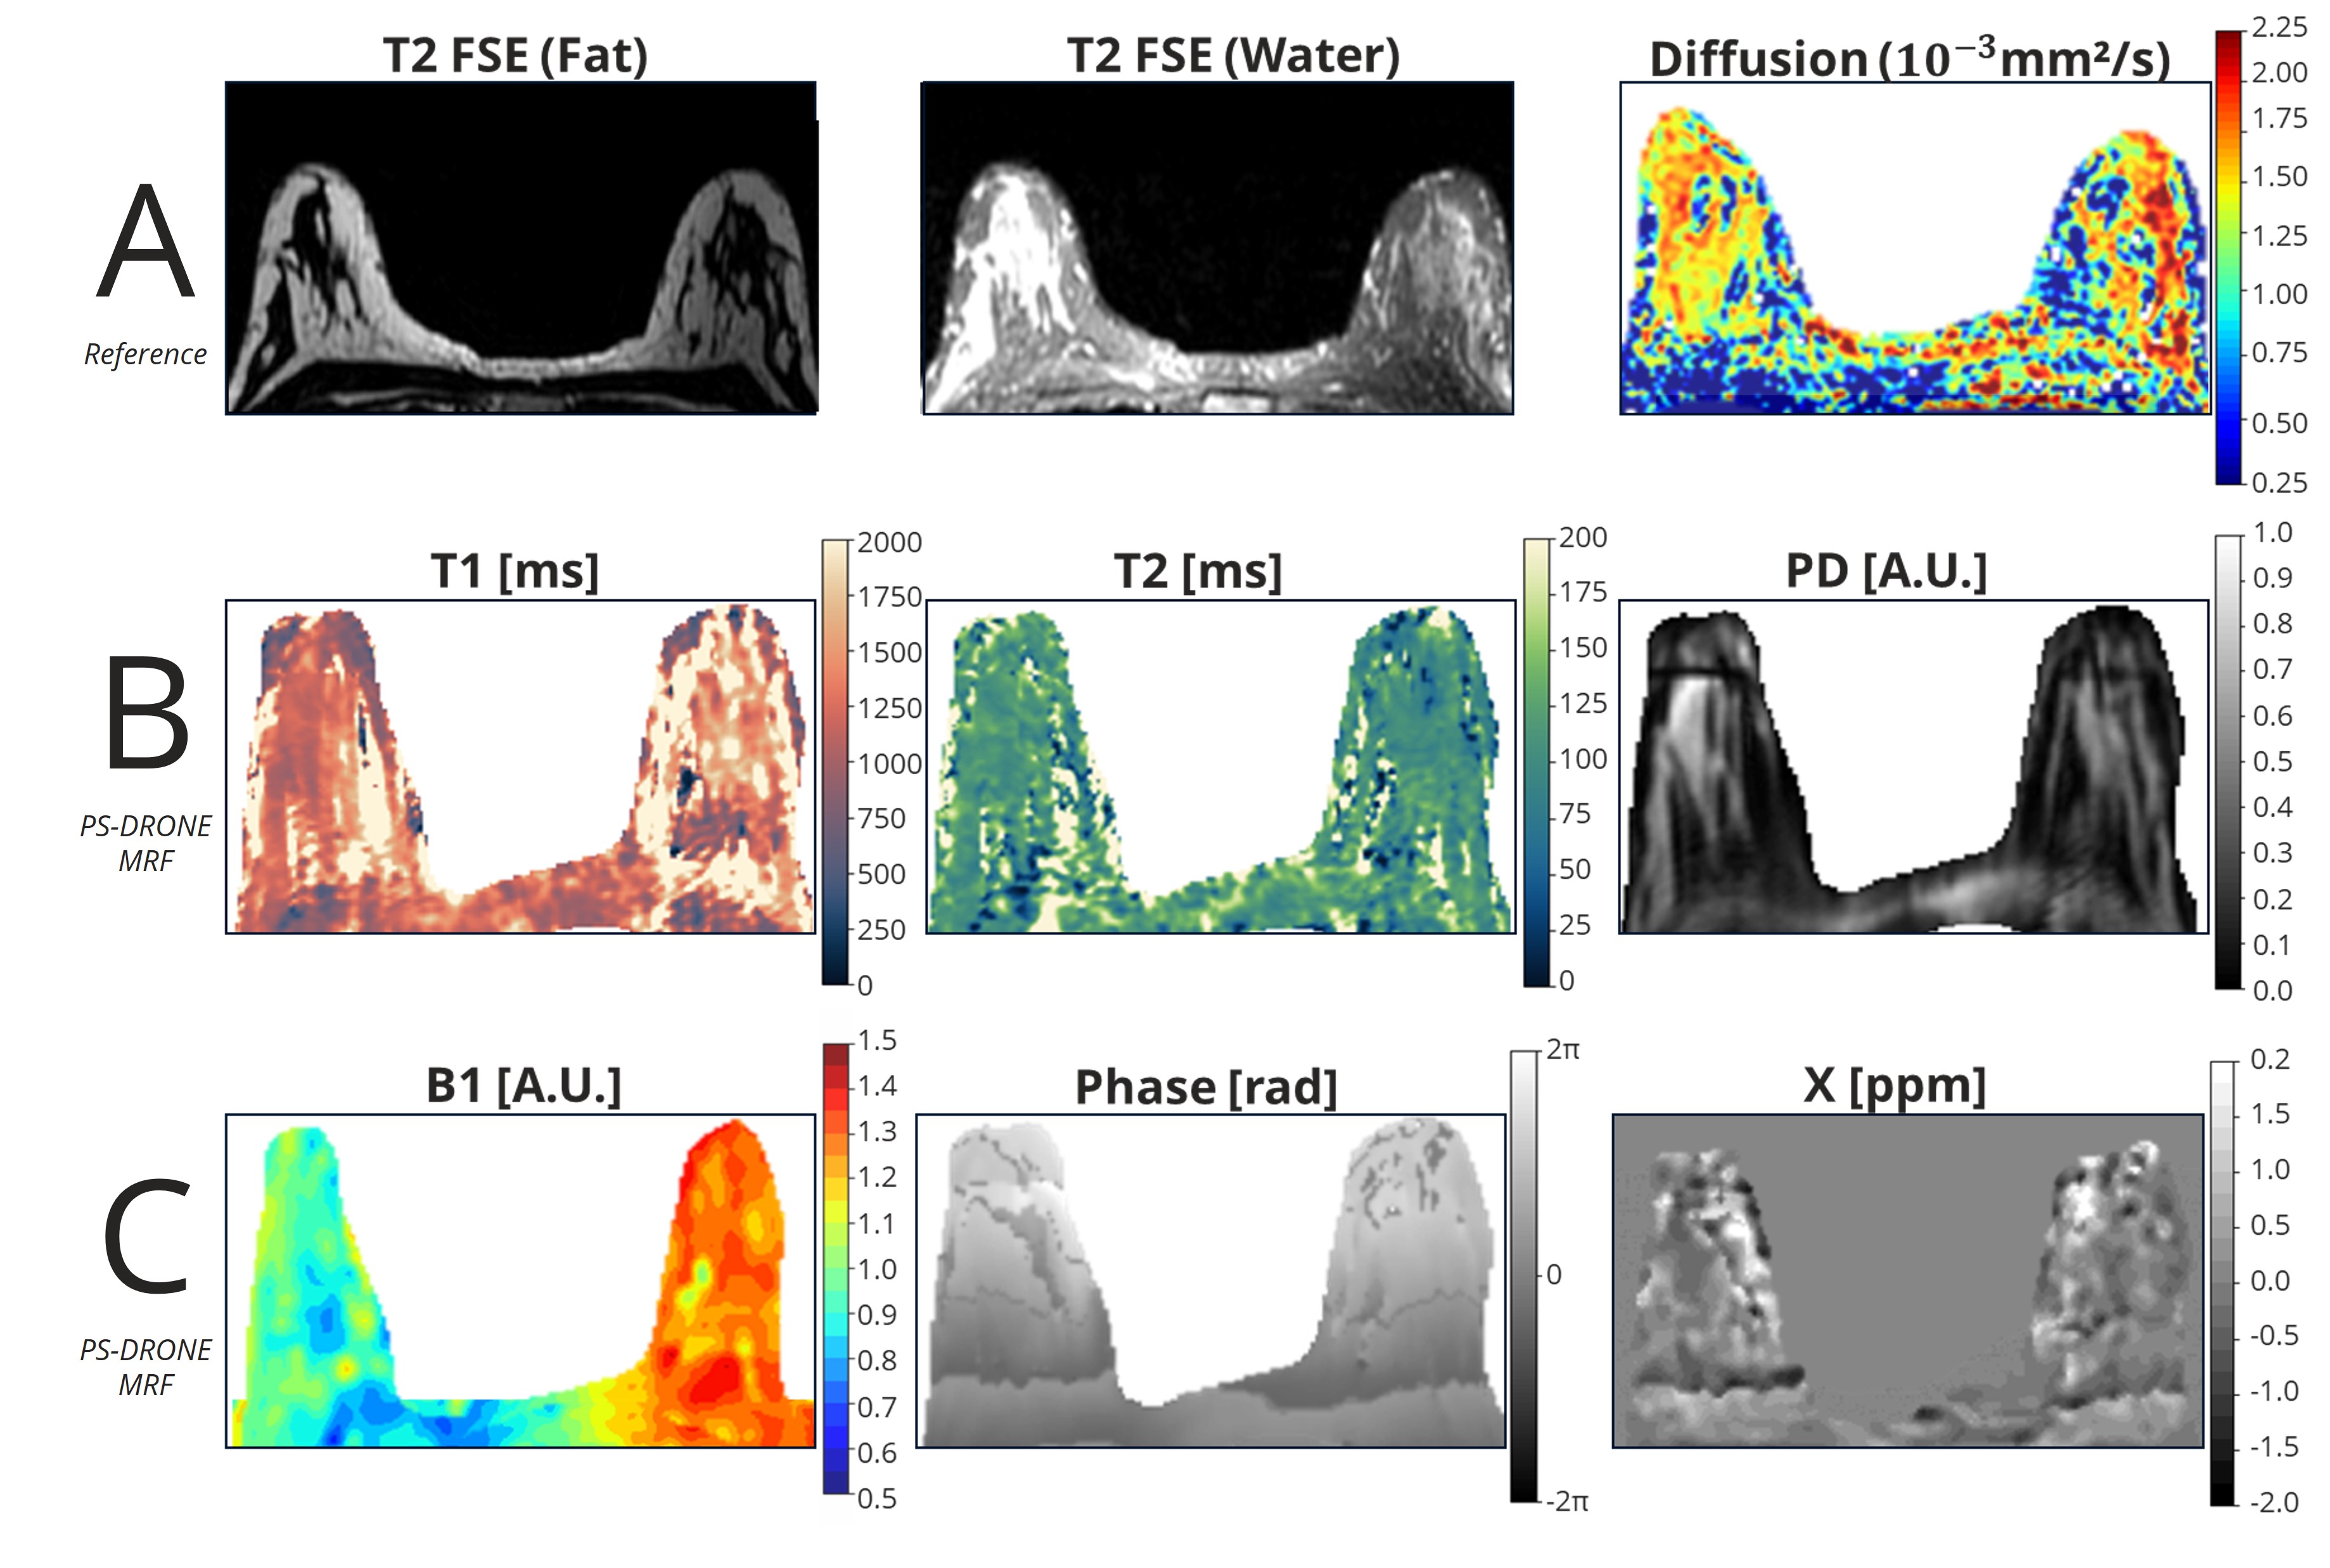
Figure 2-A displays the acquisition of the Reference Water and Fat images and the Diffusion map. Additionally, T1, T2, PD, B1, phase, and QSM maps obtained through the PS-DRONE MRF method are presented in Figure 2-B and 2-C. When comparing the left breast to the right breast, both reference and MRF maps exhibit signal variations. These variations may be attributed to B1 inhomogeneities arising from differences in tissue composition.For each breast, Region of Interests (ROIs) were manually delineated, and mean ± standard deviation values for the reference DWI maps and for the PS-DRONE MRF T1, T2, and QSM maps are summarized in Table 2.
Conclusions
The results indicate the feasibility of rapidly obtaining quantitative T1, T2, PD, B1, Phase, and QSM maps for bilateral breast imaging by using a Deep Learning-based PS-DRONE network combined with an optimized EPI-MRF sequence. The proposed approach achieved a scan time of 2 minutes and 30 seconds, with tissue parameter maps reconstructed in 1 second.When comparing the two breasts, the MRF maps revealed distinct tissue compositions. These differences were also evident in the water and fat separated FSE images and in the DWI images, suggesting that the observed differences can be attributed to heterogeneous tissue composition.
Future work will involve map validation using traditional T1 and T2 mapping methods, such as inversion recovery T1 mapping and varying-echo T2 mapping, B1 mapping, using a magnitude-based B1 mapping techniques along with QSM analysis using a multi-echo gradient-echo sequence.
Acknowledgements
This work was supported by NIH/NCI grants P30-CA008748 and R37-CA262662References
- Marino, Maria Adele, et al. "Breast MRI: Multiparametric and Advanced Techniques." Breast Imaging: Diagnosis and Intervention (2022): 231-257.
- Chen, Yong, et al. "Three-dimensional MR fingerprinting for quantitative breast imaging." Radiology 290.1 (2019): 33-40.
- Cohen, Ouri, et al. "MR fingerprinting deep reconstruction network (DRONE)." Magnetic resonance in medicine 80.3 (2018): 885-894.
- Yu, Victoria, et al. “Rapid 3D Quantitative Mapping of Brain Metastases with Deep Learning-Based Phase-Sensitive MR fingerprinting”. Proc. Intl. Soc. Mag. Reson. 2022.
- Böhm, Christof, et al. "Robust breast quantitative susceptibility mapping in the presence of silicone." Magnetic Resonance in Medicine (2023).
- Liu, Zhe, et al. "MEDI+ 0: Morphology enabled dipole inversion with automatic uniform cerebrospinal fluid zero reference for quantitative susceptibility mapping." Magnetic resonance in medicine 79.5 (2018): 2795-2803.
- Liu, Tian, et al. "A novel background field removal method for MRI using projection onto dipole fields." NMR in Biomedicine 24.9 (2011): 1129-1136.
Figures