3564
Deep Structure-Preserved Graph Embedding for Improved MRF Reconstruction1Harbin Institute of Technology, Harbin, China
Synopsis
Keywords: MR Fingerprinting, Image Reconstruction, Graph Embedding, Manifold Learning, structure-preserved, Deep Unrolling
Motivation: Improve MRF Reconstruction.
Goal(s): Introduce a novel deep-learning framework based on the structure-preserved graph embedding for improved MRF reconstruction.
Approach: We propose a reconstruction framework based on graph embedding, modeling the high-dimensional MRF data and the parameter maps as graph data nodes. To improve the accuracy of the estimated graph structure and the computational efficiency of the proposed framework, we unroll the iterative steps into a deep neural network and introduce a learned graph embedding module to adaptively learn the graph structure.
Results: Numerical experiments demonstrate that our approach can reconstruct high-quality parameter maps within reduced computational cost.
Impact: By redefining the MRF reconstruction problem as a structure-preserved graph embedding problem, the proposed method can effectively reduce the computational complexity of MRF reconstruction compared to data-priors-driven methods.
Introduction
Magnetic resonance fingerprinting (MRF) [1][2] is an emerging and promising technique for rapid and simultaneous quantitative imaging of multiple tissue parameters. However, the highly undersampled schemes used in MRF data acquisition lead to notable aliasing artifacts in reconstructed images. In addition, the inherently ill-posed reconstruction problem and high-dimensional MRF data pose challenges to achieving high-quality parameter maps.Recently, deep learning-based methods [3] have been introduced in MRF to improve the speed and accuracy of parameter map estimation. However, most of the existing approaches are less interpretable since they reconstruct parameter maps using existing network structures. In our previous work [4], we proposed a deep unrolling network based on the learned tensor low-CP-rank and Bloch response manifold priors (TLR-BM) to reconstruct high-quality MRF data and multiple parameter maps. The TLR-BM can effectively suppress aliasing artifacts and improve the quality of the reconstructed parameter maps. However, the computational complexity of the TLR-BM is relatively high, which limits its practical application in clinical settings.
Methods
The undersampled data acquisition in MRF can be modeled as: $$\mathbf b={\cal A} {\mathbf X} +\mathbf n$$Multiple parameters can be estimated by matching the reconstructed MRF data $$$\hat{\mathbf X}$$$ with the dictionary $$$\mathbf{D}$$$: $$\hat{\mathbf{M}} =\varPhi_{\mathbf{D}}(\hat{\mathbf X})$$
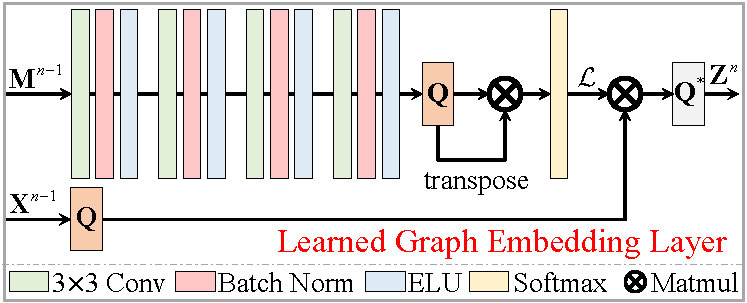
The acquired high-dimensional MRF data can be modeled as graph data nodes: $${\cal X}= \{\mathbf{Q}_{\mathbf{q}_k}({\mathbf X})\} \in \mathbb{R}^{Q\times p^2 \cdot L},\quad k=1,\cdots, Q$$ Similarly, we can obtain its low dimensional embedding: $${\cal M}= \{\mathbf{Q}_{\mathbf{q}_k}({\mathbf M})\} \in \mathbb{R}^{Q\times p^2 \cdot l}$$ where $$$l\ll L$$$ is the number of multiple tissue parameters. $$$\mathbf{Q}_{\mathbf{q}_k}(\cdot)$$$ denotes the operator that extracts data patch centered at the spatial location $$$\mathbf{q}_k$$$. The intrinsic graph of the high-dimensional MRF data can be represented as a weighted Homogeneous graph $$${\cal G} = ({\cal X}, {\cal W})$$$, where $$${\cal W}$$$ denotes the weight matrix. However, directly estimating the weight matrix from the acquired high-dimensional MRF data is challenging, as the acquired data are highly undersampled and noisy. We propose to estimate the weight matrix of the high-dimensional MRF data by using the corresponding multiple parameters. By introducing the Laplacian matrix [5], the general structure-preserved graph embedding framework for MRF reconstruction can be formulated as: $$\min_{\mathbf{X}}\frac{1}{2} \|{\cal A}\mathbf{X}-\mathbf{b}\|_F^2 + \frac{\lambda}{2} {\rm tr}({\cal X}^T{\cal L}{\cal X})$$ We utilize matrix operation to represent the graph data nodes as $$${\cal X} = \mathbf{Q}{\mathbf X}$$$. $$$\mathbf{Q}$$$ is the operator that extracts data patches from MRF data $$$\mathbf X$$$ and arranges them into a Casorati matrix. The artificial distance measurement method may be biased in estimating the weight matrix. In addition, the hyperparameters need to be tuned empirically, which is tedious and not robust. To address these issues, we unroll the iterative optimization process into a deep neural network and introduce a learned graph embedding module to adaptively learn the graph structure. The iterative update rule can be represented as: $$\mathbf{M}^{n} = \varPhi_{\mathbf{D}}(\mathbf{X}^{n-1})$$ $$\mathbf{Z}^n = \mu \lambda \mathbf{Q}^*{\cal L} \mathbf{Q}{\mathbf X}^n$$ $$\mathbf{X}^{n}=\mathbf{X}^{n}-\mu({\cal A}^*{\cal A}\mathbf{X}^{n}-{\cal A}^*\mathbf{b})-\mathbf{Z}$$ The proposed unrolled network, termed DSP-GE Net, is defined based on the three steps, which are named the parameter matching layer $$$\mathbf{M}^{n}$$$, the learned graph embedding layer $$$\mathbf{Z}^n$$$, and the reconstruction layer $$$\mathbf{X}^{n}$$$, respectively. The overall framework is illustrated in Fig.1. Fig.2 illustrates the proposed learned graph embedding (LGE) layer.
Experiments
The datasets used in this study consist of two parts: simulation data and in vivo data. The in vivo data were acquired from 8 healthy volunteers across 10 slices each. Each volunteer was scanned using a 1000-length FISP sequence with a 32-channel head coil, acquiring 2880 samples in each frame. The simulation data was generated under the same imaging parameters, using the parametric map taken from Brainweb. ~10% of the dataset was used for testing and the rest for training.We compared our proposed algorithms against several state-of-the-art methods, including SL-SP (model-based method) [6], SCQ (end-to-end network) [3], and TLR-BM (data-priors-driven unrolling network) [4].
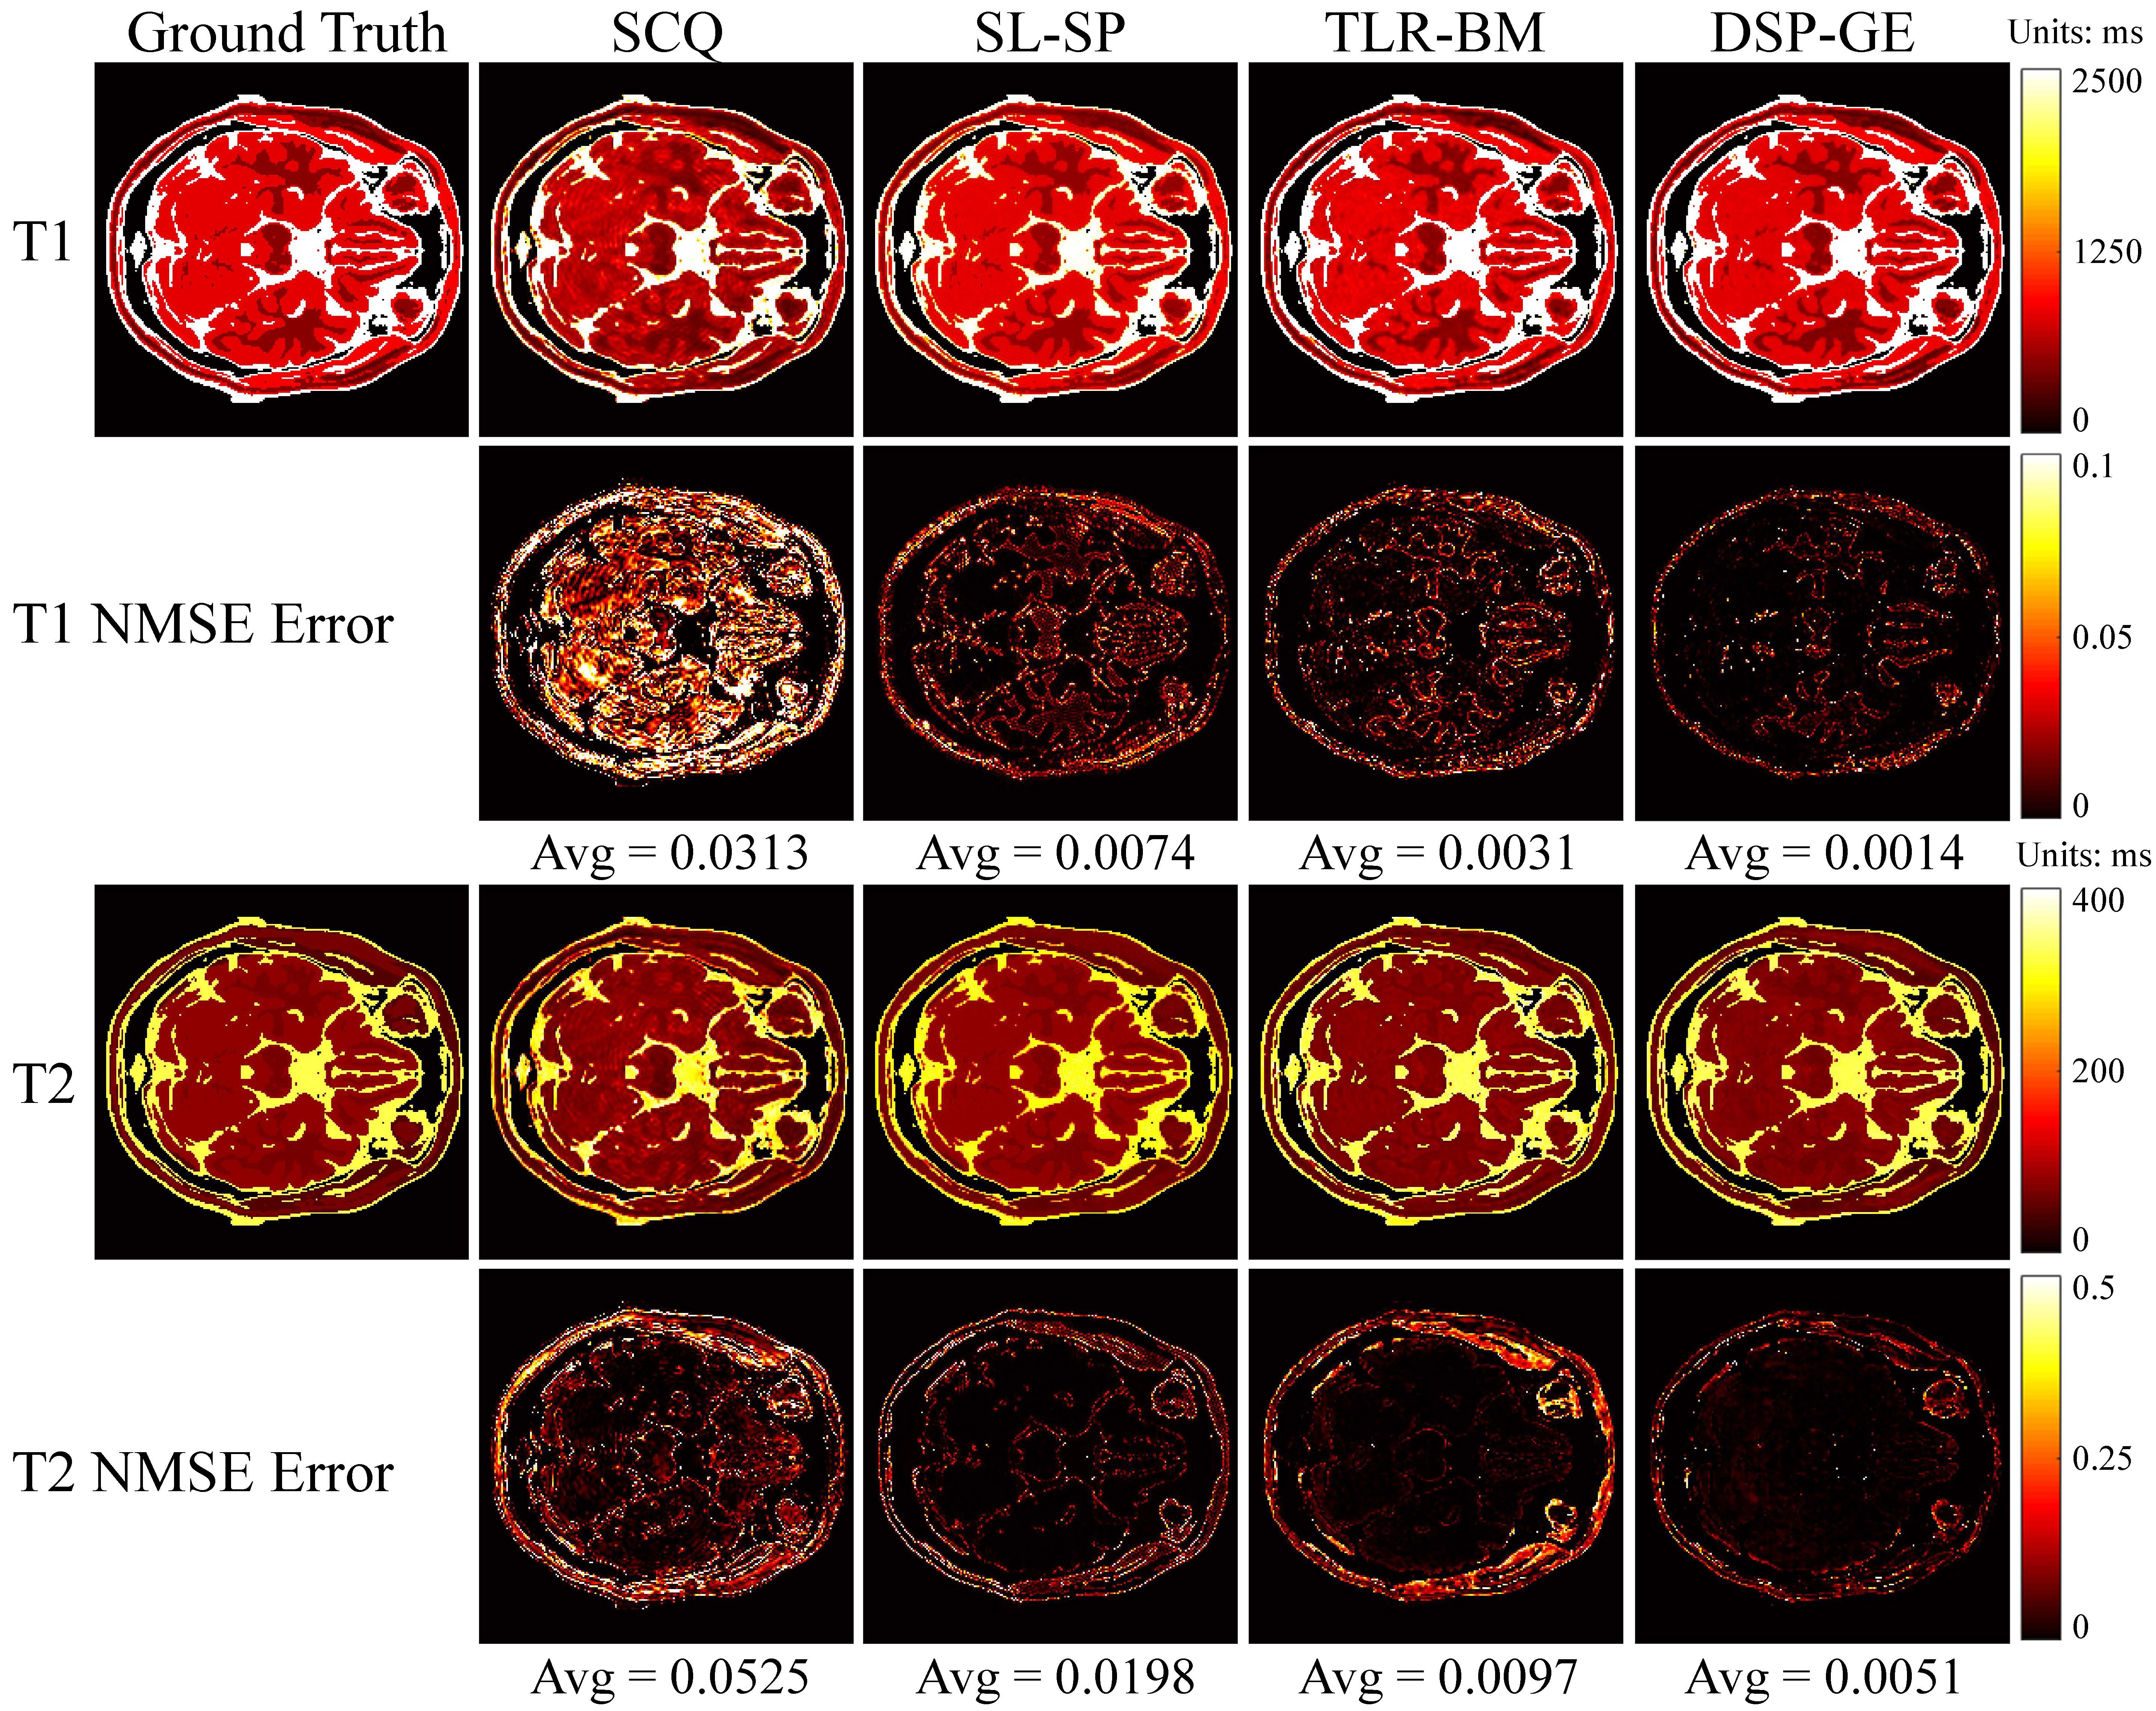
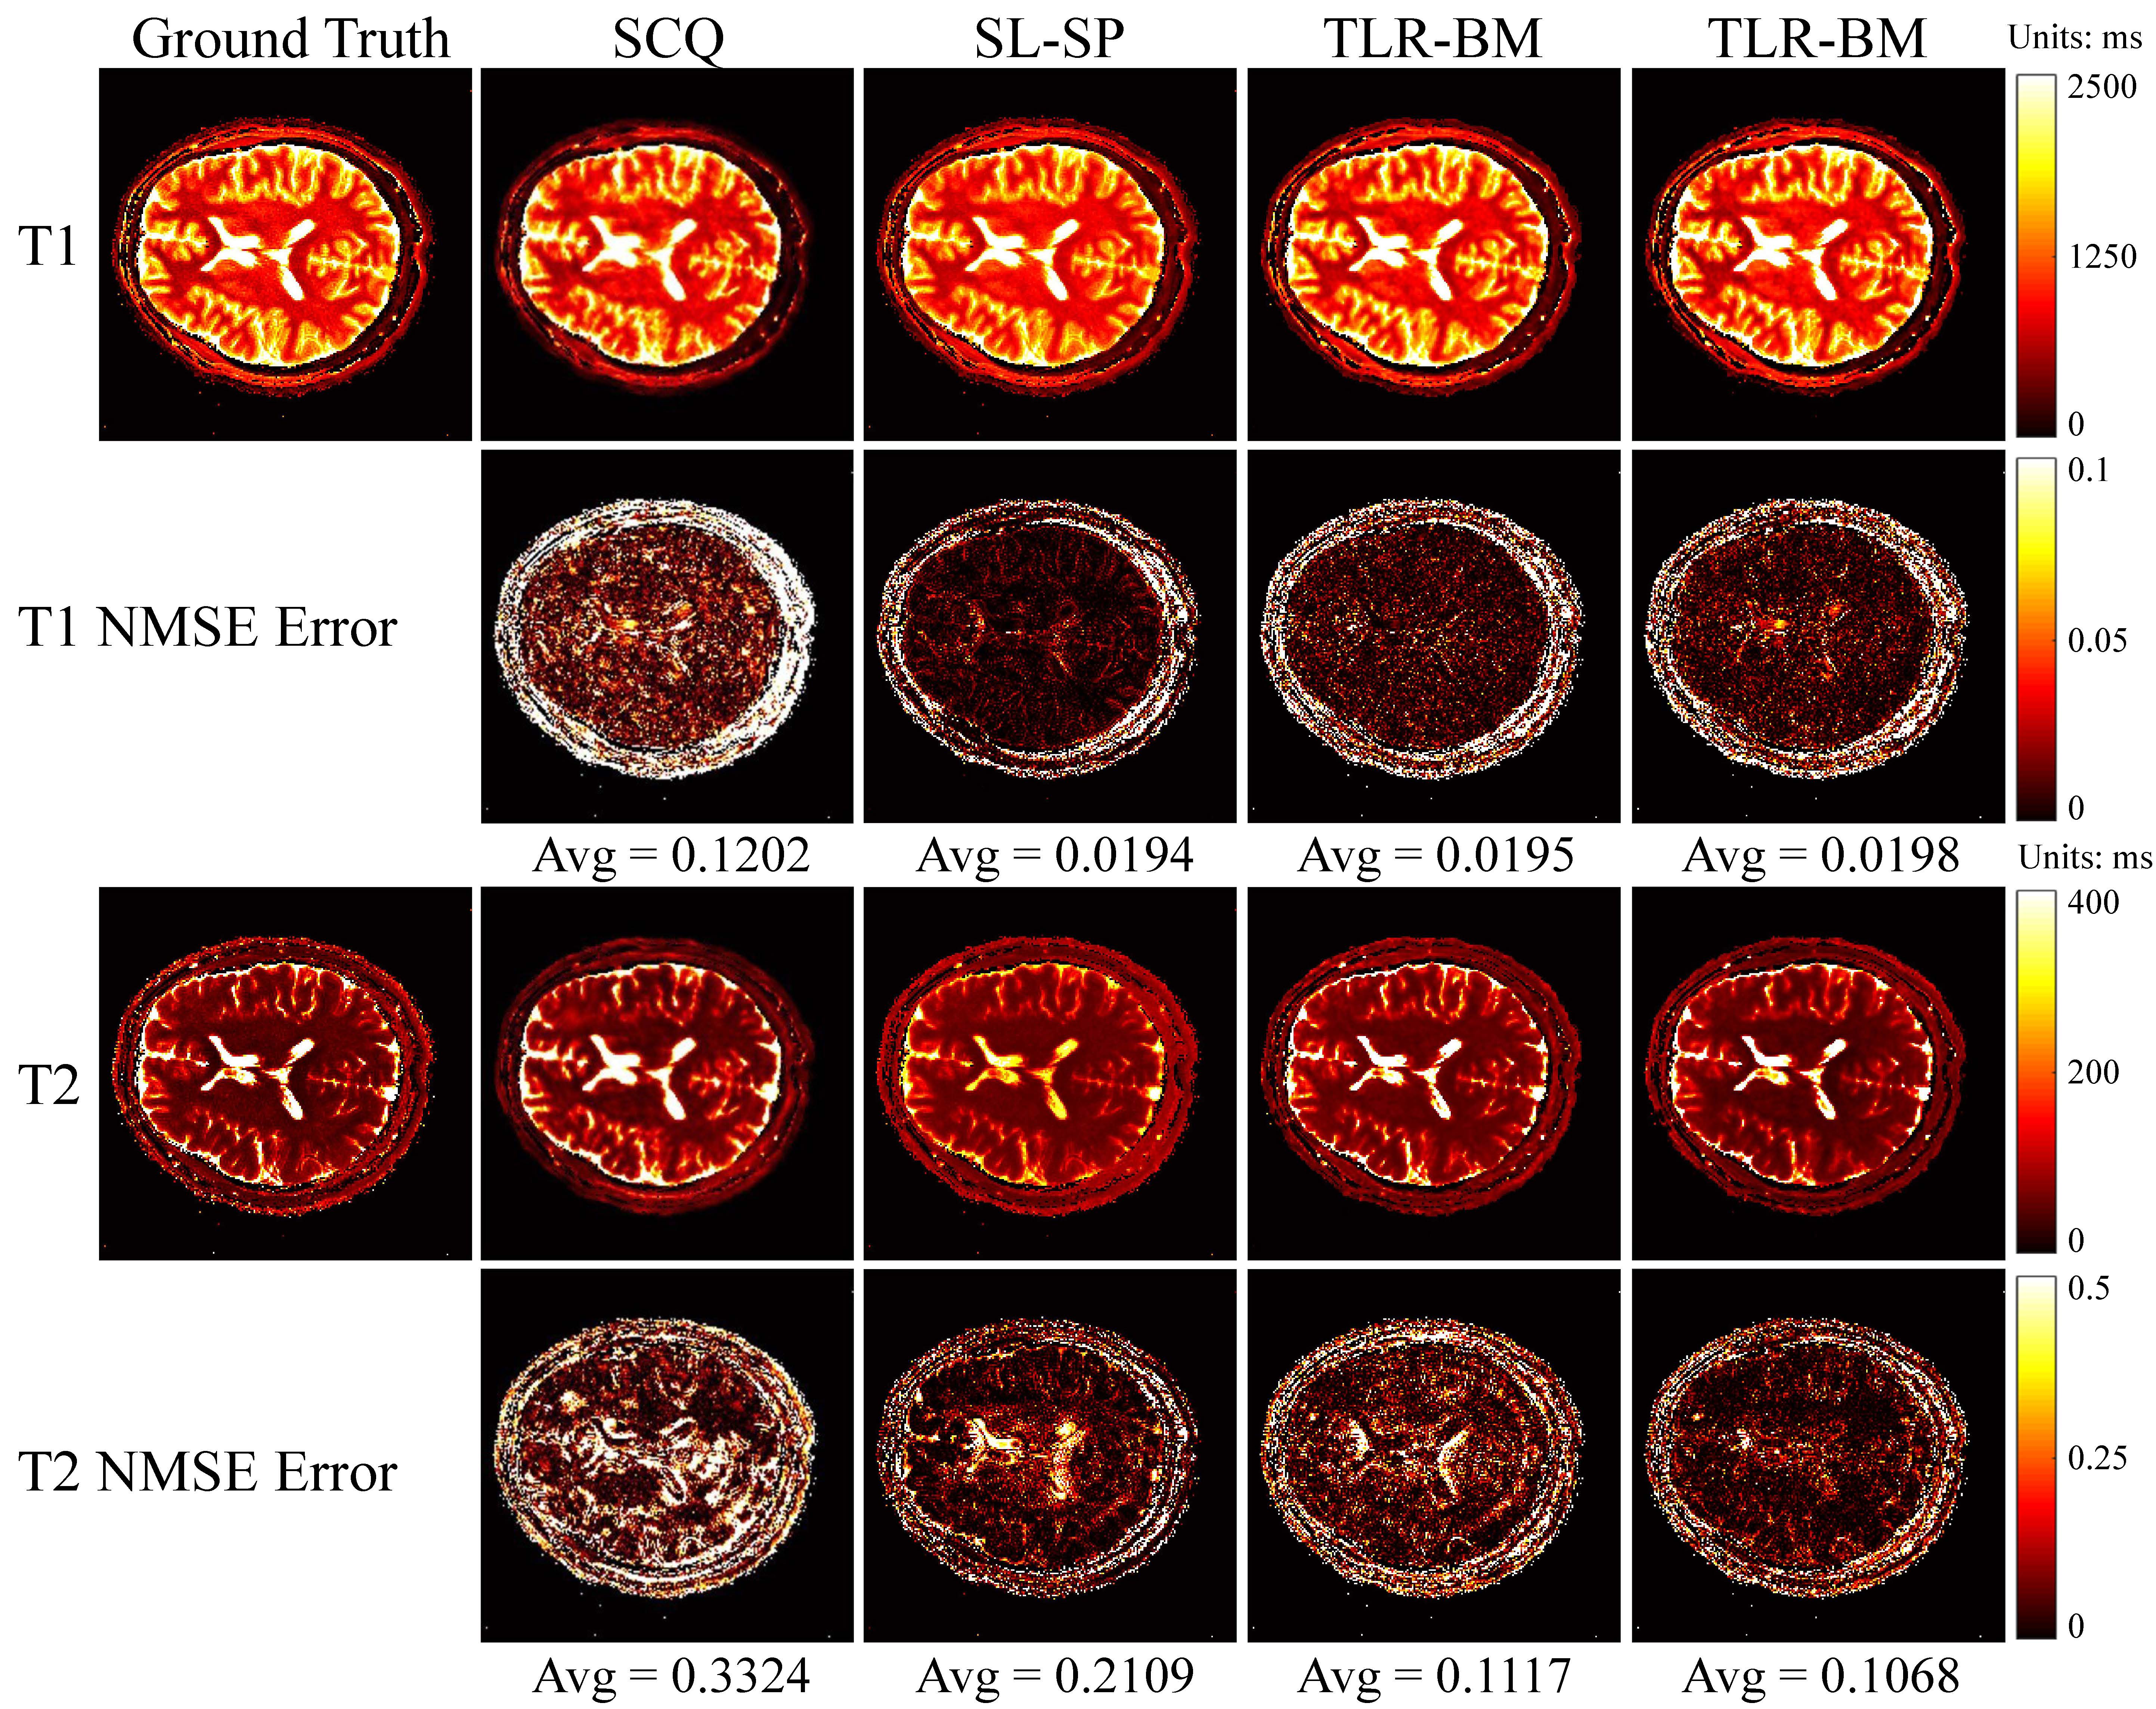
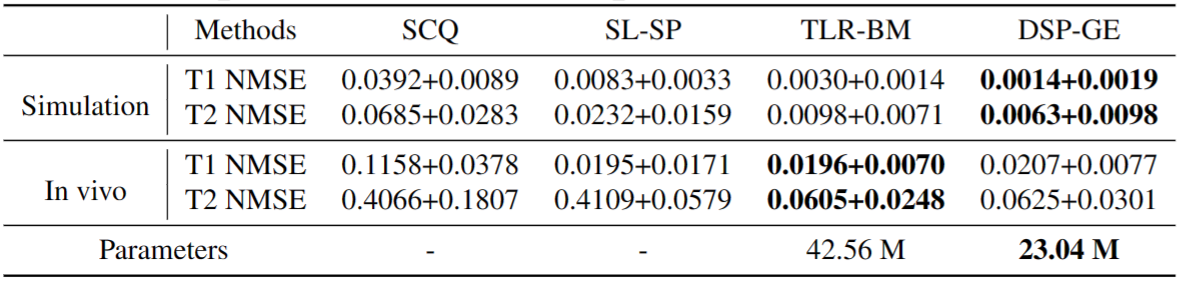
Fig.3 and Fig.4 show the parameter maps reconstructed by different methods from one set of simulated data and in vivo data in the test dataset, respectively. Table.1 reports quantitative comparison results of different methods on the test dataset. We used the normalized mean square error (NMSE) to measure the quality of the reconstructed parameter maps. Experimental results show that our proposed method outperforms the SCQ and SL-SP methods in terms of reconstruction accuracy. Compared to the TLR-BM method, our proposed method has a comparable reconstruction performance but only requires half the number of network parameters.
Acknowledgements
This work is supported by Natural Science Foundation of Heilongjiang YQ2021F005, China NSFC 61871159 and the Fundamental Research Funds for the Central Universities.References
[1] Dan Ma, Vikas Gulani, and et al., “Magnetic resonance fingerprinting,” Nature, vol. 495, no. 7440, pp. 187–192, 2013.
[2] Charit Tippareddy, Walter Zhao, and et al., “Magnetic resonance fingerprinting: an overview,” European Journal of Nuclear Medicine and Molecular Imaging, pp. 1–12, 2021.
[3] Zhenghan Fang, Yong Chen, and et al., “Deep learning for fast andspatially constrained tissue quantification from highly accelerated datain magnetic resonance fingerprinting,” IEEE transactions on medicalimaging, vol. 38, no. 10, pp. 2364–2374, 2019
[4] Peng Li and Yue Hu, “Learned tensor low-cp-rank and bloch responsemanifold priors for non-cartesian mrf reconstruction,” IEEE Transac-tions on Medical Imaging, 2023.
[5] Mikhail Belkin and Partha Niyogi, “Laplacian eigenmaps for dimensionality reduction and data representation,” Neural computation, vol. 15, no. 6, pp. 1373–1396, 2003.
[6] Yue Hu, Peng Li, and et al., “High-Quality MR Fingerprinting Re-construction Using Structured Low-Rank Matrix Completion and Sub-space Projection,” IEEE Transactions on Medical Imaging, vol. 41, no.5, pp. 1150–1164, 2021.
Figures