3563
TransUnet Based Deep Learning with Tissue-weighted Loss Function for Accelerated Magnetic Resonance Fingerprint Reconstruction1Center for Brain Imaging Science and Technology, Zhejiang University, Hangzhou, China, 2College of Biomedical Engineering and Instrument Science, Zhejiang University, Hangzhou, China, 3Department of Radiology, Stanford university, Stanford, CA, United States, 4Graduate School of Education, Stanford university, Stanford, CA, United States, 5State Key Laboratory of Modern Optical Instrumentation, College of Optical Science and Engineering, Zhejiang University, Hangzhou, China, 6School of Physics, Zhejiang University, Hangzhou, China, 7State Key Laboratory of Brain-Machine Intelligence, Zhejiang University, Hangzhou, China
Synopsis
Keywords: MR Fingerprinting, Image Reconstruction, transformer, MRF, reconstruction, reproducibility
Motivation: MRF data with short time frames make dictionary matching challenging with large quantitative errors.
Goal(s): We proposed a deep learning method by taking account in global Information and tissue-specific relaxometry, for better quantitative results using shorter frames than dictionary matching with good reproducibility.
Approach: We proposed to combine Unet with an embedded transformer and a tissue-weighted loss function. We compared our approach to dictionary matching and examined various levels of reduced scan time.
Results: The proposed method has less error with shorter frame data comparing dictionary matching. This is more effective for the gray matter and for scan times shorter than 300 frames.
Impact: The proposed method improves the problem of poor quality of reconstructed images for dictionary matching in shorter frames, in addition this method has good repeatability and provides a powerful reconstruction algorithm for MRF sequence acceleration.
Introduction
MRF sequences often downsample the K-space or reduce the time frames to compress the acquisition time. Dictionary matching methods rely on the number of time frames, and fewer time frames face the challenge of larger reconstruction errors[1]. As an improvement, deep learning methods have been reported to achieve reliable quantification. Most of the existing methods [1,2,3] fully rely on CNN to reconstruct parameters, which allows the model to obtain information from neighbouring voxels. However, the distant voxels that also contained the information related to the same type of tissues did not be taken into account in CNN. Furthermore, Loss function design for previous deep learning methods is singular and lacks priori information. Although there are differences in quantification errors across tissue types and relaxation parameter, they are treated equally in the model learning process. In this work, we used the TransUnet model[4] and designed the tissue relaxation parameter specificity loss, namely TransUnet-TPSL. The results demonstrated significantly improved quantification of T1 and T2 relaxomertry at varying levels of reduced scan time when compared to dictionary matching.Methods
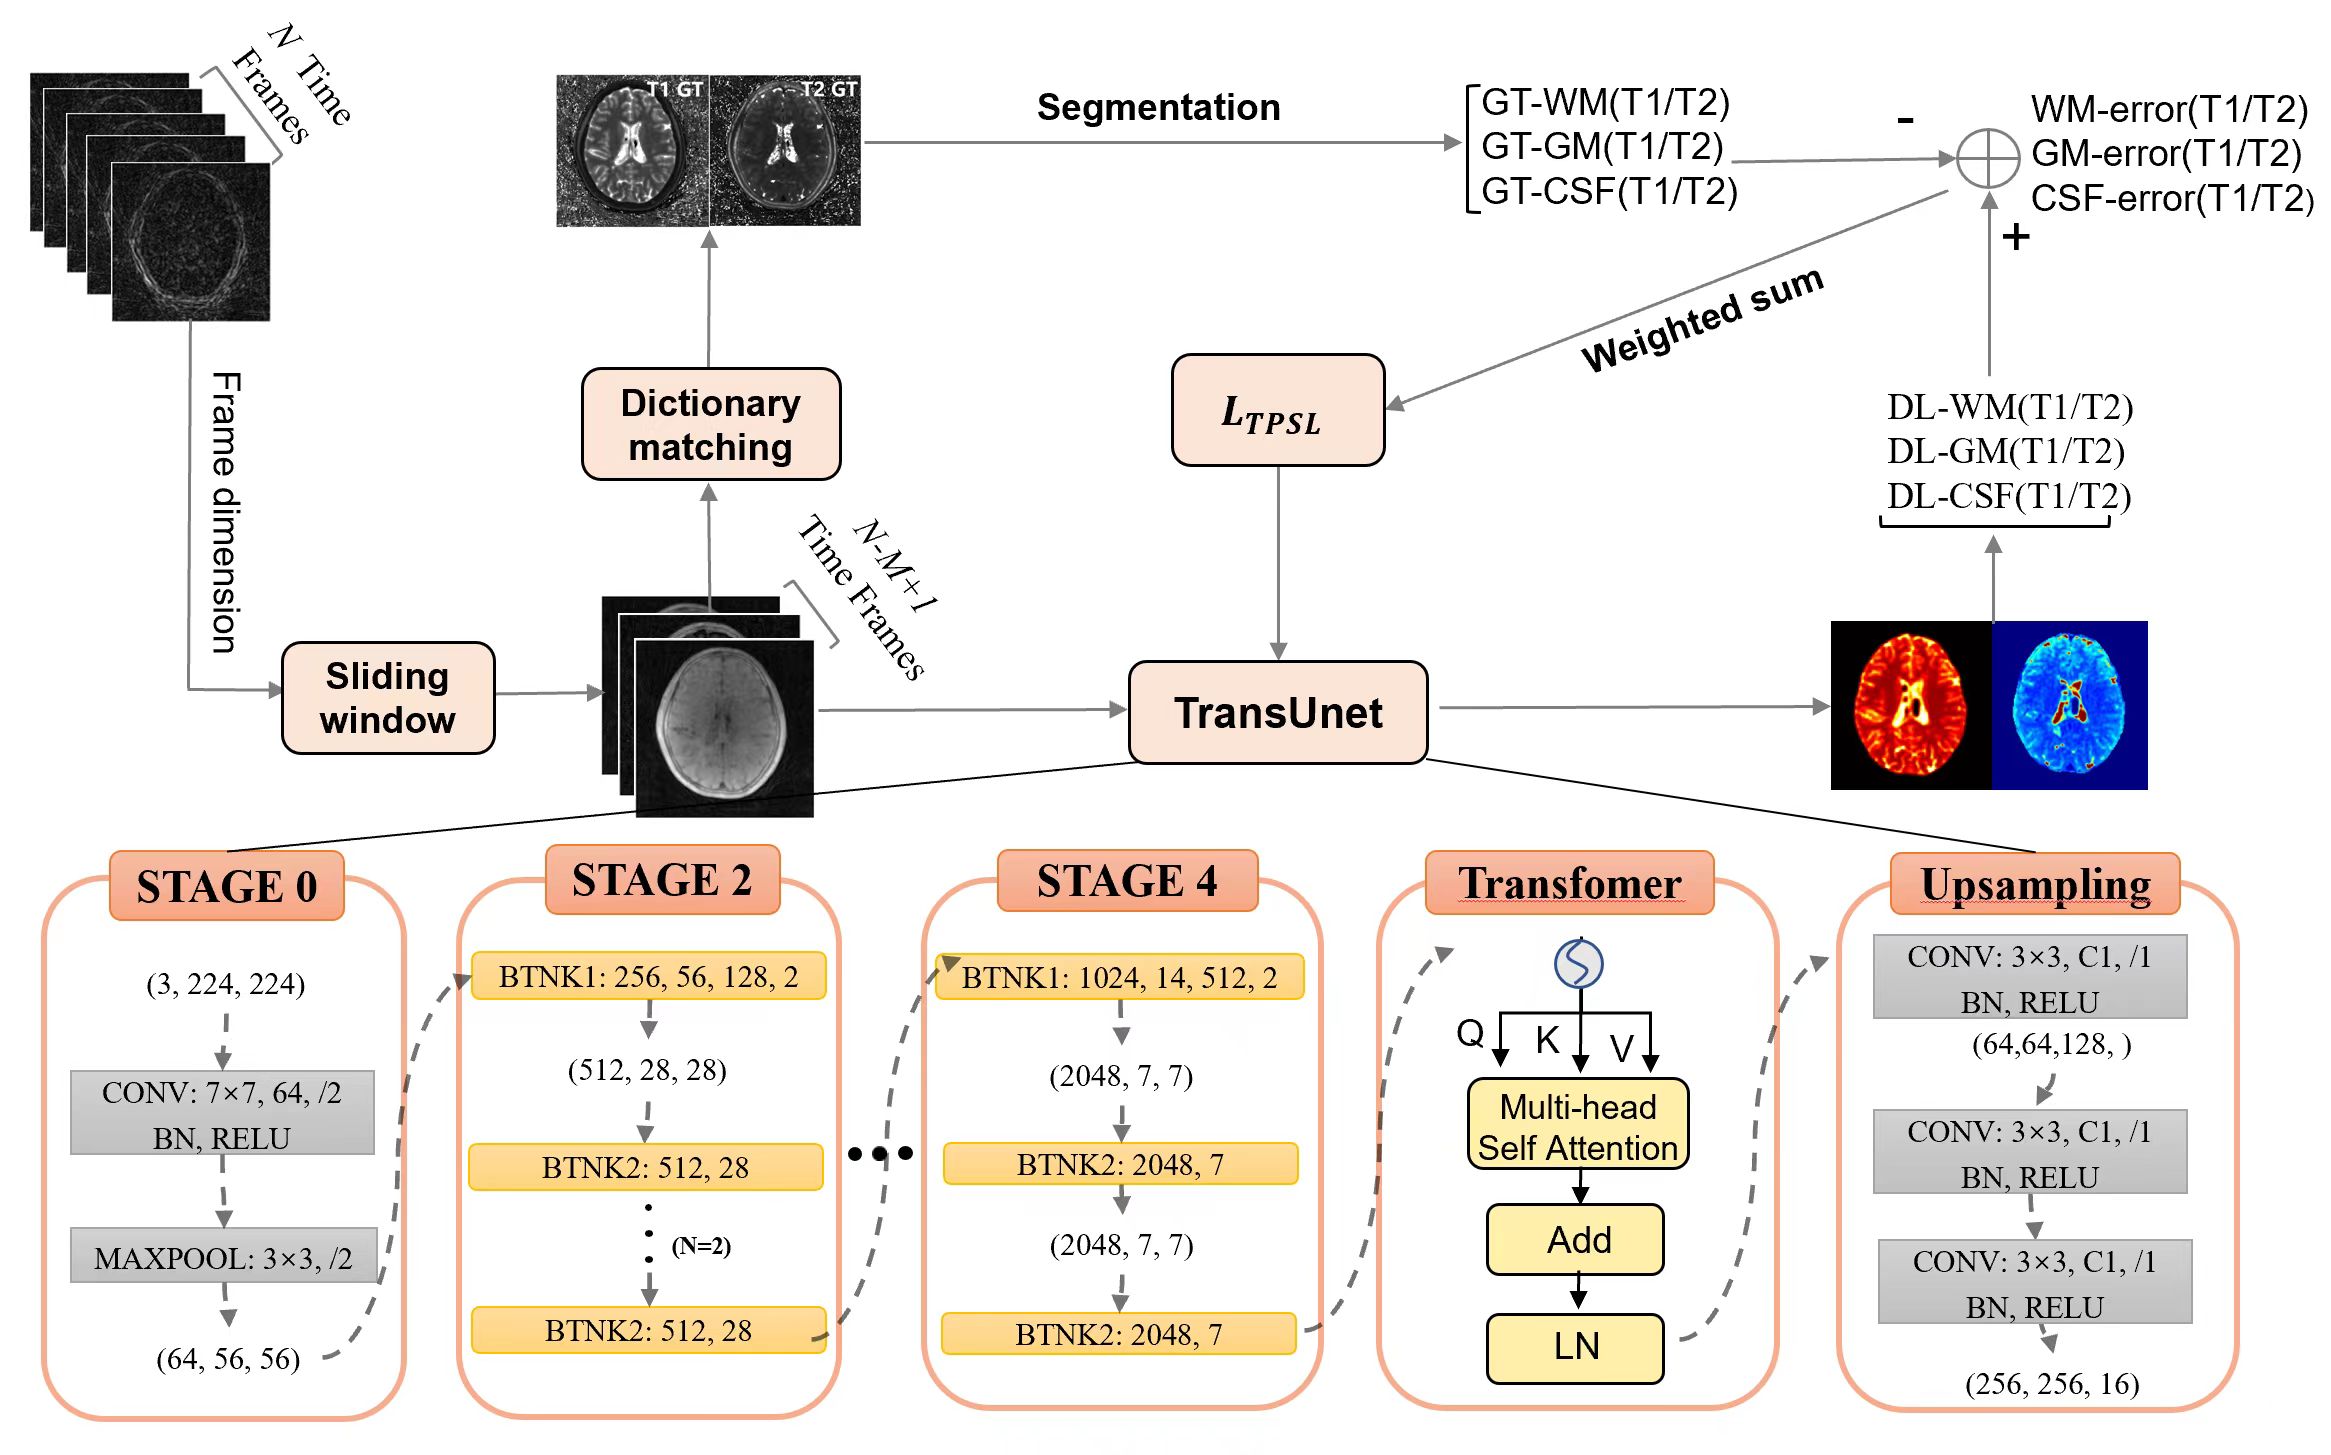
Model structure: Our proposed model combines the base structure of Unet with an embedded transformer module in the downsampling section. To extract tissue contrast information, the raw data is averaged using a sliding window. Additionally, a block in the downsampling process allows for the extraction of detailed information, encoding the raw image as spatially dimensioned patches. These patches are then passed through the transformer module, which leverages the self-attention mechanism to capture correlations between distant voxels belonging to the same tissue species. This enables improved tissue quantification.Loss design:Focal Loss [5] is denoted by FL as the basic loss function strategy, FL(p)=-(1-p)log(p), assigning different weighting to based on the size of the value. If we take the quantitative accuracy $$$k_{i,j}=(1-e_{i,j})$$$ as p, $$$e_{i,j}$$$ is quantitative errors, more accurate the quantification, the weighting (1-$$$k_{i,j}$$$) is smaller. We hope to make the model sensitive to different tissue and relaxation parameters by this way. Specifically, we classified the tissues into three types (white matter, grey matter, cerebrospinal fluid), each with two relaxation parameters T1,T2. For different tissue and relaxation parameters, quantitative errors $$$e_{i,j}$$$, quantitative errors calculated using the following formula:$$e_{i,j}=mean(|\frac{T_j^{DL}(x_{i})-T_j^{GT}(x_{i})}{T_j^{GT}(x_{i})}|),T=(T_{1},T_{2})$$, i is the tissue type index, j is the index of relaxation parameters,x is voxels belonging to different tissue. $$$T_j^{DL}(x_{i}) $$$is the model inference result. $$$T_j^{GT}(x_{i}) $$$is the ground truth. So for each combination, $$$FL(1-e_{i,j})=-e_{i,j}log(1-e_{i,j})$$$. As the final form,$$$L_{TPSL} = \sum_1^{i,j}FL(1-e_{i,j})$$$ .
Dataset: A total of fourteen participants were acquired with a 3D UTE-MRF sequence[6], of which thirteen were used for training and one for testing, with each participant having 220 slices.
Result & Discussion
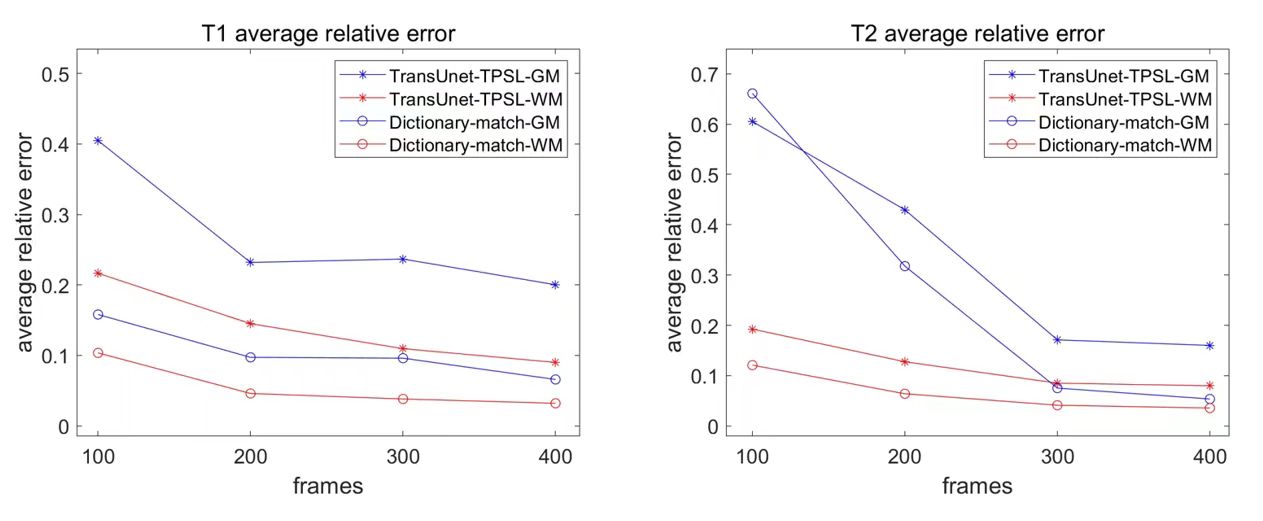
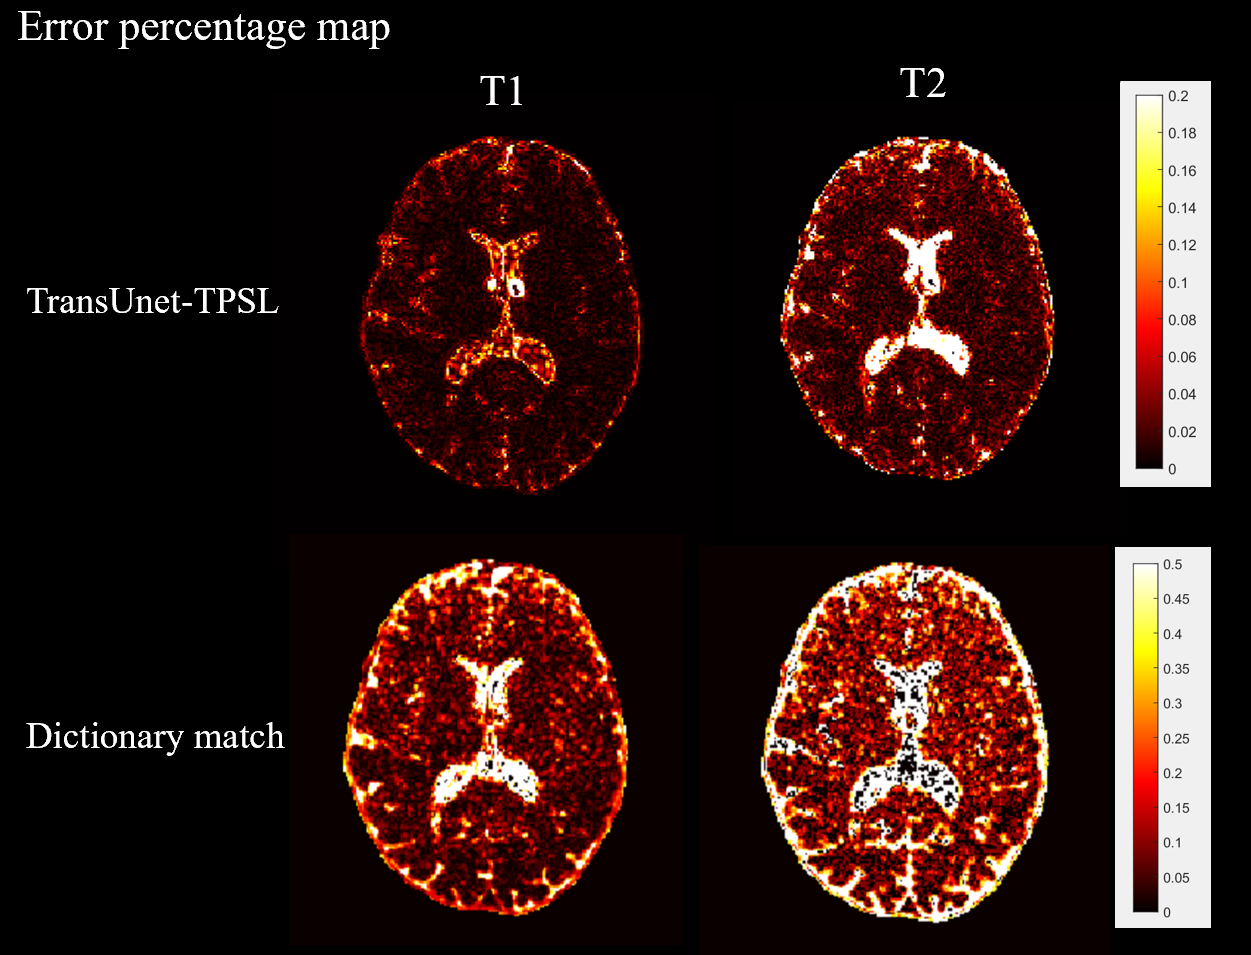
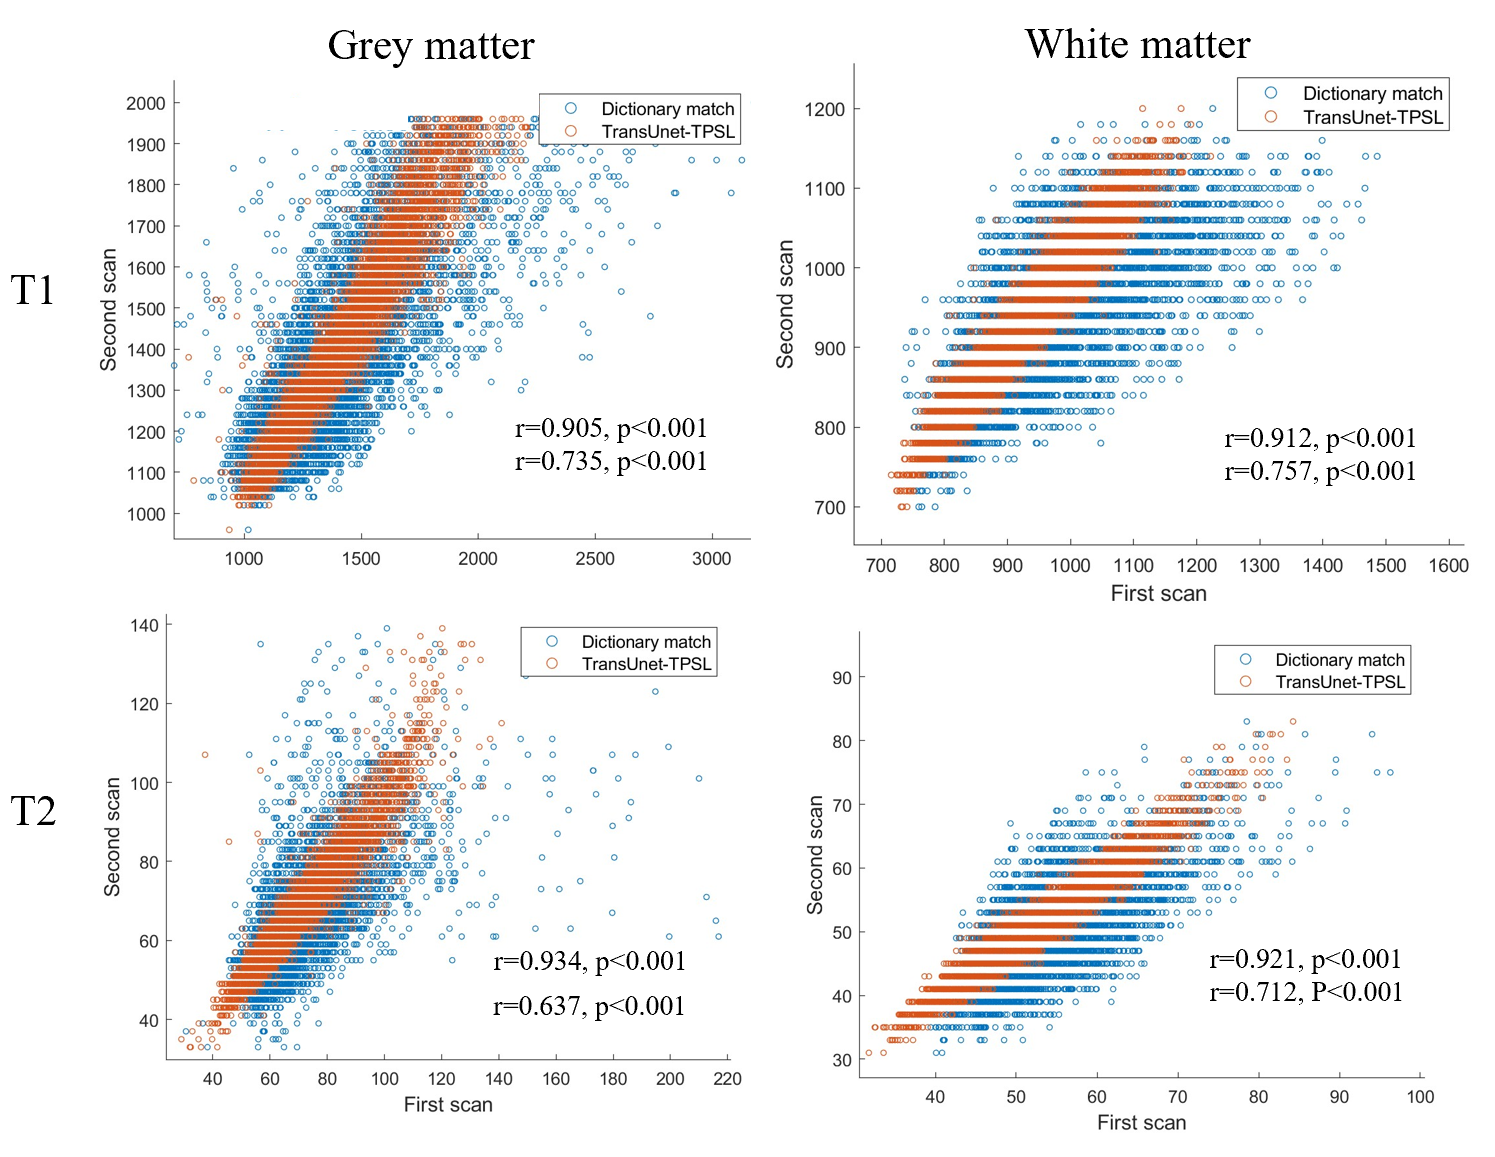
The first 100, 200, 300, and 400 frames of the original data(564 frames) are used as model inputs, train the model with different frame data until convergence. A representative slice were selected to compare the quantitative results is shown in Figure 2. The proposed method has less quantitative error with shorter frame data when compared to dictionary matching. This is more effective for the gray matter tissue and for scan times shorter than 200 frames. A visual comparison is shown in Figure3.Furthermore, scan-to-scan reproducibility was also assessed using the first 200 time frames for quantification (Fig. 4) . Compared to the Dictionary-matching approach, which has between-scan correlations below 0.76, our suggested TransUnet-TPSL method has between-scan correlations above 0.90. This indicated a notable enhancement in reproducibility achieved by our method.
Conclusion
We proposed a deep learning technique using a transformer module and a tissue-weighted loss function that can produce superior quantitative results over shorter time frames as an alternative to the conventional dictionary matching method for MRF reconstruction. In addition the proposed method has good consistency between the quantitative results of two scans of the same subject at 200 time frames, which provides a powerful reconstruction algorithm for MRF sequence acceleration.Acknowledgements
This work was supported by the National Key R&D Program of China (2020AAA0109502), the Fundamental Research Funds for the Central Universities (226-2023-00095),Open Research Fund of the State Key Laboratory of Cognitive Neuroscience and Learning (CNLZD2001)References
1Fang Z, Chen Y, Liu M, et al. Deep learning for fast and spatially constrained tissue quantification from highly accelerated data in magnetic resonance fingerprinting[J]. IEEE transactions on medical imaging, 2019, 38(10): 2364-2374.
2Song P , Eldar Y C , Mazor G ,et al.HYDRA: Hybrid Deep Magnetic Resonance Fingerprinting[J].Medical Physics, 2019, 46(11).DOI:10.1002/mp.13727.
3Cohen O, Zhu B, Rosen M S. MR fingerprinting deep reconstruction network (DRONE)[J]. Magnetic resonance in medicine, 2018, 80(3): 885-894.
4Chen J , Lu Y , Yu Q ,et al.TransUNet: Transformers Make Strong Encoders for Medical Image Segmentation[J]. 2021.DOI:10.48550/arXiv.2102.04306.
5Dai M , Li F Z .Dynamic Fuzzy Semisupervised Multitask Learning[C]//Seventh International Conference on Computational Intelligence and Security, CIS 2011, Sanya,Hainan,China, December 3-4, 2011.IEEE, 2012.DOI:10.1109/CIS.2011.106.
6Zhou Z, Li Q, Liao C, et al. Optimized three‐dimensional ultrashort echo time: Magnetic resonance fingerprinting for myelin tissue fraction map[J]. Human Brain Map, 2023, 44(6): 2209-2223.
Figures