3558
Influence of Medical Implants in the Subcranial and Facial Area on the Accuracy of Quantitative Magnetic Resonance Relaxometry at 3T1Department of MRI, The First Affiliated Hospital of Zhengzhou University, Zhengzhou, China, 2Department of Neurosurgery, The First Affiliated Hospital of Zhengzhou University, Zhengzhou, China, 3MR Research Collaboration, Siemens Healthineers, Beijing, China, 4Department of Radiology, Hainan General Hospital, Haikou, China
Synopsis
Keywords: MR Fingerprinting, Precision & Accuracy, Medical Implants in MRI
Motivation: The emergence of MR fingerprinting (MRF) technology enables accurate T1 and T2 relaxation time quantification. However, the impact of metal implants on quantitative imaging remains unclear, hindering postoperative and clinical MRI scans.
Goal(s): To assess how craniofacial metal implants affect T1 and T2 relaxation time quantification using MRF at 3T.
Approach: We conducted experiments on standardized MRI phantoms (ISMRM/NIST) with cranial implants using MRF and traditional T1/T2 mapping sequences.
Results: Aneurysm clips had no significant impact on MRF, while cranial plates/screws exhibited mild abnormalities. Galvanized steel strips caused substantial signal anomalies.
Impact: Highlighting the importance of considering the influence of metal implants on quantitative MRI results, impacting the accuracy of diagnoses. This research opens the door to further investigations into the development of metal-insensitive MRI sequences.
INTRODUCTION
The emergence of MR fingerprinting (MRF) technology has made it possible to reliably and accurately quantify T1 and T2 relaxation times. This advancement has paved the way for numerous studies aiming to utilize changes in relaxation times as potential indicators of diseases, equipping clinicians with non-invasive tools to gain insights into tissue pathophysiology1-3. However, patients undergoing medical interventions, such as surgeries resulting in the implantation of metal devices like aneurysm clips, plates, screws, and dental orthodontic appliances, are common in various medical conditions. While these individuals can safely undergo 3T MRI examinations, and conventional morphological imaging diagnosis may not be significantly affected4, 5, their influence on quantitative imaging remains unclear.Consequently, we conducted a series of experiments using a standardized quantitative MRI phantom (ISMRM/NIST)6. Our study aimed to investigate how cranial bone plates, cranial screws, aneurysm clips, and metal molding strips of medical mask (representing outdated dental orthodontic metal braces and dentures) affect the quantification of T1 and T2 relaxation times using MRF at 3T. To provide a comprehensive analysis, we also collected data from conventional T1 and T2 mapping sequences.
METHODS
Cranial bone plates, cranial screws, aneurysm clips, and metal molding strips of the mask were each secured to the exterior of the phantom using medical elastic bandages. Subsequently, the phantoms underwent two rounds of scanning, which included MRF and traditional T1 and T2 mapping imaging (Mapit), across three 3T MRI scanners (all of which were MAGNETOM Vida, Siemens Healthineers, Erlangen, Germany). To maintain consistency, we had the phantoms situated in the scanning room beforehand, minimizing any temperature fluctuations during the six experiments.The results from the two quantitative measurements were averaged, and we assessed whether the presence of medical implants significantly influenced the quantitative T1 and T2 values as well as the size of the affected area when compared to a control groups without any metal implants.
RESULTS
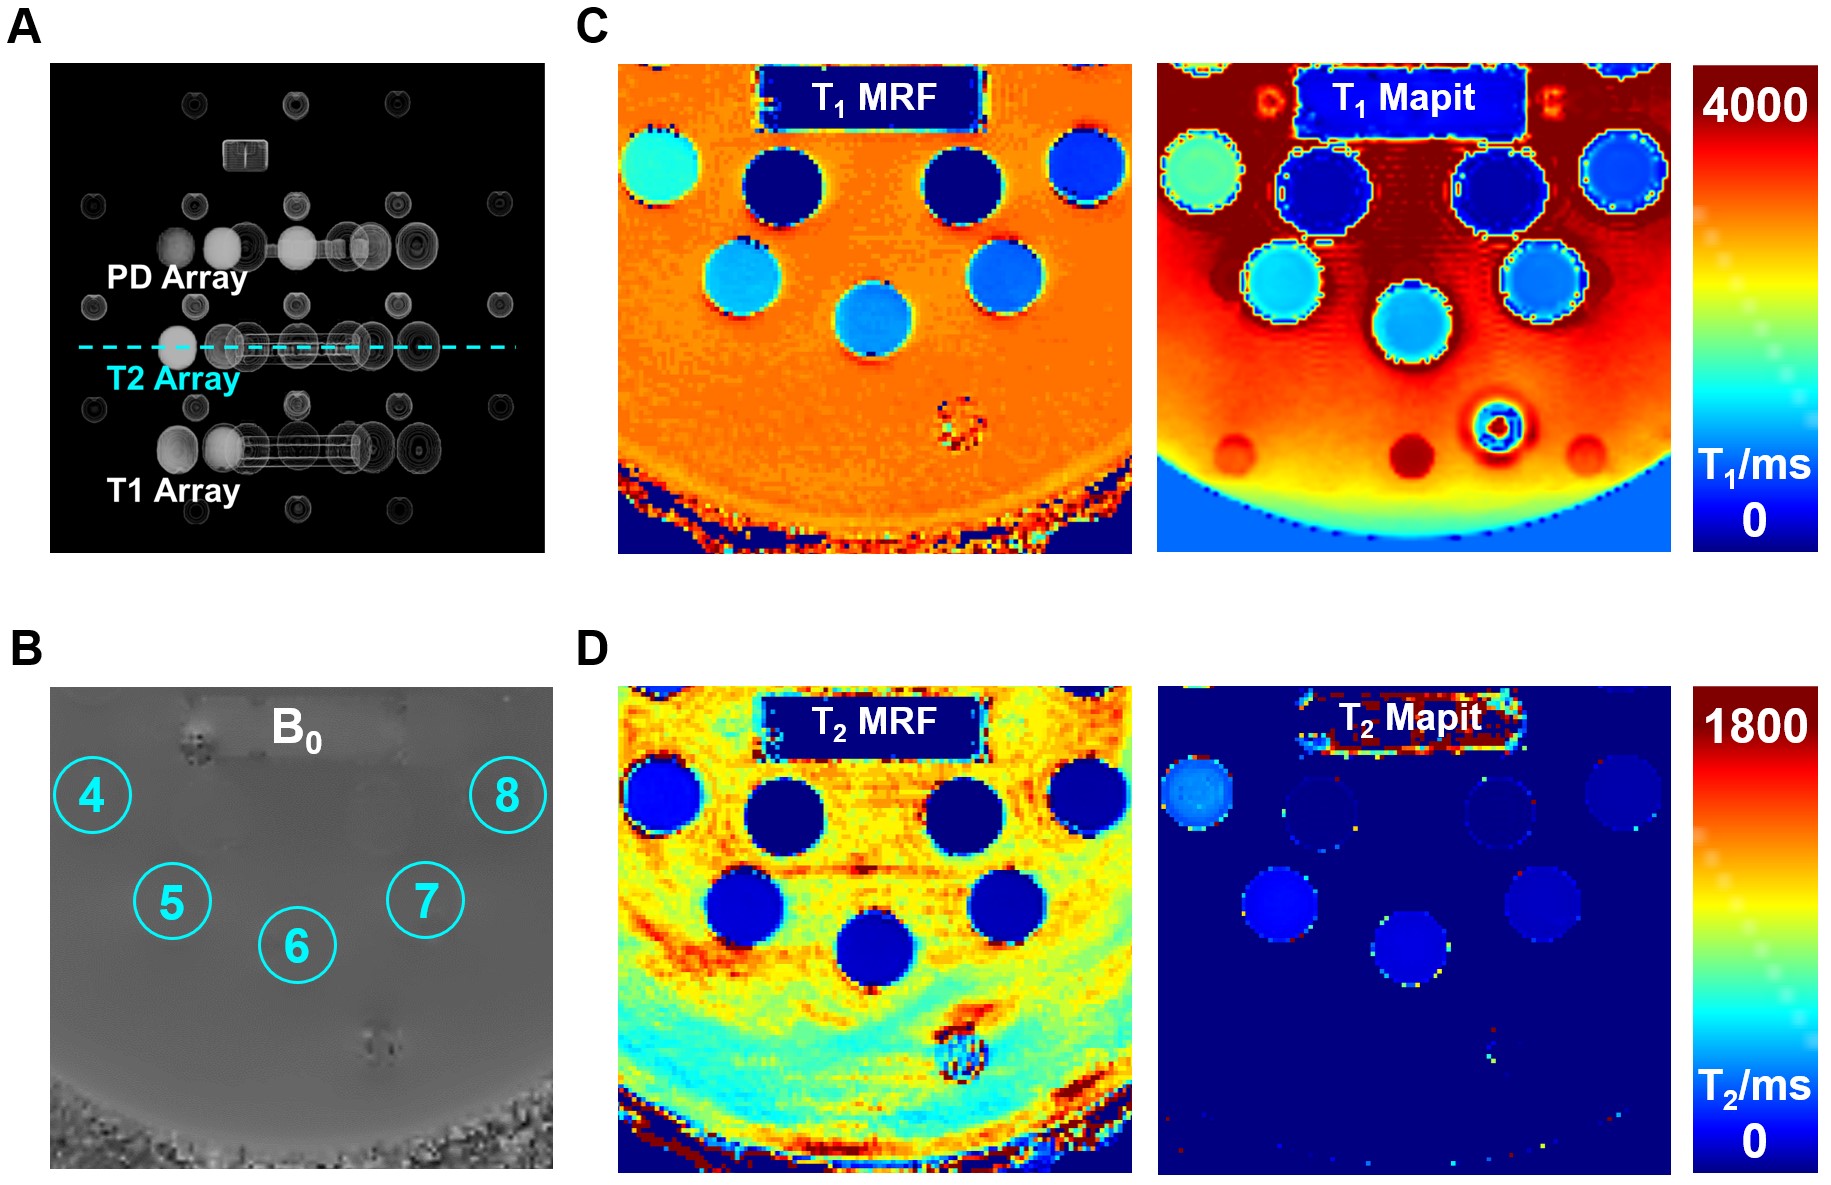
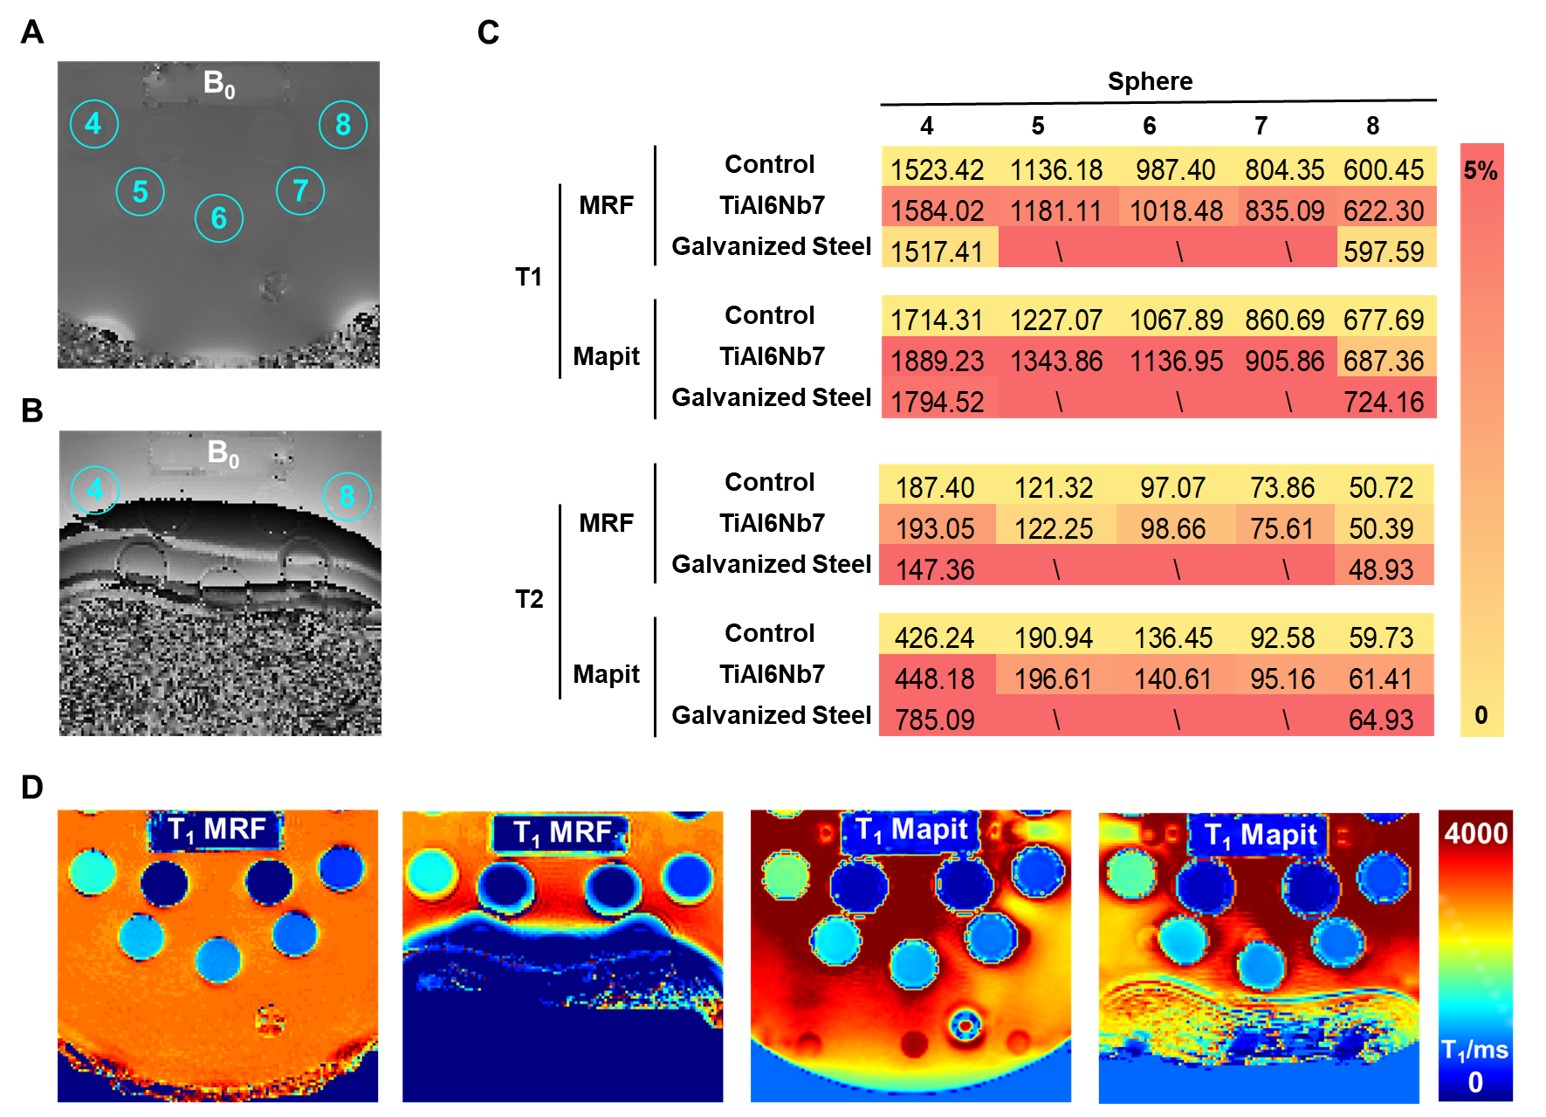
Our study revealed that aneurysm clips made from TiAl6V4 did not introduce artifacts or numerical anomalies in MRF images. However, compared to the control group without any metal implant placed (Figure 1), cranial bone plates and screws made from TiAl6Nb7 produced artifacts within a 5~7 mm range and numerical anomalies within 3~5 mm range (Figure 2 A, D). Furthermore, the Galvanized steel material used for nose clipping of the medical mask generated conspicuous artifacts within a 57~70 mm range and completely abnormal values within an 87~99 cm range (Figure 2 B, D). While in terms of accuracy/robustness, with the metal implant were existed, MRF provides more accurate quantitative results of T1 and T2 than Mapit technology (Figure 2 C).Practical application has demonstrated that metal implants located within the maxillofacial region could potentially influence quantitative imaging of brain tissues. For patients who have undergone cranial surgeries, local brain tissues may experience alterations within the affected area of the metal implant.
DISCUSSION
The assessment of the impact of metal implants on imaging is crucial for postoperative follow-ups or MRI scans involving patients with metal implants, especially in the context of quantitative imaging. Our systematic investigation focused on the influence of common craniofacial metallic implants on relaxation time quantification. Based on our phantom study, we concluded that aneurysm clips made from TiAl6V4 had no significant impact on relaxation time quantification in MRF. In contrast, cranial bone plates and screws composed of TiAl6Nb7 exhibited mild signal abnormalities within a 3~5 mm range, while metal molding strips of the mask made from Galvanized steel led to obvious signal abnormalities within an 87~99 mm range. Traditional mapping techniques appear to be more sensitive to metal implants, resulting in more significant signal abnormalities in terms of both extent and severity.Consequently, during clinical examinations or scientific research, it is essential to exercise caution when process the data from patient involving metal implants. Regions affected by the implant should be excluded from the region of interest to ensure the accuracy of results. Furthermore, ongoing research is investigating the development of quantitative MRI sequences that are less susceptible to the interference of metal implants and even multi-parameter quantitative imaging techniques7. These advancements are expected to enhanced the accuracy of quantitative MRI examination.
CONCLUSION
Our study offers empirical data on the influence of metal implants on 3T magnetic resonance relaxation time quantitative imaging. We need to carefully assess the presence of metal implants to ensure the accuracy of quantitative MRI results.Acknowledgements
No acknowledgement found.References
1. Chen Y, Chen MH, Baluyot KR, et al. MR fingerprinting enables quantitative measures of brain tissue relaxation times and myelin water fraction in the first five years of life. Neuroimage. 2019 ;186:782-793.2. Haubold J, Demircioglu A, Gratz M, et al. Non-invasive tumor decoding and phenotyping of cerebral gliomas utilizing multiparametric 18F-FET PET-MRI and MR Fingerprinting. Eur J Nucl Med Mol Imaging. 2020;47(6):1435-1445.
3. Konar AS, Shah AD, Paudyal R, et al. Quantitative relaxometry metrics for brain metastases compared to normal tissues: a pilot MR Fingerprinting study. Cancers (Basel). 2022;14(22):5606.
4. Jungmann PM, Agten CA, Pfirrmann CW, Sutter R. Advances in MRI around metal. J Magn Reson Imaging. 2017;46(4):972-991.
5. Juerchott A, Roser CJ, Saleem MA, et al. Diagnostic compatibility of various fixed orthodontic retainers for head/neck MRI and dental MRI. Clin Oral Investig. 2023;27(5):2375-2384.
6. https://archive.ismrm.org/2012/2456.html Characterization of NIST/ISMRM MRI System Phantom
7. Cloos MA, Knoll F, Zhao T, et al. Multiparametric imaging with heterogeneous radiofrequency fields. Nat Commun. 2016;7:12445.
Figures