3555
Tailored Synthetic and Non-Synthetic (SNS) Optimization for pediatric neuroimaging1Institute for Systems and Robotics - Lisboa and Department of Bioengineering, Instituto Superior Técnico – Universidade de Lisboa, Lisboa, Portugal, 2Columbia Magnetic Resonance Research Center, Columbia University, New York, NY, United States, 3Accessible Magnetic Resonance Laboratory, Biomedical Imaging and Engineering Institute, Department of Diagnostic, Molecular and Interventional Radiology, Icahn School of Medicine at Mount Sinai, New York, NY, United States
Synopsis
Keywords: MR Fingerprinting, MR Fingerprinting, Synthetic Imaging; Non-synthetic Imaging;
Motivation: Quantitative MR (qMR) relaxometry allows monitoring of pediatric neuropathology. However, acquiring qualitative and qMR imaging is time-consuming and challenging, especially in pediatric patients.
Goal(s): To design a pulse sequence allowing both quantitative and non-synthetic weighted imaging, addressing the need for acceleration.
Approach: MR Fingerprinting (MRF) is the gold standard for simultaneous qMR mapping but does not provide non-synthetic images. We compare MRF versions to sequences designed using the 1-Look-Ahead approach to optimize gray (GM) to white matter (WM) contrast, including periods of stable signal for non-synthetic imaging.
Results: A promising signal control enabling quantitative mapping and good-quality weighted in vivo images.
Impact: Demonstration of the feasibility of controlled contrast and signal stability for quantitative and qualitative Magnetic Resonance Fingerprinting using one-look ahead (1LA) flip angle design for accelerated scanning in the pediatric brain, increasing quality in T2-weighted images.
INTRODUCTION
Pediatric MRI imaging is a requirement, especially for localization and follow-up of brain and spinal cord tumors. However, it requires long acquisition times and can be challenging as children often need to be sedated to avoid motion artifacts [1]. MR Fingerprinting (MRF) provides high-speed acquisitions delivering multiple qMR parameters. Advances in MRF such as Quantitative Transient Imaging (QTI) and Tailored MRF (TMRF) have been suggested [2-4] to further MRF’s capabilities. TMRF provides multi-contrast, non-synthetic, qualitative, and quantitative images simultaneously. TMRF provides non-synthetic fluid-attenuated inversion recovery (FLAIR) contrast but suffers from a very low SNR. In this work, we aim to produce synthetic and non-synthetic (SNS) images, while controlling for signal evolutions guaranteeing periods of stability and contrast heuristics - enhancing SNR - for better non-synthetic T2 weighted (T2w) images.METHODS
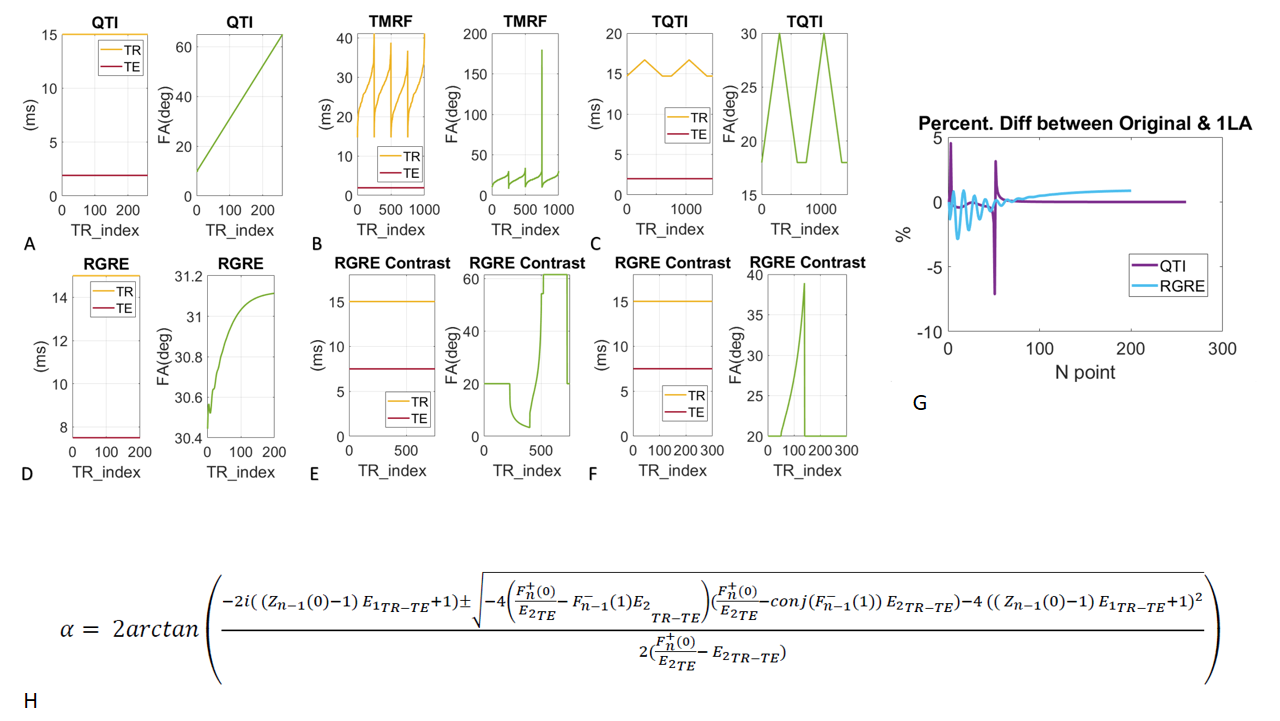
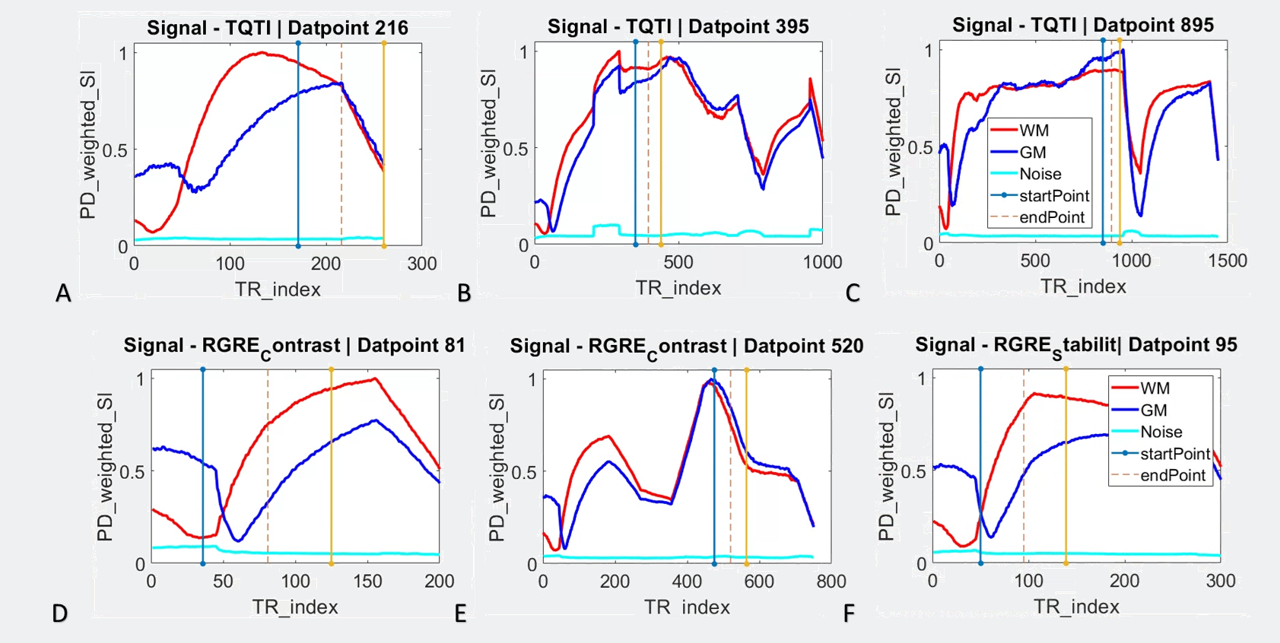
To optimize T2w imaging, we employed the Extended Phase Graph (EPG) theory to modulate signal evolution. In particular, we used the “1 look-ahead algorithm (1LA)” [5]. Each system perturbation was used to calculate signal intensity at point ‘n’ and analytically invert the expression for flip angle (FA). To generate the expected new signal, we used the forward model shown in Fig1 H).Sequences were designed to compare the simple to the more involved signal modulation approaches. We evaluated sequence performance by calculating the contrast between WM|GM and signal stability during a range of TRs for each of them. The tissue contrast was defined as the difference in mean value within each fully-sampled readout window and stability was calculated as the variation of standard deviation in the same window. Six sequences (2D) were studied with the EPG framework: A) QTI generated with 1LA with an inversion recovery (serving as proof of concept of 1LA); B) A literature-published TMRF without 1LA as golden standard [3]; C) Tailored QTI (TQTI), a merge of TMRF with transient states; D) Rapid Gradient Echo (RGRE) – a 1LA steady state Free Processing (SSFP) sequence that uses gradient spoiling instead of RF spoiling for fast acquisition and stronger MR signal in short TR; Sequences E) and F) are both RGRE sequences, optimized with 1LA, one aiming to maximize GM-WM contrast and the other to maximize the signal evolution stability, respectively. Sequence E. Sequence F was defined with 1LA slowly increasing its FA for signal stability. The different sequence variations of TR, TE, and FA are depicted in Fig1 A-F. 1LA showed a fluctuation under 5% compared to a regular EPG-driven QTI signal and RGRE (Fig1 G). The analyzed time intervals were manually selected after visually inspecting the signal evolution contrasts for each sequence and using simulation expertise. This was done with simulated and real data from a healthy volunteer. using a GE 3T Discovery 750w scanner equipped with an 8-channel head coil. Acquisition parameters: FOV = 25 cm, matrix size = 225 × 225. We acquired one 5mm-thick slice in a superior part of the brain. Full k-space coverage was achieved with an 89-shot spiral trajectory and built-in deep learning denoising. Simulations and analyses of qualitative and quantitative data were done in MATLAB.RESULTS & DISCUSSION
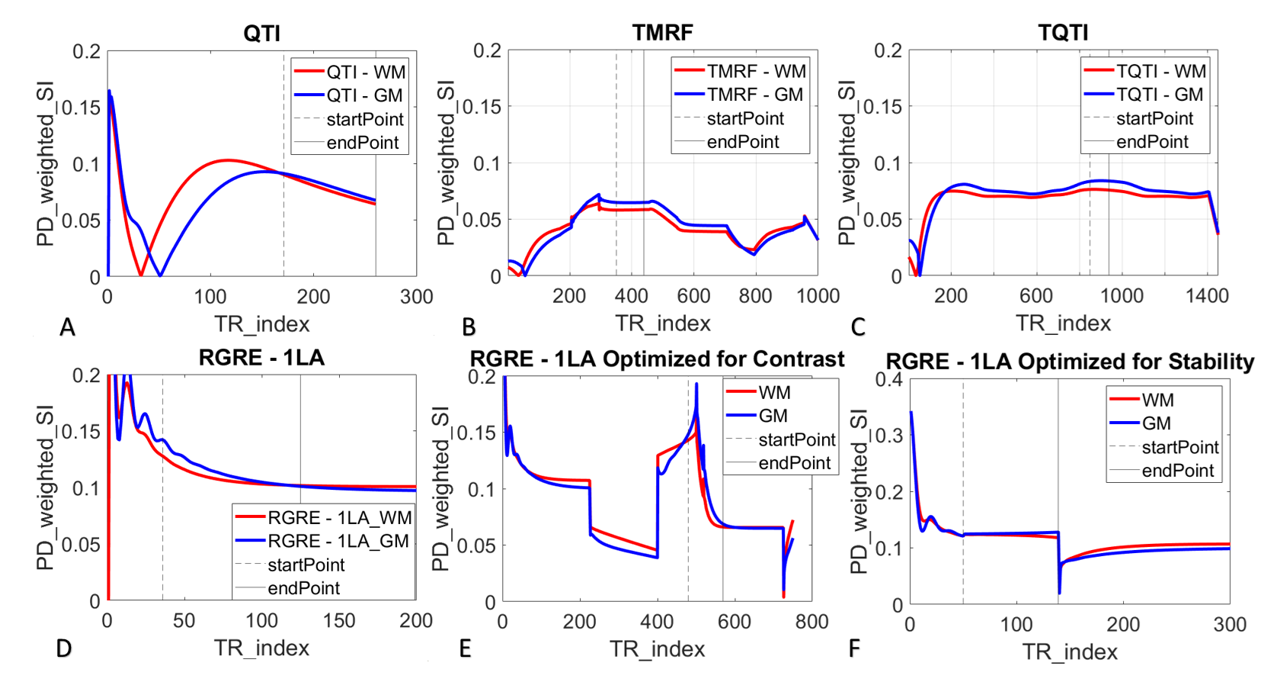
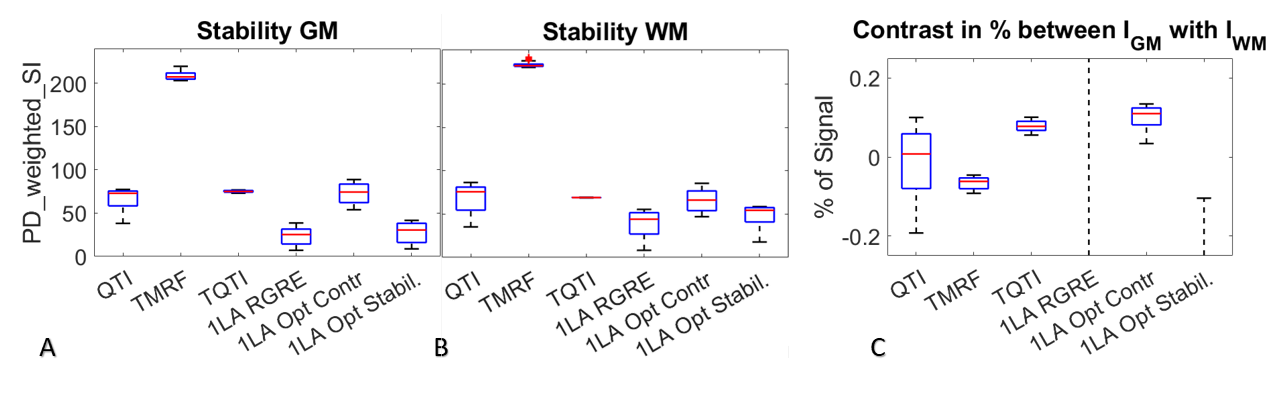
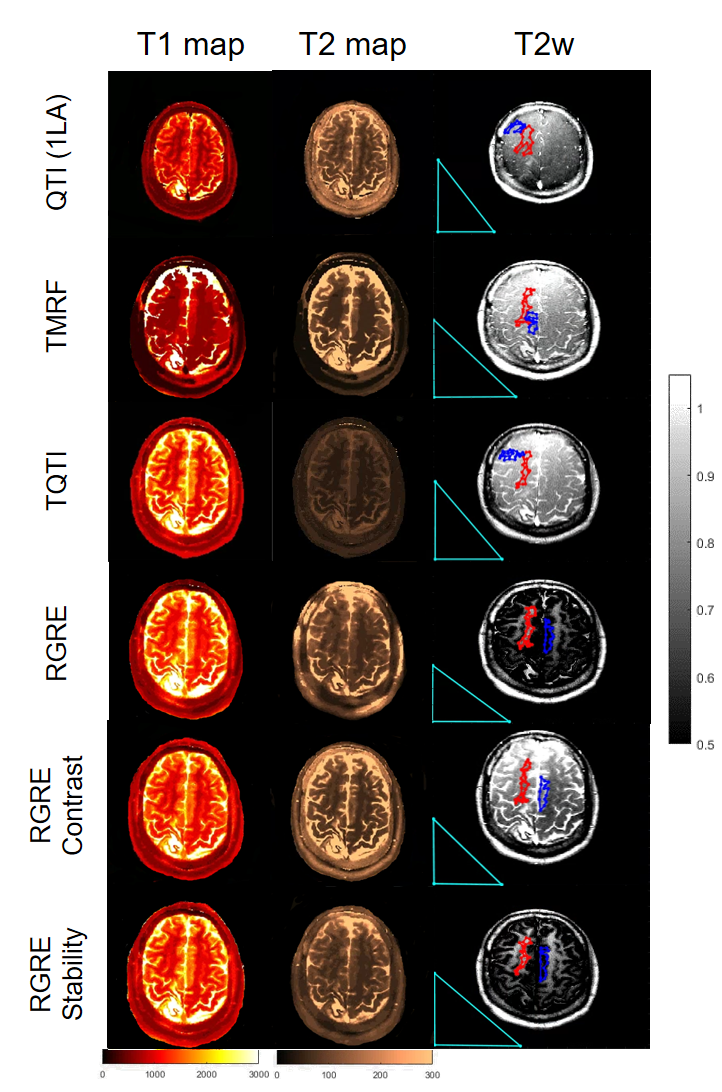
The simulation outcomes for all tested sequences are shown in Fig2. Boxplot of in vivo analysis of Contrast and Stability were utilized to compare their T2w quality (Fig3) using the masks drawn in the T2w images depicted in Fig.4. Fig.5 shows the obtained contrast and stability metrics. Using 1LA-E-F control, by using the 1LA signal, a higher signal intensity was found which could be used to contrast GM with WM. Optimizing for stability F) using the 1LA framework, one can still obtain a high stability measurement (𝜎𝑠𝑖𝑔𝑛𝑎𝑙=0.012) with a higher SNR, Fig3. For higher intensity signals, the stability factor decreases but the SNR increases. Fig. 5 shows that RGRE tuned for contrast works best for T2w images, presenting a bigger mean percentage difference between GM and WM, as confirmed in Fig 4. The quantitative maps in Fig. 4 indicate robustness across all dictionary matches for different sequences.Controlling signal intensity [6] improves T2w image quality. This study did not evaluate repeatability; in the future Gradient moment nulling should be considered to assess motion sensitivity. Implementation of a systematic sequence optimization using genetic algorithms [8] and testing in clinical pediatric patients are the next steps.CONCLUSION
This work optimized the sequence design of simultaneous non-synthetic and qMR imaging, aiming to deliver faster and more accurate clinical diagnosis in pediatric brain tumors. Future work will automate optimization processes for sequence design, compare with gold standard acquisitions, and test in the target population.Acknowledgements
This work was supported, in part, by GE-Columbia research partnership grant and also performed at Zuckerman Mind Brain Behavior Institute MRI Platform, a shared resource, and Columbia MR Research Center site. This work was supported by Fundação para a Ciência e a Tecnologia (FCT) - (grants 2020.05080.BD and UIDB/50009/2020), by FLAD CON2/CAN8 & Fulbright Program.References
1. Dong S, Zhu M, Bulas D, Techniques for minimizing sedation in pediatric MRI, Journal of Magnetic Resonance Imaging, 50 - 4, 2019, pages 1047-1054
2. Gómez, P. A., Molina-Romero, M., Buonincontri, G., Menzel, M. I. & Menze, B. H. Designing contrasts for rapid, simultaneous parameter quantification and flow visualization with quantitative transient-state imaging. Sci. Rep. 9, 1–12 (2019).
3. Poojar, Pavan, et al.. "A faster and improved tailored Magnetic Resonance Fingerprinting." ISMRM 2021
4. Enlin Qian et a. Two-site repeatability study of Tailored Magnetic Resonance Fingerprinting (TMRF), ISMRM 2020
5. Weigel, M. Extended phase graphs: Dephasing, RF pulses, and echoes - Pure and simple. J. Magn. Reson. Imaging 41, 266–295 (2015).
6. Keerthivasan, M. B. et al. An efficient 3D stack ‐ of ‐ stars turbo spin echo pulse sequence for simultaneous T2 ‐ weighted imaging and T2 mapping. 1–16 (2019) doi:10.1002/mrm.27737.
7. Chen, Y. et al. High-resolution 3D MR Fingerprinting using parallel imaging and deep learning. Neuroimage 206, 116329 (2020).
8. Somai, V. et al. Genetic algorithm‐based optimization of pulse sequences. Magn. Reson. Med (2021).
Figures