3554
Evaluating 0.55T FISP MRF using EPG-X Formalism1Ming Hsieh Department of Electrical and Computer Engineering, University of Southern California, Los Angeles, CA, United States
Synopsis
Keywords: MR Fingerprinting, MR Fingerprinting, Magnetization transfer effect
Motivation: MT effects influence MRF T1 and T2 quantifications and are stronger at lower field strength.
Goal(s): To evaluate the impact of EPGx dictionary generation on relaxometry performance for 0.55T FISP MRF.
Approach: We applied the EPG-X formalism with a two-pool model which incorporates MT parameters for dictionary simulation for 0.55T FISP MRF and covered a range of realistic MT parameters values. We applied the approach on 4 healthy subjects.
Results: Use of EPGx reduced T2 bias (compared to single-echo spin echo) by 25% at a cost of 80% worse precision.
Impact: Simulating dictionary using the EPG-X formalism with a two-pool model can partially mitigate MT effects and may reduce T2 bias.
Introduction
Brain Magnetic Resonance Fingerprinting (MRF)1–3 is a time efficient whole-brain relaxation time quantification method and has gained research and clinical tractions. However, it is known to suffer from T1 and T2 quantification biases due to Magnetization Transfer (MT) effects2,4,5, like other approaches using varying RF energy, e.g., Variable Flip Angle (VFA) T1 mapping6. Previous work7 showed that in-vivo white matter (WM) T2 was underestimated by >40ms in 0.55T FISP-MRF, compared to reference values. Fortunately, such biases were shown to be reduced at 3T by dictionary simulation with extra MT parameters using the Extended Phase Graph formalism (EPG-X)8 with a two-pool model and by improving MRF sequences with additional MT pulses4, however, only a limited choice of transfer rate values were covered to make computation practical. In this work, we applied the EPG-X formalism and covered a broader range of realistic transfer rate values in dictionary simulation. WM T2 bias was reduced to -30ms with EPG-X formalism, however, at a cost of increased standard deviation.Methods
Experiments were performed using a whole body 0.55T system (prototype MAGNETOM Aera,Siemens Healthineers, Erlangen, Germany) equipped with high-performance shielded gradients(45mT amplitude, 200T/m/s slew rate). The 3D FISP-MRF sequence was provided by Case Western Reserve University under a C2P agreement.3D brain MRF data were acquired from 4 healthy volunteers (1F/3M, age 25-33). One volunteer (M, 28) was also imaged with Inversion Recovery Spin Echo (IRSE) sequences with 8 inversion times and Single Echo Spin Echo (SESE) sequences with 7 echo times for reference T1 and T2 mapping, respectively. MRF data were reconstructed as described by McGivney et al.9 and Ma et al.3. Two FISP MRF dictionaries with one pre-inversion pulse (1500 time points, 8.88ms TR, 1.96ms TR, 20.64ms TI, 5-75° FA) were simulated using EPG and EPG-X and were used to achieve MRF T1 and T2 results without and with the MT mitigation, respectively. 225 T1 values from 10 to 3500ms and 128 T2 Values from 2 to 2000ms with variable increments were used in both dictionaries (24878 entries). 10 fractional pool size value equally spaced from 2.5% to 25% and 6 transfer rate (from free pool to macromolecule pool) values equally spaced from 0.55 to 6.8s-1 were used4,10,11 in the EPG-X formalism. B1+ correction was performed using a global constant B1+=0.92, which was estimated from a separate phantom experiment using the ISMRM/NIST system phantom7. This resulted in additional 411300 entries. Dictionary simulation cost ~5 days on a high-performance server with 2TB RAM and 12 cores.
A WM Region-of-Interest (ROI) based analysis was performed on each MRF results. Specifically, the analysis focused on MRF T2 values from WM ROI and compared their means and standard deviations against the reference T2 values measured.
Results
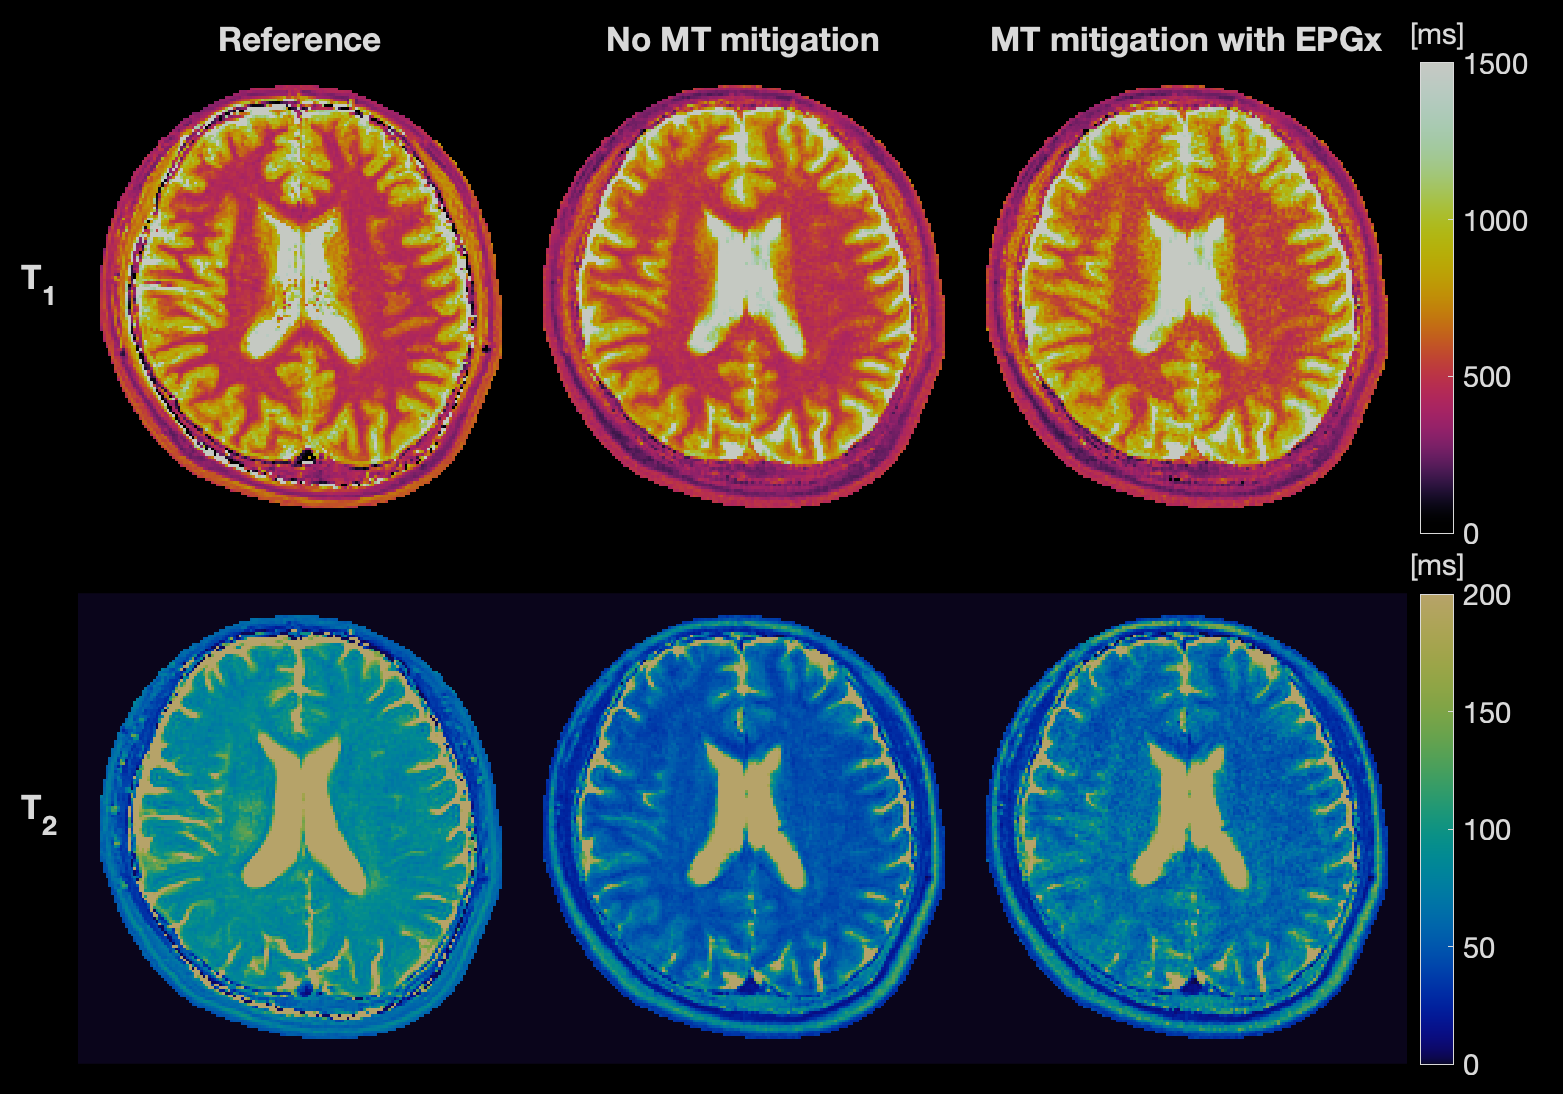
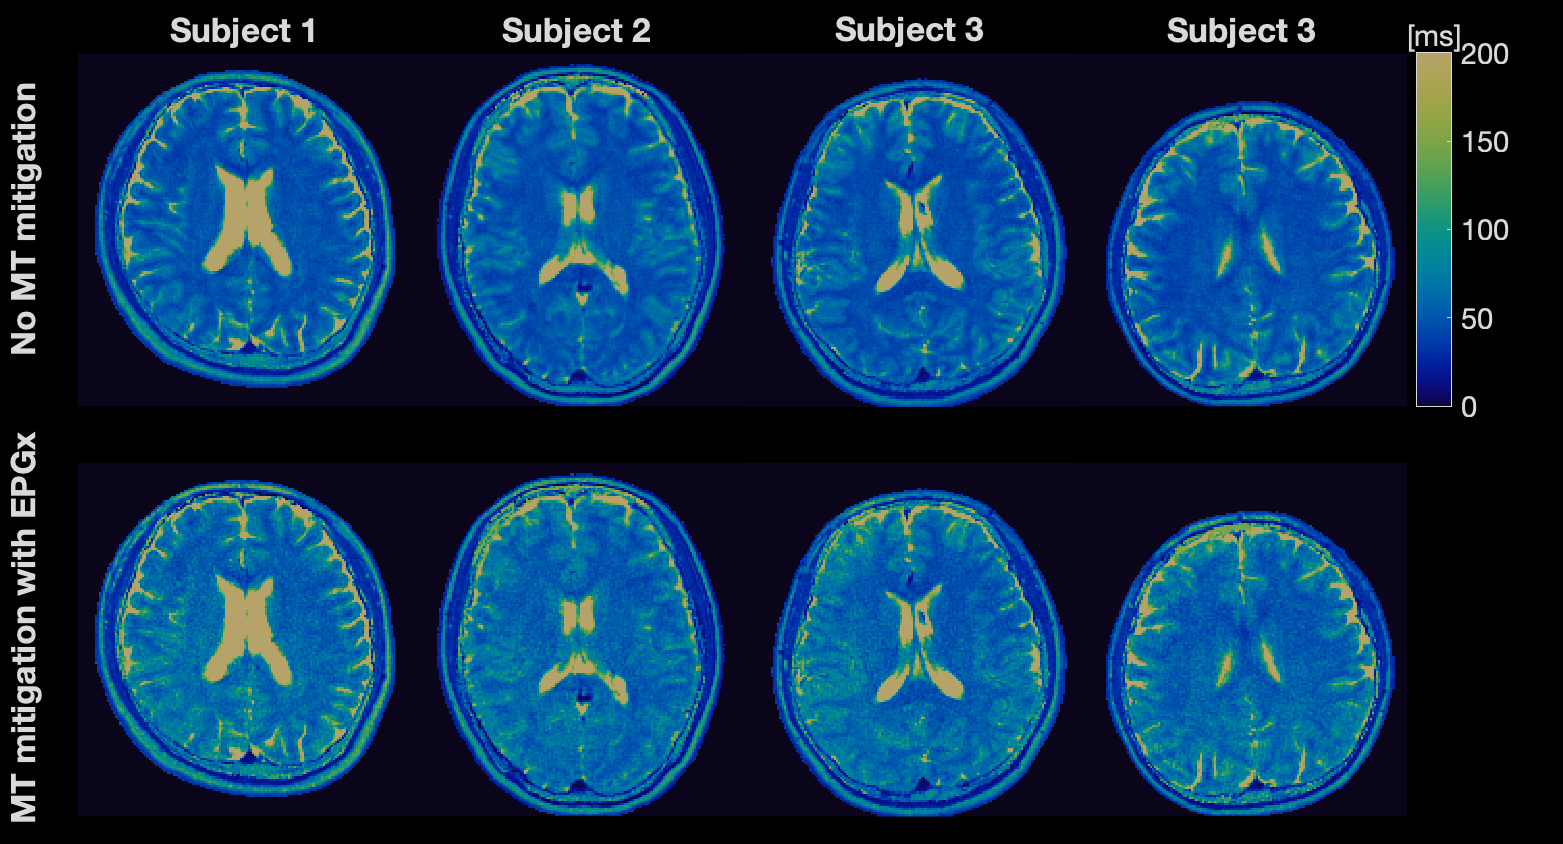
Figure 1 shows T1 and T2 maps from the subject with reference measurements. Reference maps, MRF without MT mitigation and with MT mitigation are shown from left to right. Both T1 and T2 values elevated after MT mitigation, which matches other researchers’ observation4.Figure 2 shows MRF T2 maps from all 4 subjects. MRF results without MT mitigation and with MT mitigation are shown in the 1st and 2nd row, respectively.
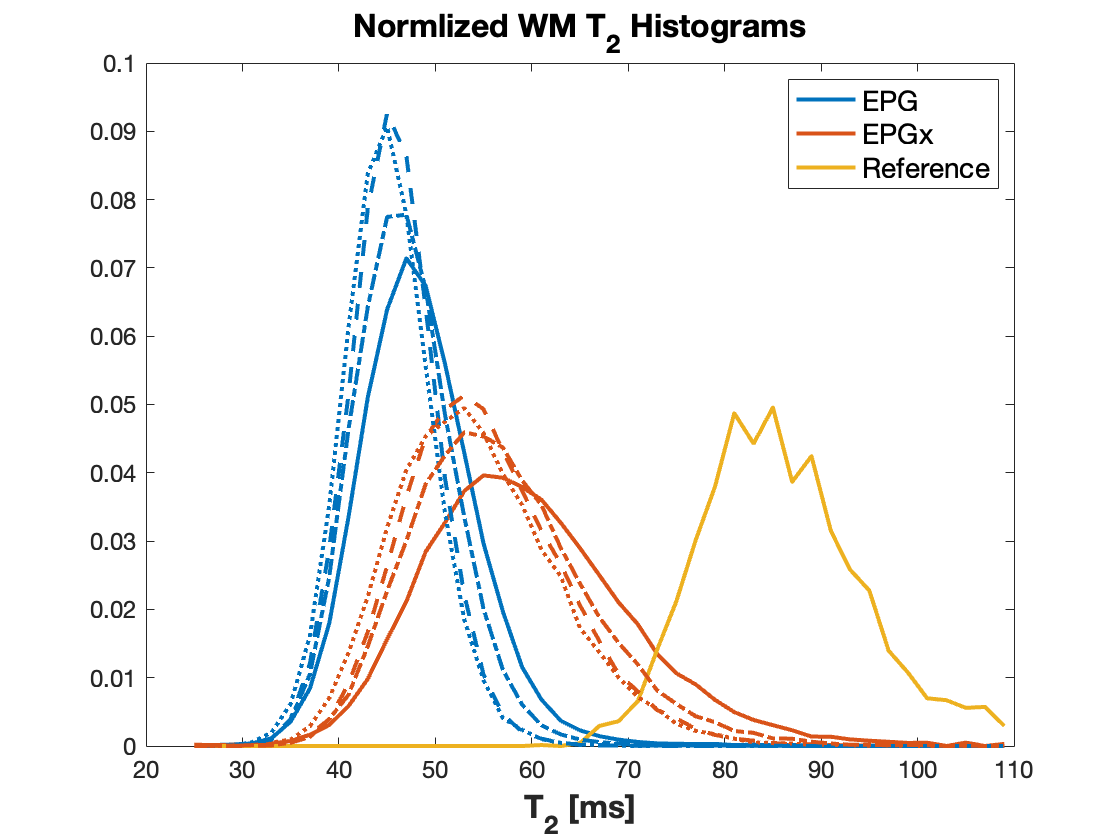
Figure 3 shows T2 histograms from WM ROIs. The reference T2 histogram is yellow. Biases in MRF T2 histograms with MIT mitigation (red) were reduced compared to histograms without MT mitigation (blue). However, T2 standard deviations were ~80% higher. Detailed changes were: 47.54±8.20ms to 58.86±12.18ms (Subj1), 44.75±4.51ms to 54.21±8.42ms (Subj2), 44.20±4.67ms to 53.34±8.50ms (Subj3), 45.87±5.35ms to 55.82ms±9.22ms (Subj4).
Discussion
In this work, we applied the EPG-X formalism with a two-pool model in dictionary simulation for 0.55T FISP-MRF accounting for MT effects. T2 bias was slightly reduced from more than -40ms to around -30ms, however, it was still away from the reference value and T2 standard deviation became ~80% higher. Increased standard deviation was expected since more parameters introduced more uncertainty in the dictionary.The FISP-MRF sequence studied was not designed to encode MT effect, e.g., not extra MT pulses, which limited the method’s sensitivity to MT effects. This might have largely caused the high variance in the final estimation.
Another limitation is the selection of transfer rate values was not guided by any in-vivo quantitative MT imaging at 0.55T. It limited the signal model accuracy and might also have caused the incomplete T2 bias reduction. This is of interest for future improvement.
Conclusion
Applying the EPG-X formalism with a two-pool model partially reduces MRF T2 bias for 0.55T FISP-MRF (compared to SESE) at a cost of increased standard deviation.Acknowledgements
We acknowledge grant support from the National Science Foundation (Award #1828736), and research support from Siemens Healthineers. We thank Mark Griswold for helpful discussion.References
1. Ma D, Gulani V, Seiberlich N, et al. Magnetic resonance fingerprinting. Nature. 2013;495(7440):187-192. doi:10.1038/nature119712.
2. Jiang Y, Ma D, Seiberlich N, Gulani V, Griswold MA. MR fingerprinting using fast imaging with steady state precession (FISP) with spiral readout. Magn Reson Med. 2015;74(6):1621-1631. doi:10.1002/mrm.255593.
3. Ma D, Jiang Y, Chen Y, et al. Fast 3D Magnetic Resonance Fingerprinting for a Whole-Brain Coverage. Magn Reson Med. 2018;79:2190-2197. doi:10.1002/mrm.268864.
4. Hilbert T, Xia D, Block KT, et al. Magnetization transfer in magnetic resonance fingerprinting. Magn Reson Med. 2020;84(1):128-141. doi:10.1002/MRM.280965.
5. Campbell-Washburn AE, Jiang Y, Körzdörfer G, Nittka M, Griswold MA. Feasibility of MR fingerprinting using a high-performance 0.55T MRI system. ISMRM 28th Scientific Session. Published 2020. Accessed December 6, 2020. https://cds.ismrm.org/protected/20MPresentations/abstracts/0868.html6.
6. A.G. Teixeira RP, Malik SJ, Hajnal J V. Fast quantitative MRI using controlled saturation magnetization transfer. Magn Reson Med. 2019;81(2):907-920. doi:10.1002/mrm.274427.
7. Zhu Z, Lee NG, Tian Y, et al. Evaluation of MR Fingerprinting at 0.55T. In: ISMRM 31st Scientific Session. ; 2022:3492. Accessed November 6, 2022. https://cds.ismrm.org/protected/22MPresentations/abstracts/3492.html8.
8. Malik SJ, Teixeira RPAG, Hajnal J V. Extended phase graph formalism for systems with magnetization transfer and exchange. Magn Reson Med. 2018;80(2):767-779. doi:10.1002/mrm.270409.
9. McGivney DF, Pierre E, Ma D, et al. SVD Compression for Magnetic Resonance Fingerprinting in the Time Domain. IEEE Trans Med Imaging. 2014;33(12):2311-2322. doi:10.1109/TMI.2014.233732110.
10. Stanisz GJ, Odrobina EE, Pun J, et al. T1, T2 relaxation and magnetization transfer in tissue at 3T. Magn Reson Med. 2005;54(3):507-512. doi:10.1002/mrm.2060511.
11. Gloor M, Scheffler K, Bieri O. Quantitative magnetization transfer imaging using balanced SSFP. Magn Reson Med. 2008;60(3):691-700. doi:10.1002/MRM.21705
Figures