3553
MR Fingerprinting Enables Quantitative Measures of Basal Ganglia TissueRelaxation Times and Myelin Water Fraction in Parkinson's Disease1Department of Radiology, the first hospital of China medical University, ShenYang, China, 2MR Research Collaboration, Siemens Healthineers, Beijing China, Beijing, China
Synopsis
Keywords: MR Fingerprinting, MR Fingerprinting, Parkinson's Disease, basal ganglia, Relaxometry, Myelin water fraction imaging
Motivation: The diagnosis and monitoring of PD present formidable challenges due to the absence of objective and specific indicators.
Goal(s): Our objective is to demonstrate the potential of MRF in improving PD diagnosis and monitoring, offering a more precise and objective assessment for the benefit of patients.
Approach: MRF sequences were used to quantitative brain tissue properties. By employing partial least squares and Receiver Operating Characteristic analysis, we explored MRF's potential in distinguishing PD and assessing disease severity.
Results: MRF sequences yield objective and quantifiable metrics for differentiation and severity assessment in PD patients.
Impact: By providing reliable objective and quantifiable metrics, the use of MRF enhances the accuracy and reliability of PD assessment, leading to more precise interventions. This has the potential to improve patient outcomes and reduce the burden on healthcare systems.
Introduction
Parkinson's disease (PD) is a common neurodegenerative disorder characterized by both motor and non-motor symptoms, significantly affecting patients' quality of life. The basal ganglia(BG)plays a pivotal role in the development of PD, however there is currently no reliable quantitative measure to assess brain region alterations. Magnetic resonance fingerprinting (MRF) is an emerging quantitative technique that can provide relaxometric maps from a single sequence with high repeatability and reproducibility[1]. Our objective is to assess the potential of MRF in quantifying changes in BG tissue of PD patients, based on relaxometry properties and myelin water fraction (MWF). Additionally, we aim to explore how MRF can contribute to distinguishing PD in patients and assessing disease severity.Methods
A total of 26 PD patients and 10 age- and gender- matched healthy controls (HCs) were enrolled. All participants underwent a comprehensive assessment, including the Movement Disorder Society-Sponsored Revision of the Unified Parkinson's Disease Rating Scale (MDS-UPDRSIII)(Goetz et al., 2008) and the Hoehn and Yahr (H-Y) stage for measuring motor disability severity, and Montreal Cognitive Assessment(MoCA) for global cognitive function. All participants underwent 3 T MRI (MAGNETOM VIDA, Siemens Healthcare, Erlangen, Germany), including a 2D steady-state free precession (FISP) MR fingerprinting research sequence that generates T1 and T2 maps by matching measured signals to a dictionary as previously described[2]. The voxel size was 1*1*5mm. The dictionary-based analysis was used to quantify Myelin Water Fraction in StatisticToolkits software developed by Siemens, employing a three-compartment model including myelin water, intracellular/extracellular water and free water. A two sample t test was performed to evaluate significant abnormalities in patients comparing to HCs, with FDR correction. Receiver Operating Characteristic curve analysis(ROC) was employed to explore the diagnostic utility of BG tissue characteristics in distinguishing PD and HC groups. Additionally, we utilized partial least squares correlation (PLS-C) analysis to explore the patterns of association between BG region tissue properties and clinical properties in PD patients.Results
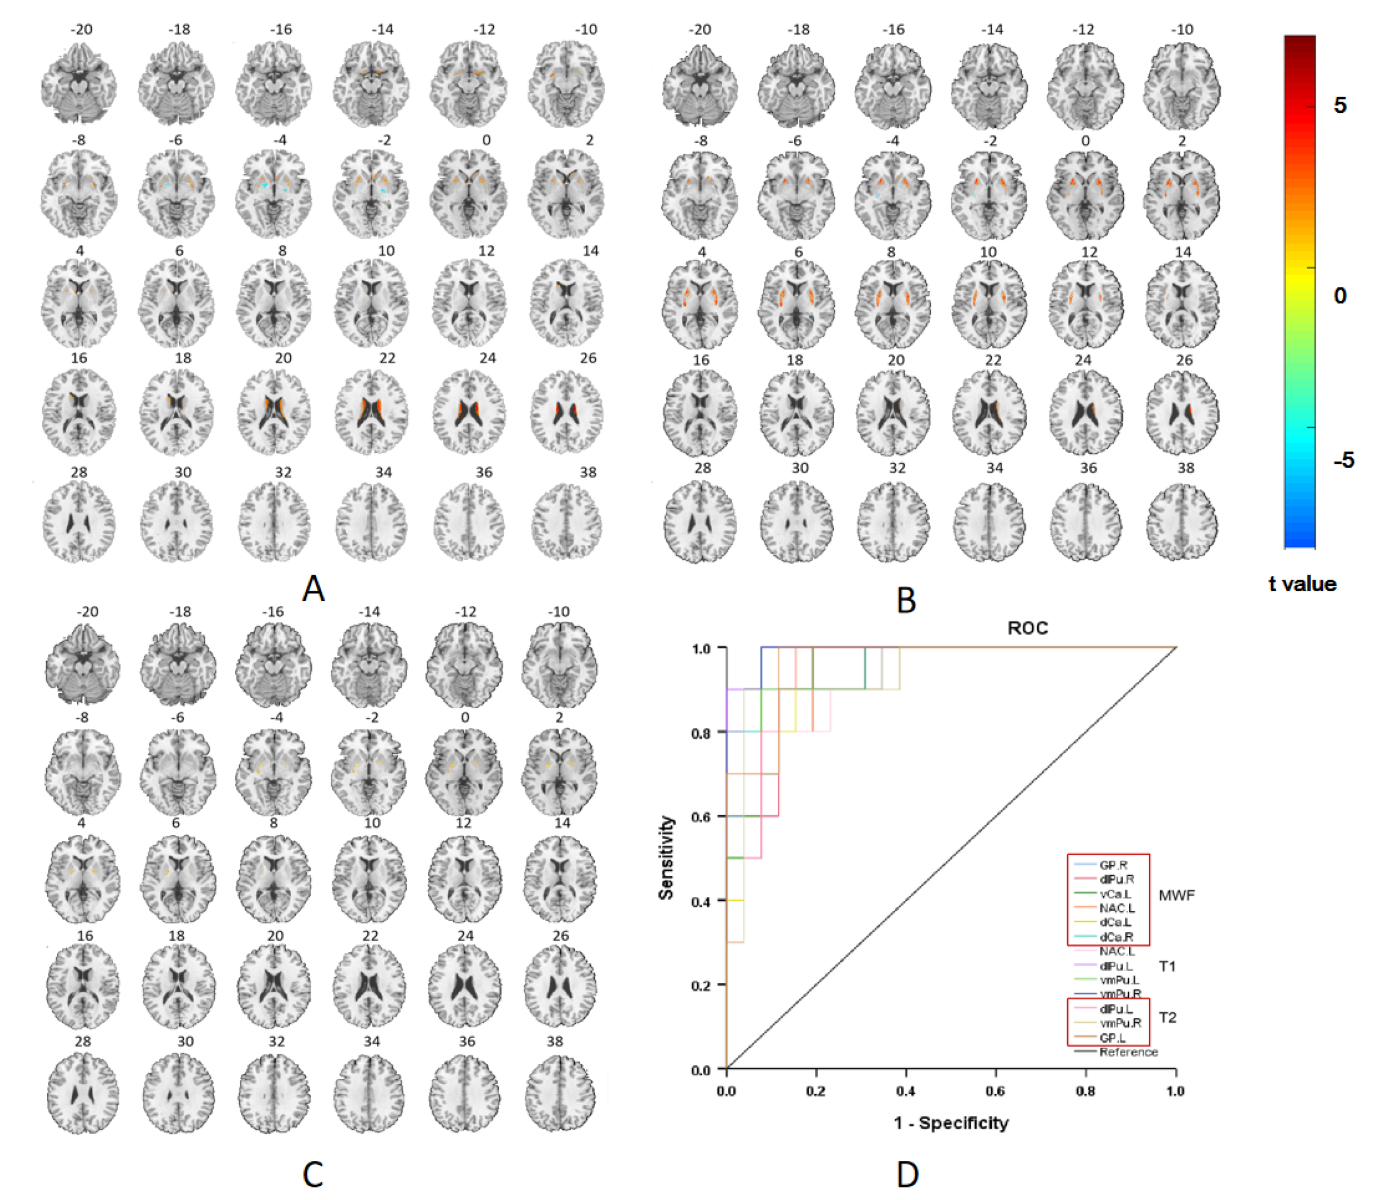
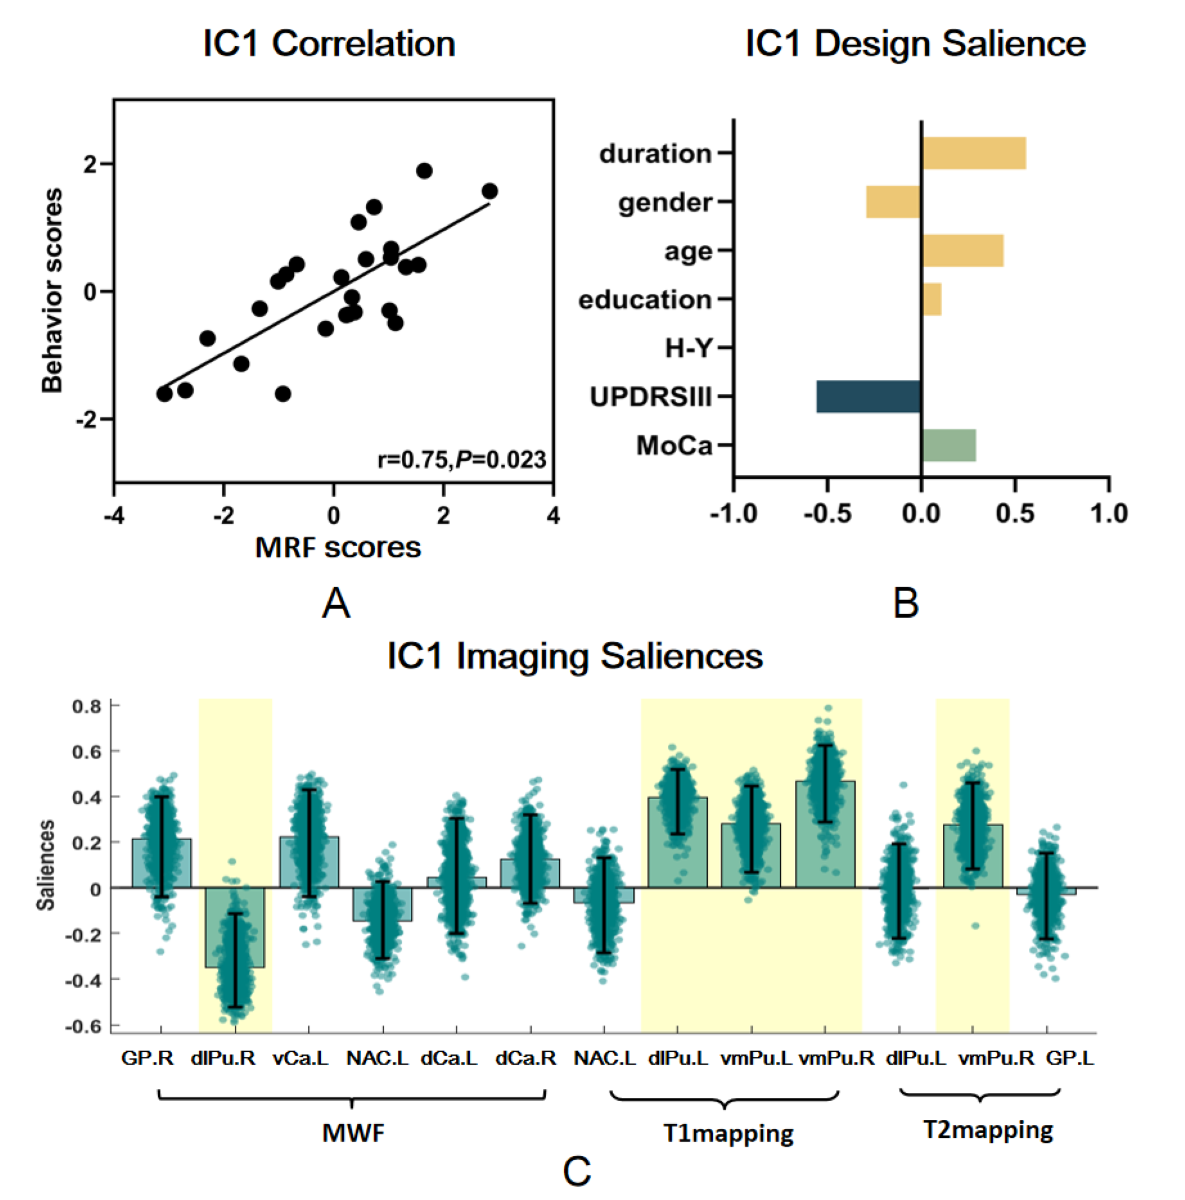
The study revealed significant differences in MRF measures between PD and HC groups (FDR corrected, P<0.05). Elevated MWF values in PD patients primarily manifested in bilateral dorsal caudate (dCa), right dorsolateral putamen (dlPu), and left nucleus accumbens (NAC). Conversely, reduced MWF was observed mainly in the left ventral caudate (vCa) and right globus pallidus (GP). T1 alterations were evident, with increased values primarily in bilateral ventromedial putamen (vmPu) and the left dlPu, and decreased values in the left NAC. T2 values were consistently reduced across the PD group, predominantly in the left GP, right vmPu, and left dlPu. ROC curve analysis indicated the diagnostic potential of BG tissue characteristics in distinguishing PD and HC groups, with MWF in the right GP(AUC=0.988), T1 in the left dlPu(AUC=0.992), and T2 in the right GP(AUC=0.965,) exhibiting the highest diagnostic efficacy. Furthermore, PLS-C analysis unveiled significant associations between tissue properties and motor impairment in PD patients(r=0.75,P=0.023). Notably, a negative correlation was observed between MWF values in the right dlPu and behavioral scores, while a positive correlation was found between both T1 and T2 values in the right vmPu and motor impairment with duration.Discussion
MRF uncovers intrinsic tissue properties, offering sensitive and complementary insights into tissue composition[3]. Specific alterations provide valuable insights into PD's pathophysiology. Prolonged T1 and reduced T2 in the putamen may reflect aggravated motor impairments, possibly associated with iron deposition. An elevated MWF in the dorsolateral striatum may result from drug-induced changes, consistent with its sensitivity to dopamine[4]. Correlation analyses further support the interpretability of MRF regarding striatal injuries. The diagnostic potential of MRF in PD is underscored, enabling early disease detection. Clinical correlations highlight MRF's significance in assessing motor impairment and disease severity. Future research can explore MRF's capabilities for monitoring PD progression and treatment responses, potentially revolutionizing PD diagnosis and care.Conclusions
In summary, our findings underscore the considerable potential of the MRF technique in quantifying disease severity in PD patients. The use of MRF multi-parametric imaging provides objective and quantifiable metrics for assessing BG tissue damage. This research may contribute to the improvement of diagnostic and evaluative approaches for PD.Acknowledgements
This work was conducted at the First hospital of China Medical University. The authors thank all the participants for attending this study. The corresponding author providing the guidance of this study. The data that support the findings of this study are available from the corresponding author upon reasonable request.References
1. Chen Y, Chen M-H, Baluyot KR, Potts TM, Jimenez J, Lin W: MR fingerprinting enables quantitative measures of brain tissue relaxation times and myelin water fraction in the first five years of life. NeuroImage 2019, 186:782-793.
2. Jiang Y, Ma D, Seiberlich N, Gulani V, Griswold MA. MR fingerprinting using fast imaging with steady state precession (FISP) with spiral readout. Magn Reson Med 2015;74(6):1621–1631.
3. Gaur S, Panda A, Fajardo JE, Hamilton J, Jiang Y, Gulani V: Magnetic Resonance Fingerprinting. Investigative Radiology 2023, 58(8):561-577.
4. Kasanuki K, Heckman MG, Diehl NN, Murray ME, Koga S, Soto A, Ross OA, Dickson DW: Regional analysis and genetic association of nigrostriatal degeneration in Lewy body disease. Movement Disorders 2017, 32(11):1584-1593.
Figures