3552
MR Fingerprinting-based myelin water fraction: stability, spatial consistency and sensitivity to alterations in pediatric leukodystrophies1IRCCS Stella Maris Foundation, Pisa, Italy, 2INFN Pisa Division, Pisa, Italy, 3Department of Physics, University of Pisa, Pisa, Italy, 4GE HealthCare, Munich, Germany, 5Department of Clinical and Experimental Medicine, University of Pisa, Pisa, Italy
Synopsis
Keywords: MR Fingerprinting, MR Fingerprinting, Myelin Water Fraction, White Matter
Motivation: Multicomponent Magnetic Resonance Fingerprinting (MRF) provides Myelin Water Fraction (MWF) maps in clinically-compatible scan time. However, it still requires validation and assessment of sensitivity and robustness.
Goal(s): We aimed to assess MWF stability to model parameters variations, its spatial consistency in healthy children, and sensitivity to alterations in leukodystrophies.
Approach: Two-pool relaxation times and exchange were varied in a 10% range. MWF profiles were computed in main WM tracts. MWF sensitivity to alterations was compared to FA, R1, and R2.
Results: Model parameters changes led to minimal MWF variations. MWF revealed consistent spatial patterns in controls and showed the highest sensitivity to pathology.
Impact: MRF provides robust and sensitive measurements of MWF. As it also allows the simultaneous acquisition of high-resolution R1 and R2 maps in a short scan time, it may represent a clinically-applicable metric to assess and monitor WM disorders.
Introduction
White matter (WM) pathologies can affect myelination patterns across the brain and a biomarker, like Myelin Water Fraction (MWF), capable of detecting alterations may facilitate patients’ diagnosis and monitoring. A two-pool model applied to MR-Fingerprinting (MRF) has been recently proposed to measure MWF in a short scan time1. We extended the model including chemical exchange and using a 3D sequence to obtain high-resolution whole-brain maps2. A limitation of this method is the use of fixed parameters for the two-pool model. Hence, we explored the impact of their variation on MWF quantification to assess its robustness. Moreover, we examined MRF-MWF profiles along WM tracts to assess their consistency across healthy pediatric subjects. We compared MWF sensitivity to WM alterations in children with leukodystrophies (LD) with other biomarkers, i.e., Fractional Anisotropy (FA) and MRF-derived R1 and R2.Methods
We enrolled 12 healthy children (HC) and 13 children (3-13 yo) with several types of LD.The acquisition protocol performed with a HDxt-1.5T MR system (GE HealthCare) included a 3D spiral projection SSFP-MRF (voxel size=1.1x1.1x1.1mm3; inversion-prepared variable flip angle scheme with fixed TE/TR=0.5ms/8.5ms, scan time=6min59s), a 3D T1-weighted image (voxel size=1x1x1mm3) for anatomical reference and a DTI (voxel size=3x3x3mm3, 30 gradient directions, b=1000s/mm2) for FA maps, computed via MRtrix3.
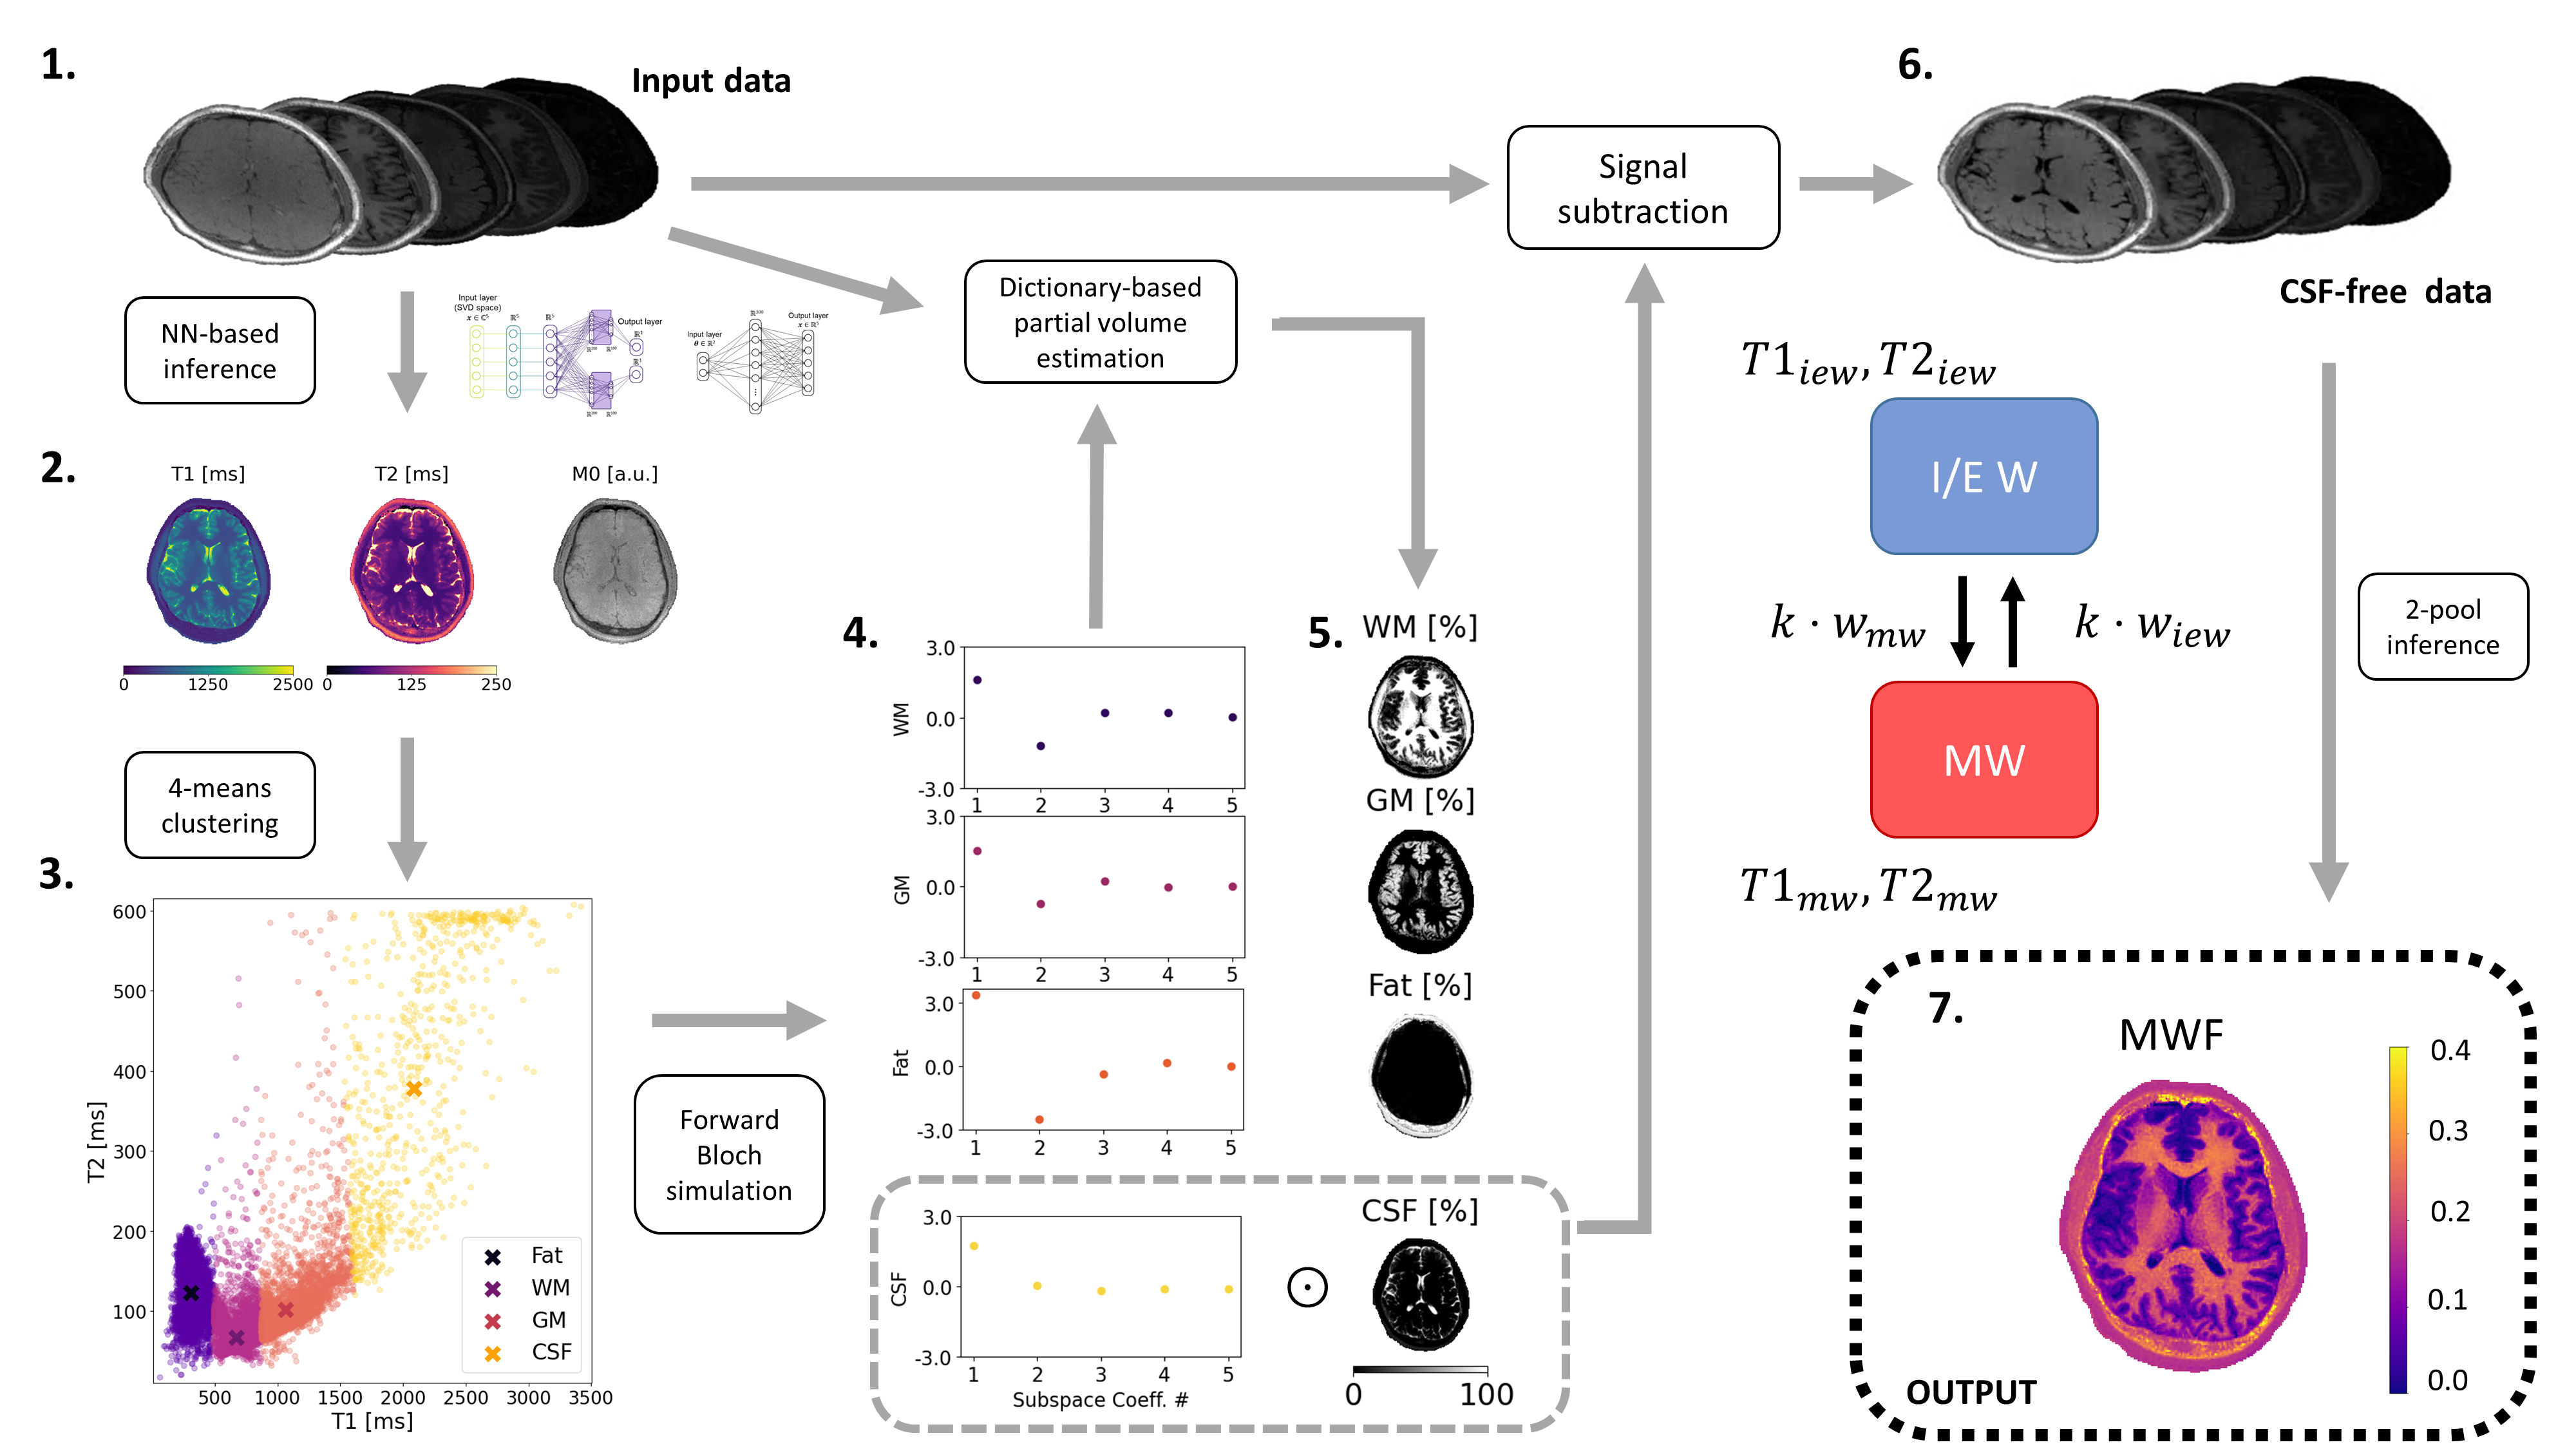
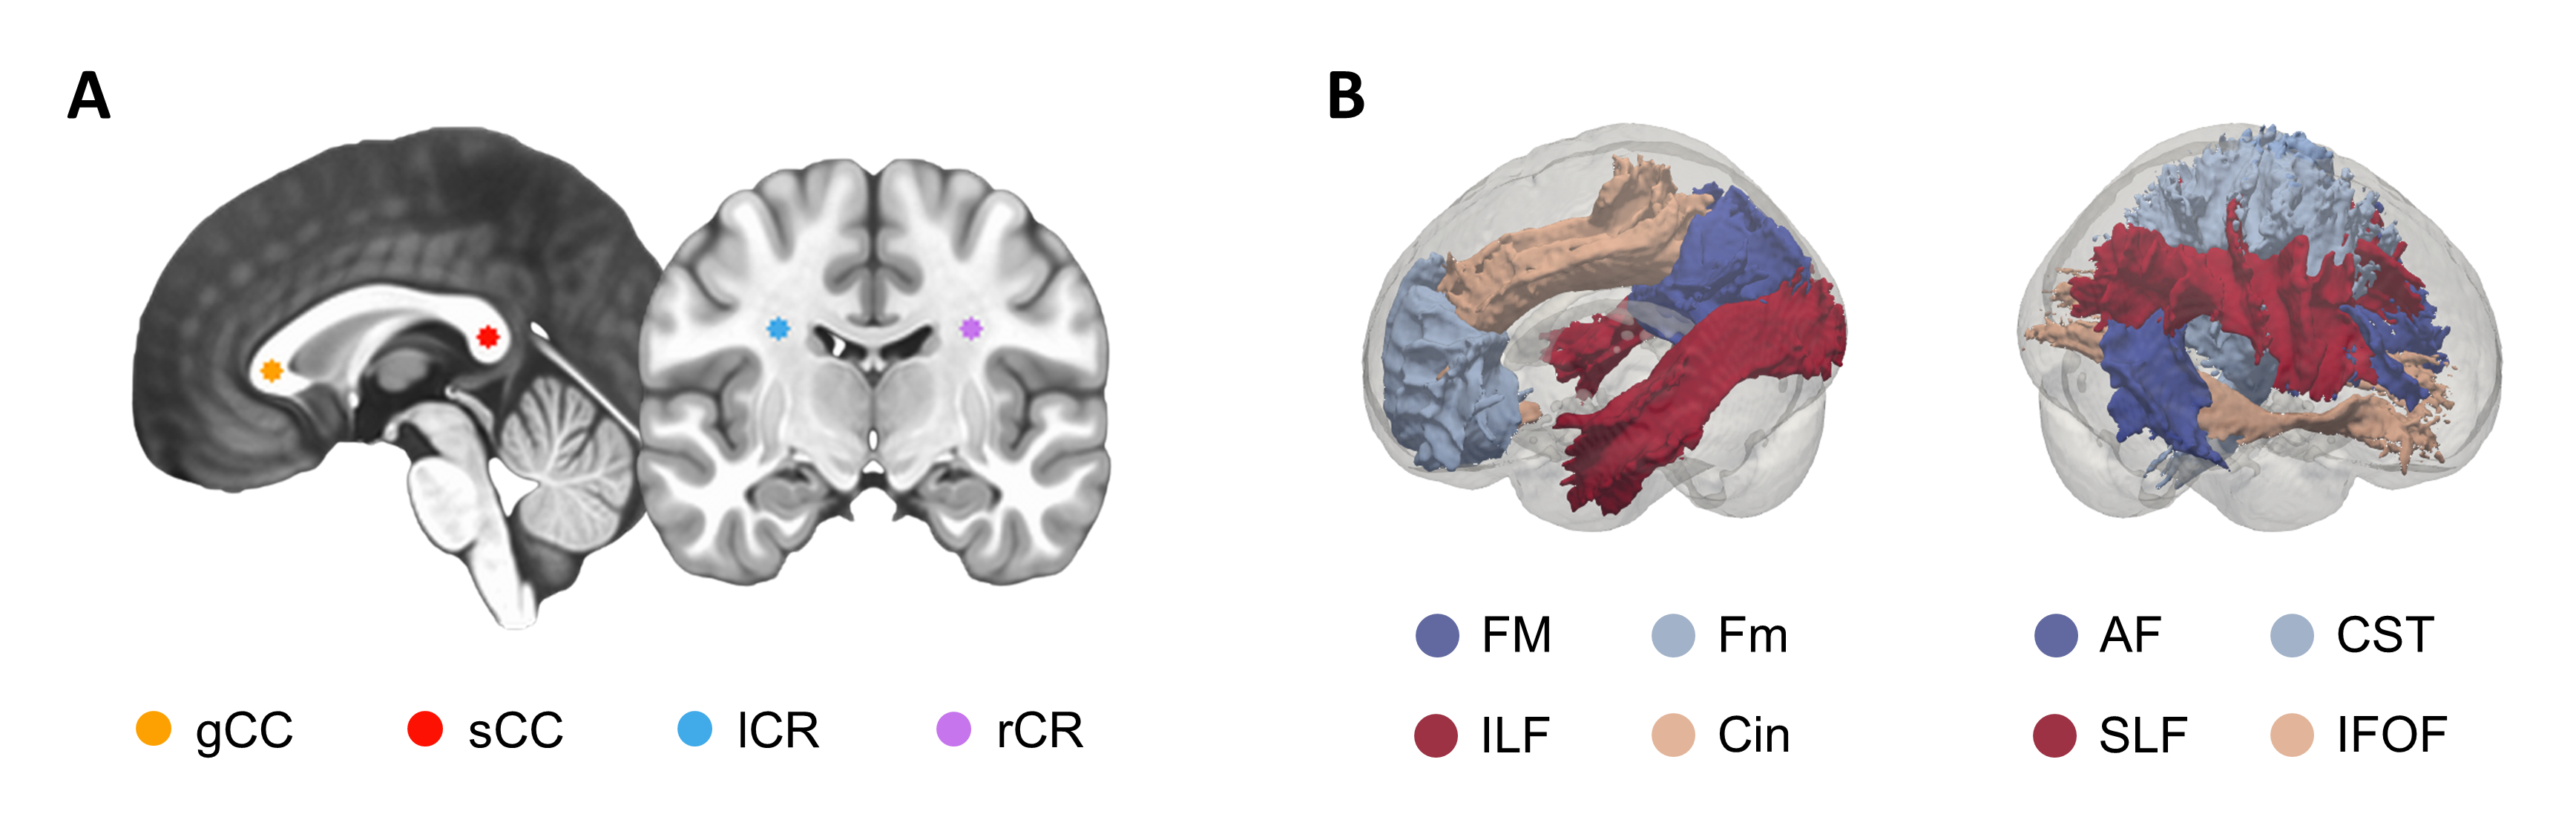
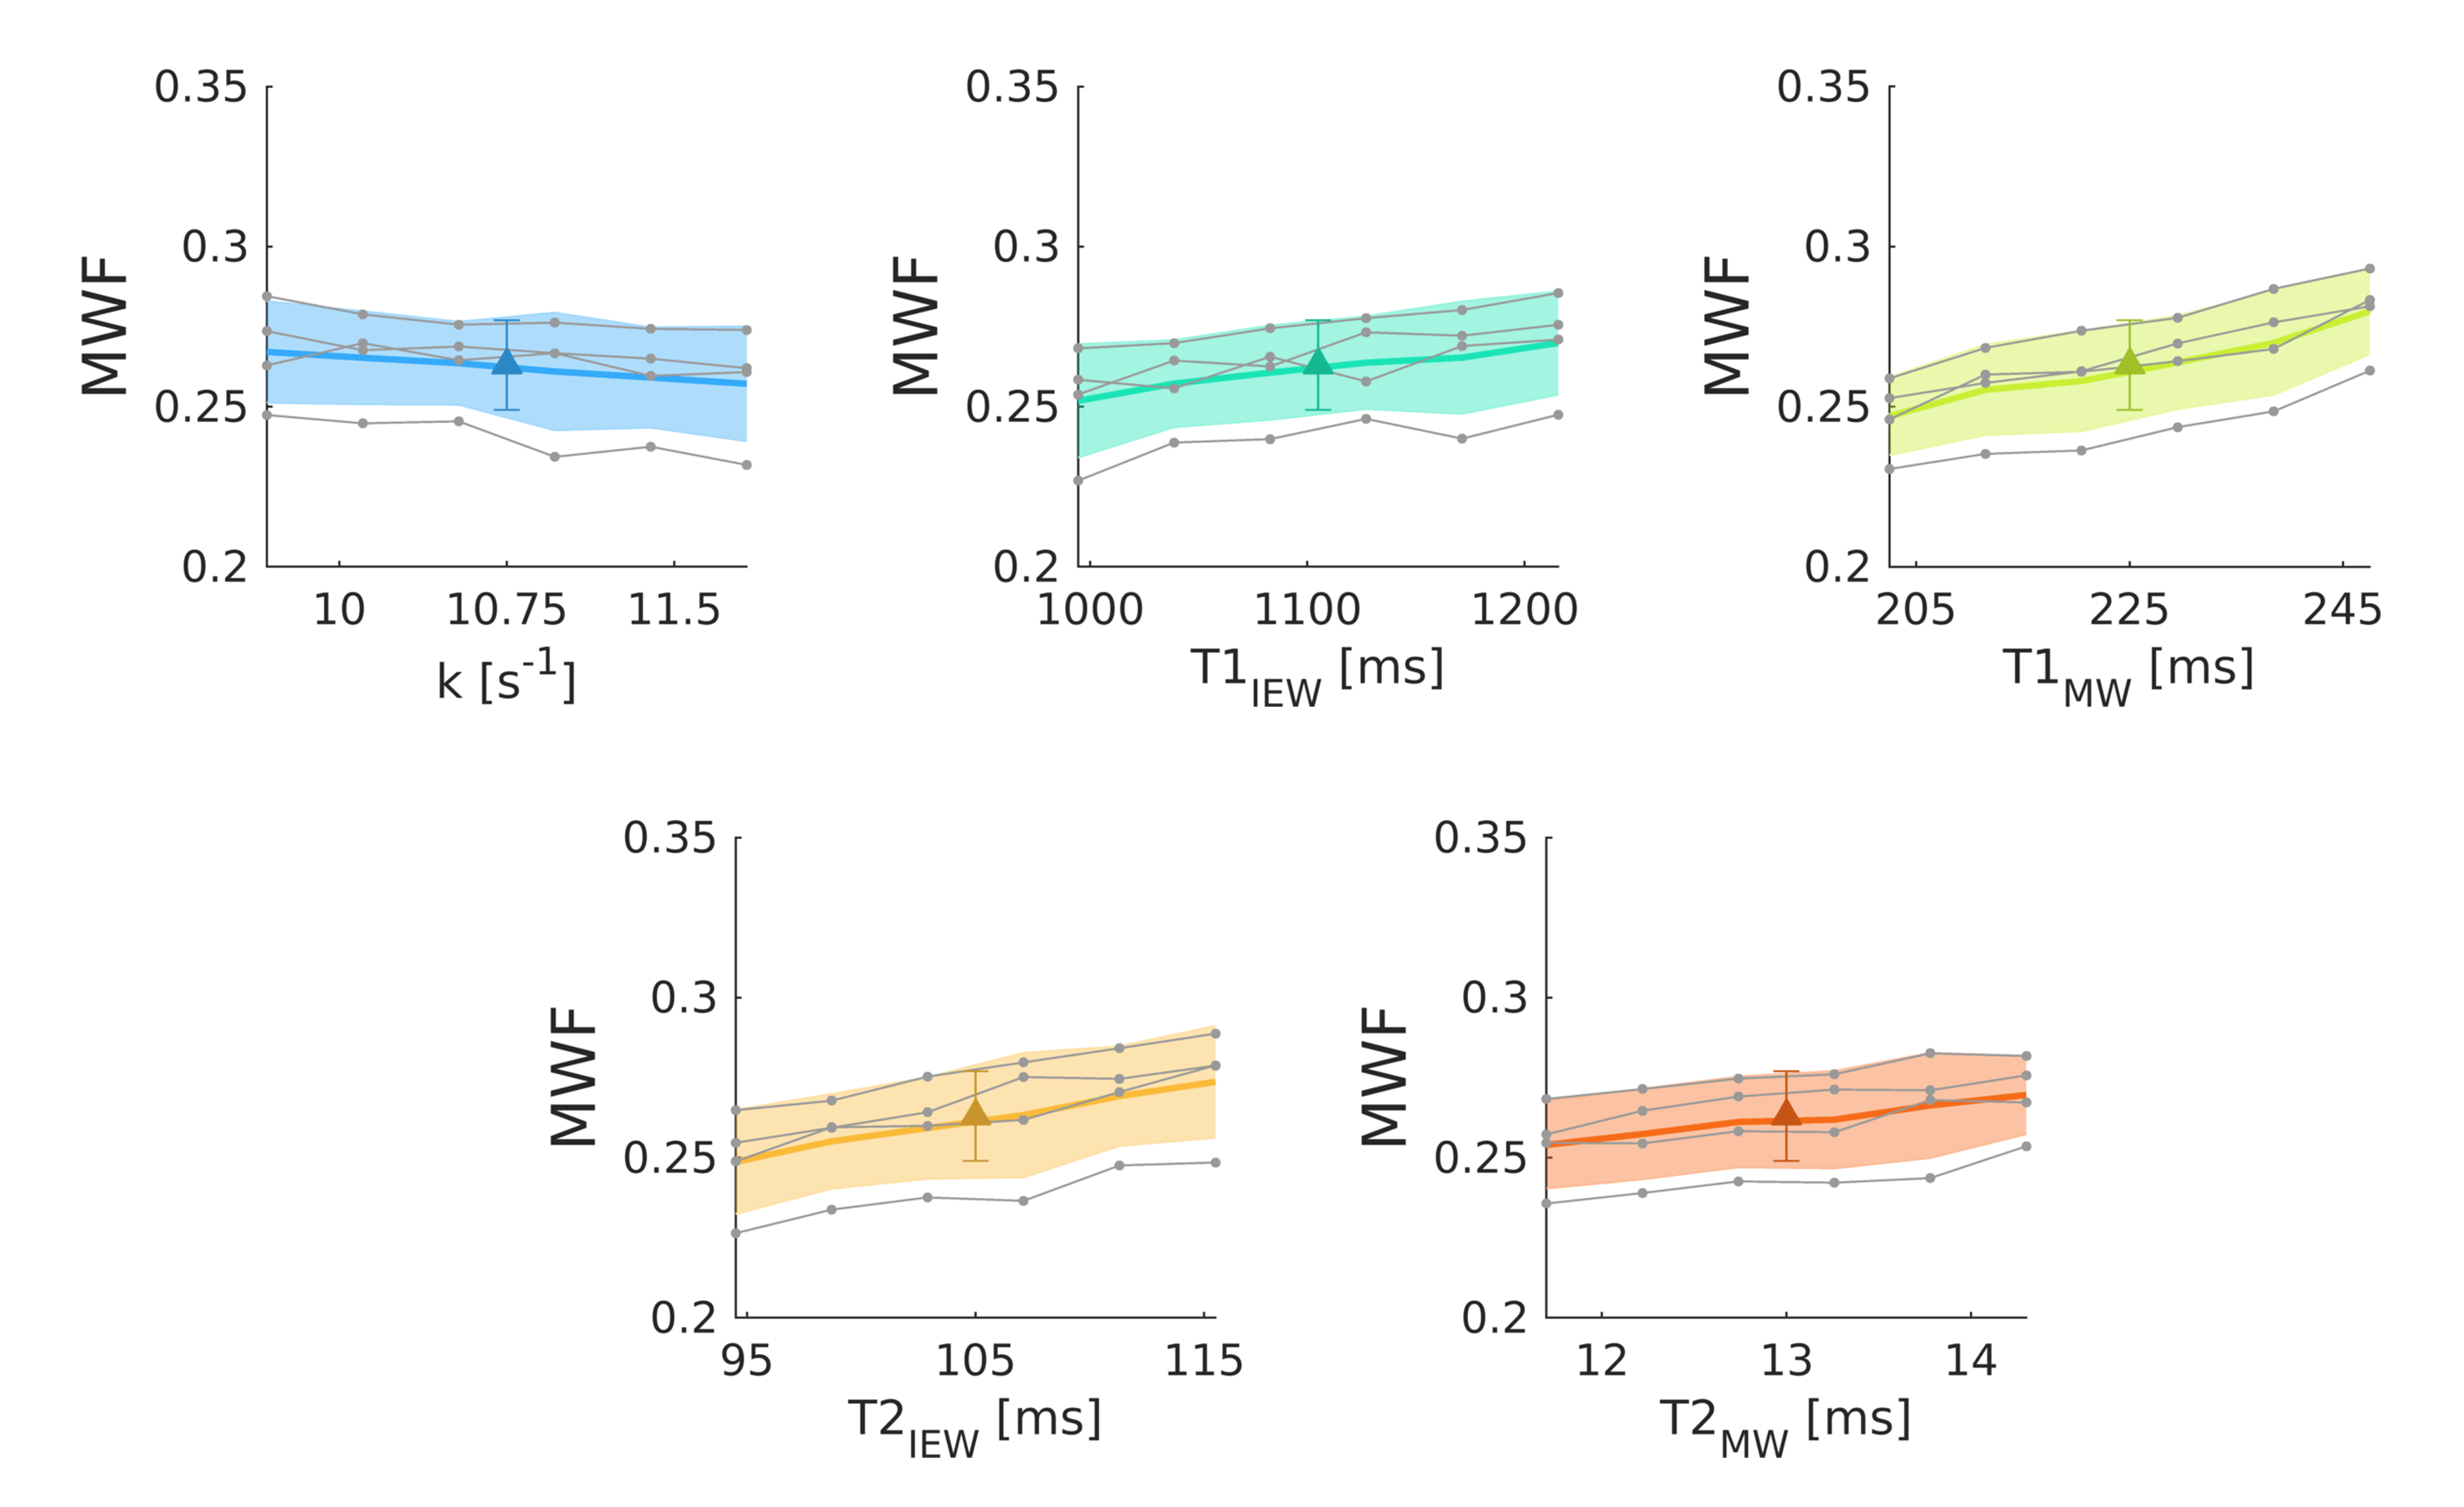
Besides R1 and R2 maps, we obtained MWF maps from MRF by removing cerebrospinal fluid (CSF) signal4 and matching tissue-only signal evolutions with a precomputed two-component dictionary, i.e., Intra/Extra-cellular (IEW) and Myelin Water (MW), based on Extended Phase Graphs simulation including chemical exchange (Figure 1). Relaxation and exchange properties for the two pools were assumed constant and set as an average of previous 1.5T reports5,6: IEW T1/T2=1105ms/105ms; MW T1/T2=225ms/13ms; non-directional exchange rate k=10.75s-1.To assess the impact of model properties on MWF quantification, we repeated the signal fitting while changing k, T1, and T2 for IEW and MW up to ±10%. MWF was then measured in the splenium and genu of corpus callosum (sCC, gCC) and on left and right corona radiata (lCR, rCR) (Figure 2A).
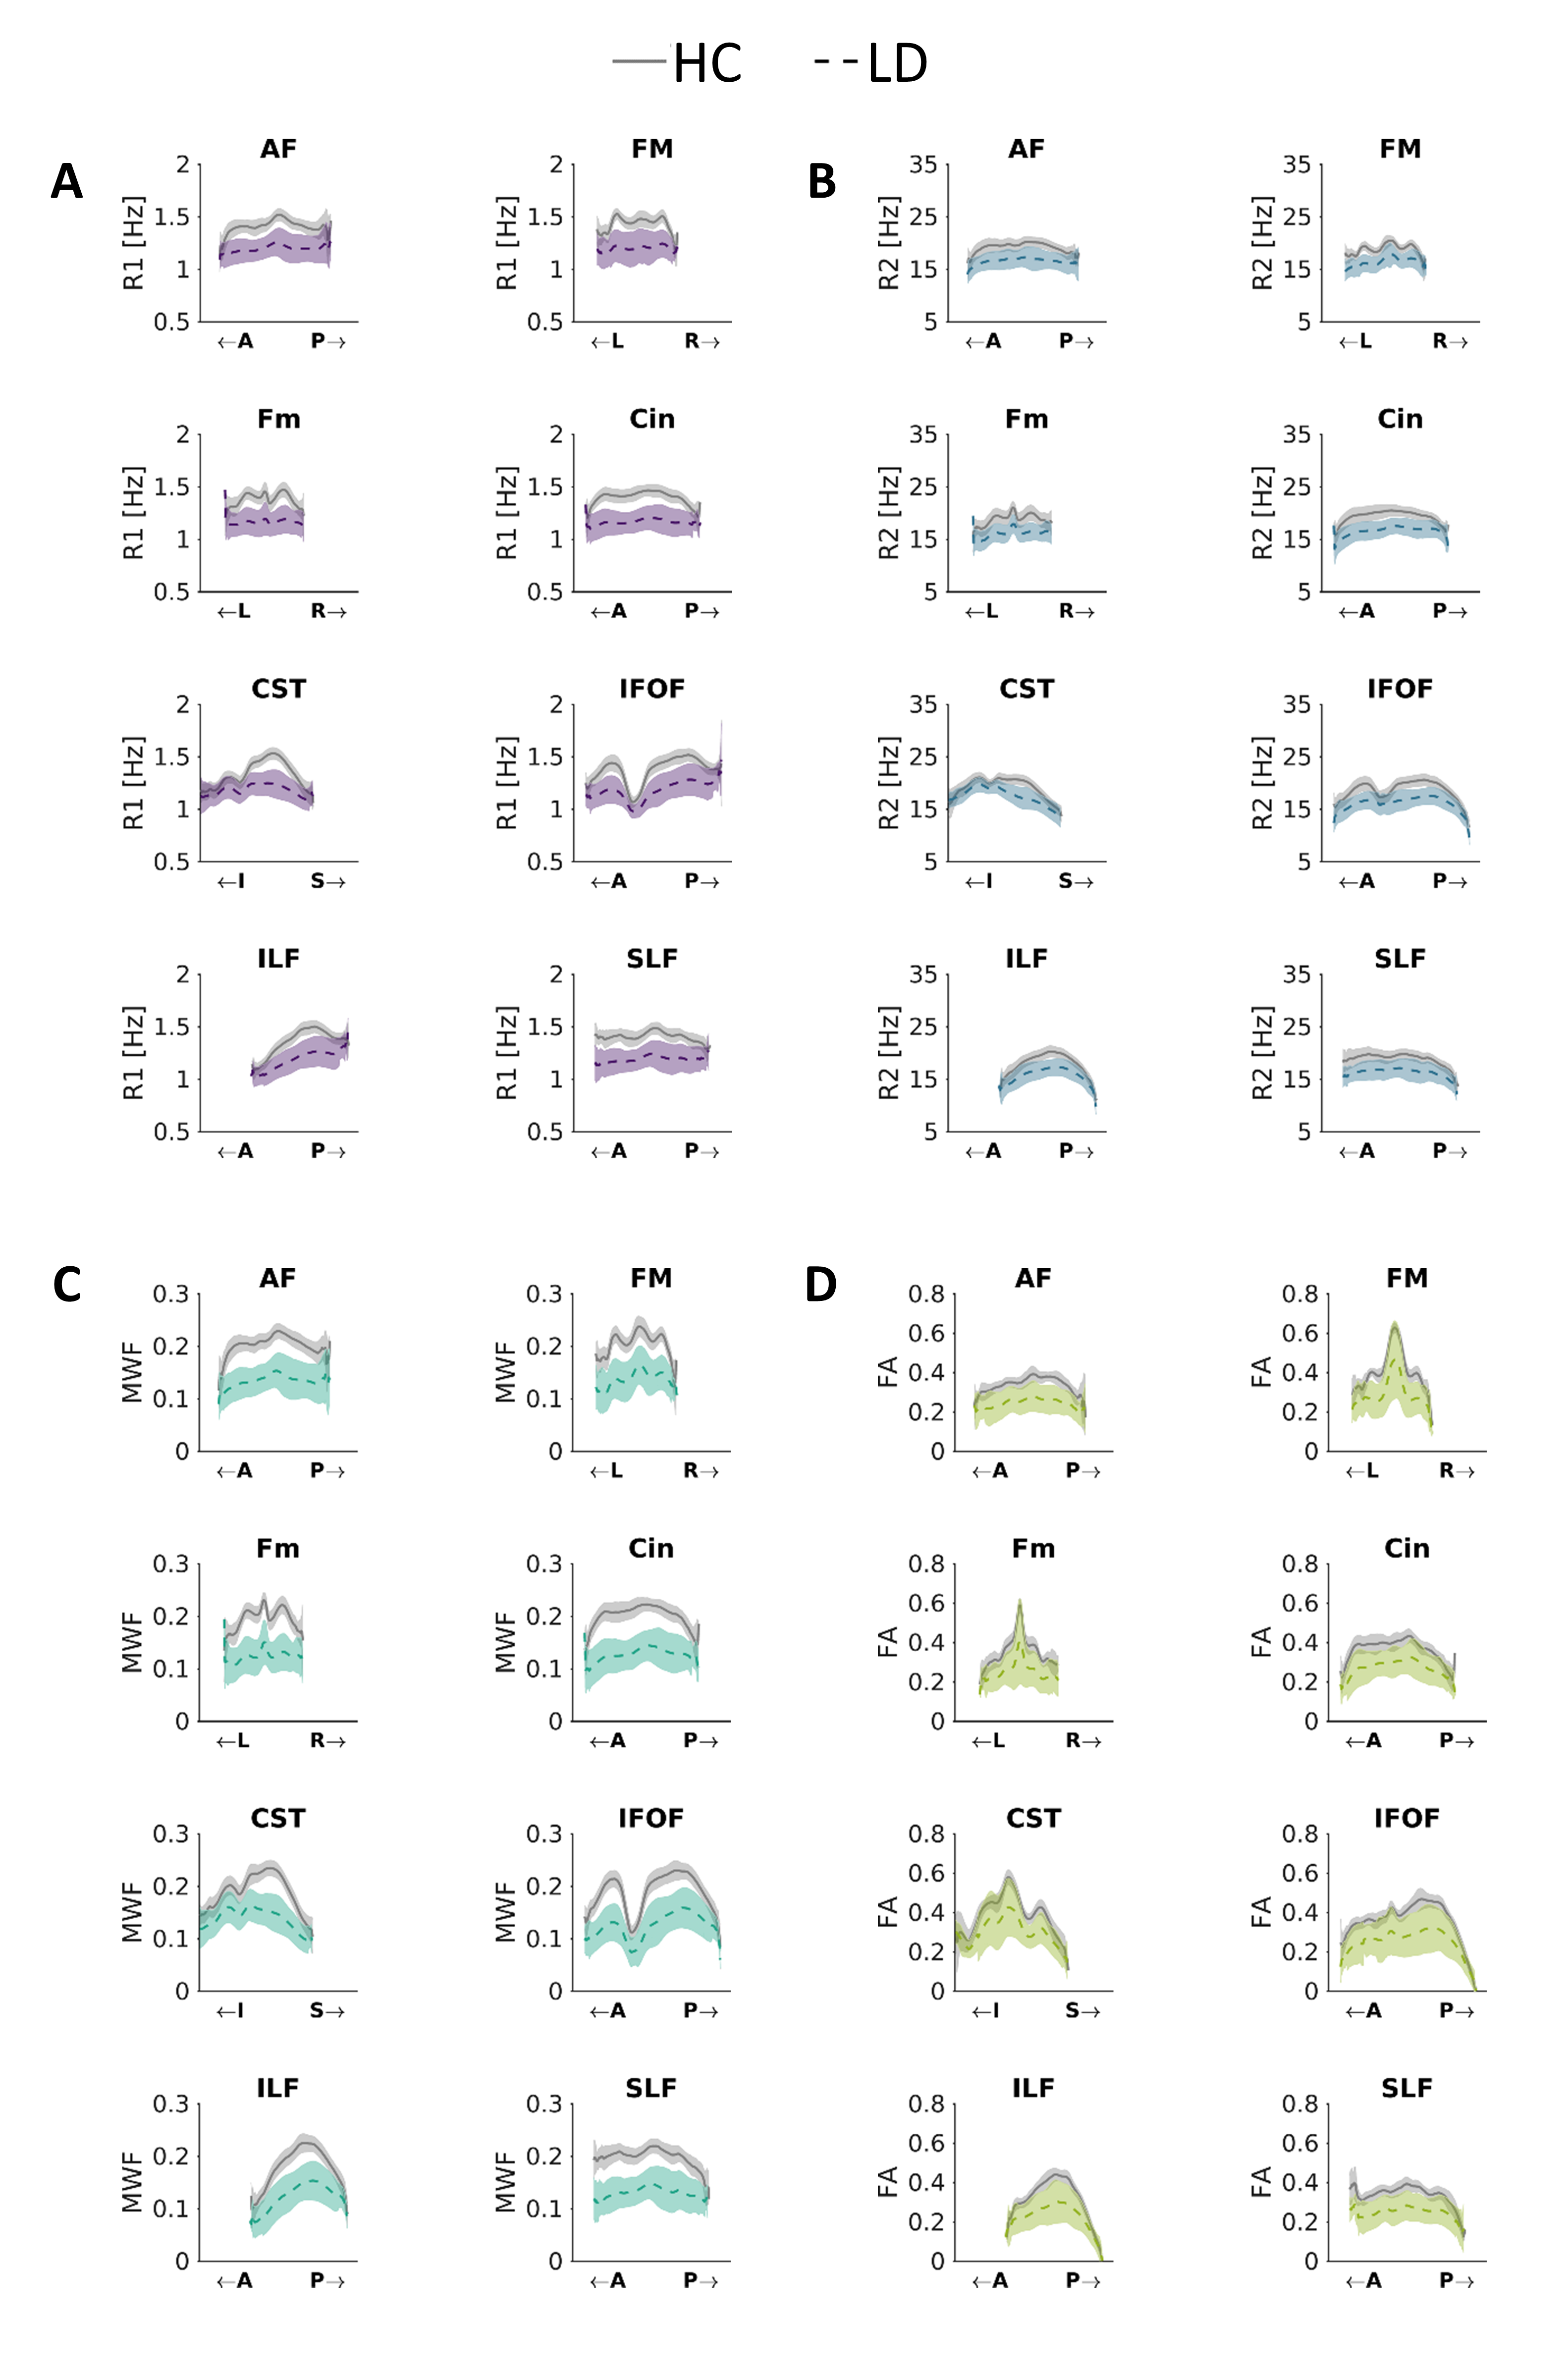
Both MRF- and DTI-derived maps were evaluated in fiber bundles from the IIT Human Brain Atlas (v.5.0)7, obtaining tract profiles using a 10-mm sliding window moving along the main direction of each tract (Figure 2B). Selecting subjects older than 3 years allowed averaging across different ages within populations, as myelin build-up rate is strongly reduced in this age interval after the steep growth in the first years of life1,8. Tract profiles in LD were considered different from HC when their distributions were separated by at least an effective FWHM. We evaluated inter-subject variability of profiles computing the across-subject standard deviation in each point of the tract.
Results
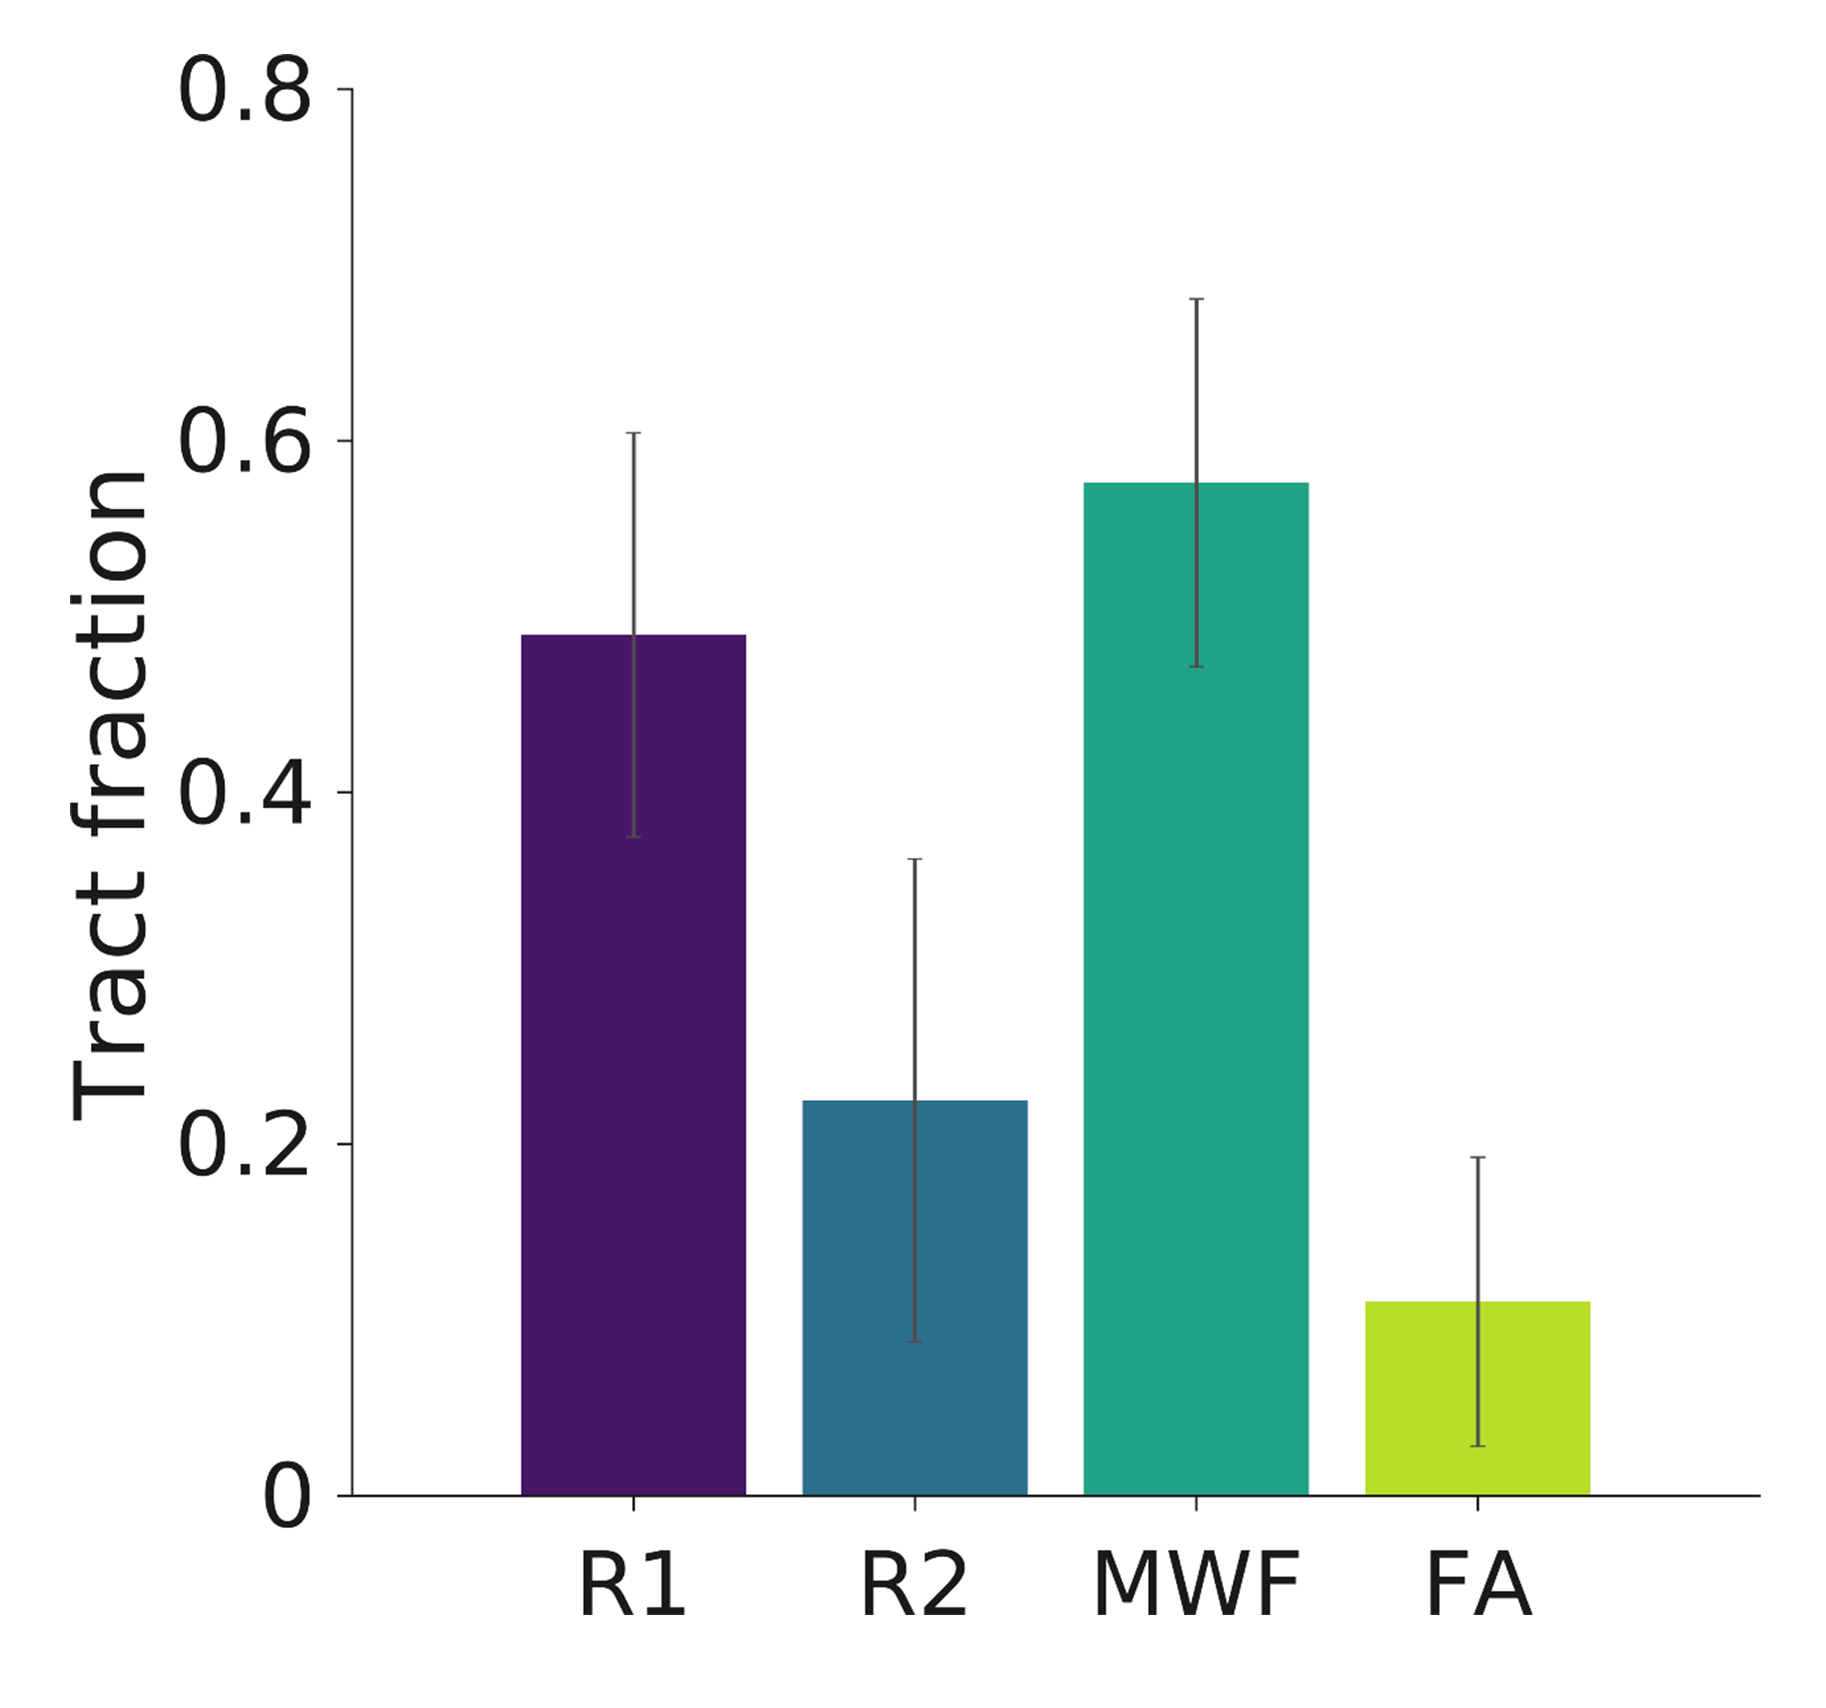
The analysis of the effect of model properties showed that MWF variations remained below 0.02 for all ROIs for a 10% variation of the two-pool parameters (Figure 3).Tract profiles were consistent across HC indicating the presence of specific spatial patterns of WM myelination and structure, with an average variability of 0.0152±0.0007 for MWF and 0.032±0.004 for FA, while higher variability was found in patients with an average standard deviation of 0.028±0.002 and 0.07±0.01 for MWF and FA, respectively (Figure 4). For R1 and R2 the variability in controls was 0.058±0.005Hz and 1.0±0.1Hz, respectively, and 0.105±0.009Hz and 1.45±0.07Hz in patients. MWF tract profiles showed the greatest separation between controls and patients compared to the other tissue properties in all tracts. The MWF distribution in controls was distinguishable from patients on the 60±10% of the profiles on average across tracts, and on the 50±10% for R1, while for R2 and FA this fraction dropped to 20±10% and 11±8%, respectively (Figure 5).
Discussion
Using fixed two-pool properties improves fit conditioning and its robustness, besides drastically reducing inference time. We verified that model parameter variation has a minimal impact on MWF quantification (bias≤7%).The analysis of MWF tract profiles on controls revealed a specific myelination pattern for each bundle and high spatial consistency across subjects (variation∼8%), in agreement with previous works computing MWF via T2-based techniques9,10. Higher cross-subject variability was found in patients, which is compatible with different patterns of WM involvement and disease severity. MWF was able to reveal widespread alterations of myelination in LD patients, outperforming the sensitivity of FA, R1, and R2 in all tracts.
Conclusion
MRF-MWF can retrieve the intrinsic WM myelination patterns consistently across subjects, showing minimal dependence on reasonable variations of model parameters. Moreover, MWF outperforms FA, T1, and T2 maps in detecting pathological alterations in LD, possibly representing a powerful tool for studying WM disorders.Acknowledgements
This study was supported by the Italian Ministry of Health and the European Union - Next Generation EU - NRRP M6C2 - Investment 2.1 Enhancement and strengthening of biomedical research in the NHS FIABA Project PNRR-MR1-2022-12375648, BIaNCA project Pediatric Network IDEA RCR-2019-2366911-Rete IDEA, the grant RC and 5x1000 voluntary contributions to IRCCS Fondazione Stella Maris.References
1. Chen Y, Chen MH, Baluyot KR, Potts TM, Jimenez J, Lin W. MR fingerprinting enables quantitative measures of brain tissue relaxation times and myelin water fraction in the first five years of life. NeuroImage. 2019;186:782-793. doi:10.1016/j.neuroimage.2018.11.038
2. Lancione M, Cencini M, Buonincontri G, et al. Repeatability and reproducibility of MRF-based Myelin Water Fraction maps of healthy human brains. In: Proceedings of the 31st Annual Meeting and Exhibition of the International Society for Magnetic Resonance in Medicine. ; 2023.
3. Tournier JD, Calamante F, Gadian DG, Connelly A. Direct estimation of the fiber orientation density function from diffusion-weighted MRI data using spherical deconvolution. NeuroImage. 2004;23(3):1176-1185. doi:10.1016/j.neuroimage.2004.07.037
4. Deshmane A, McGivney D, Badve C, et al. Accurate synthetic FLAIR images using partial volume corrected MR fingerprinting. In: Proceedings of the 24th Annual Meeting and Exhibition of the International Society for Magnetic Resonance in Medicine. ; 2016.
5. Deoni SCL, Rutt BK, Arun T, Pierpaoli C, Jones DK. Gleaning multicomponent T1 and T2 information from steady-state imaging data. Magn Reson Med. 2008;60(6):1372-1387. doi:10.1002/mrm.21704
6. Warntjes M, Engström M, Tisell A, Lundberg P. Modeling the Presence of Myelin and Edema in the Brain Based on Multi-Parametric Quantitative MRI. Front Neurol. 2016;7. https://www.frontiersin.org/articles/10.3389/fneur.2016.00016
7. Qi X, Arfanakis K. Regionconnect: Rapidly extracting standardized brain connectivity information in voxel-wise neuroimaging studies. NeuroImage. 2021;225:117462. doi:10.1016/j.neuroimage.2020.117462
8. Deoni SCL, O’Muircheartaigh J, Elison JT, et al. White matter maturation profiles through early childhood predict general cognitive ability. Brain Struct Funct. 2016;221(2):1189-1203. doi:10.1007/s00429-014-0947-x
9. Baumeister TR, Kolind SH, MacKay AL, McKeown MJ. Inherent spatial structure in myelin water fraction maps. Magn Reson Imaging. 2020;67:33-42. doi:10.1016/J.MRI.2019.09.012
10. Dayan M, Monohan E, Pandya S, et al. Profilometry: A new statistical framework for the characterization of white matter pathways, with application to multiple sclerosis. Hum Brain Mapp. 2016;37(3):989-1004. doi:10.1002/hbm.23082
Figures