3551
Magnetization Transfer Magnetic Resonance Fingerprinting Using Spin Lock Preparations1Diagnostic Radiology, Oregon Health and Science University, Portland, OR, United States, 2Advanced Imaging Research Center, Oregon Health and Science University, Portland, OR, United States
Synopsis
Keywords: MR Fingerprinting, MR Fingerprinting, Magnetization Transfer
Motivation: Magnetization transfer (MT) techniques allow for quantitative measurement of the macromolecular proton fraction (MPF) of tissues. However, the process of measuring these MT parameters can be lengthy and require many assumptions of T1 and T2.
Goal(s): In this study, a magnetic resonance fingerprinting sequence is proposed that acquires T1, T2, and MPF using spin lock preparations.
Approach: An MRF sequence was created using spin lock preparations of various off-resonance frequencies to create MT contrast. The sequence was acquired in agarose phantoms and the human brain.
Results: Results showed increased MPF with increasing agarose concentration and in white matter.
Impact: This study demonstrates the effectiveness of using spin lock pulses for magnetization transfer MRF and allow for quick acquisition of MPF maps that are corrected for the T1 and T2 of the tissue.
Introduction
Magnetization transfer (MT) techniques allow for quantitative measurement of the macromolecular content of tissues. By using saturation pulses, the bound water fraction, or macromolecular proton fraction (MPF), can be quantified and used to probe macromolecular content. However, the process of measuring these MT parameters can be lengthy. Magnetic resonance fingerprinting (MRF) is a technique that allows for efficient quantification of multiple parameters. While previous work has been performed to obtain MPF values using MRF[1-3], none of the techniques have used spin lock preparations (SLPs) to induce magnetization transfer. Using continuous wave (CW) saturation results in less excitation of the on-resonance water and less Rabi oscillations[4]. Previous work by Hou et al.[5] has shown that off-resonance SLPs can be used to acquire MPF values, but the method requires several assumptions since the T1 and T2 relaxation times are not known. In this study, we evaluate the combination of MRF and SLP saturation techniques, allowing for simultaneous acquisition of T1, T2, and MPF.Methods
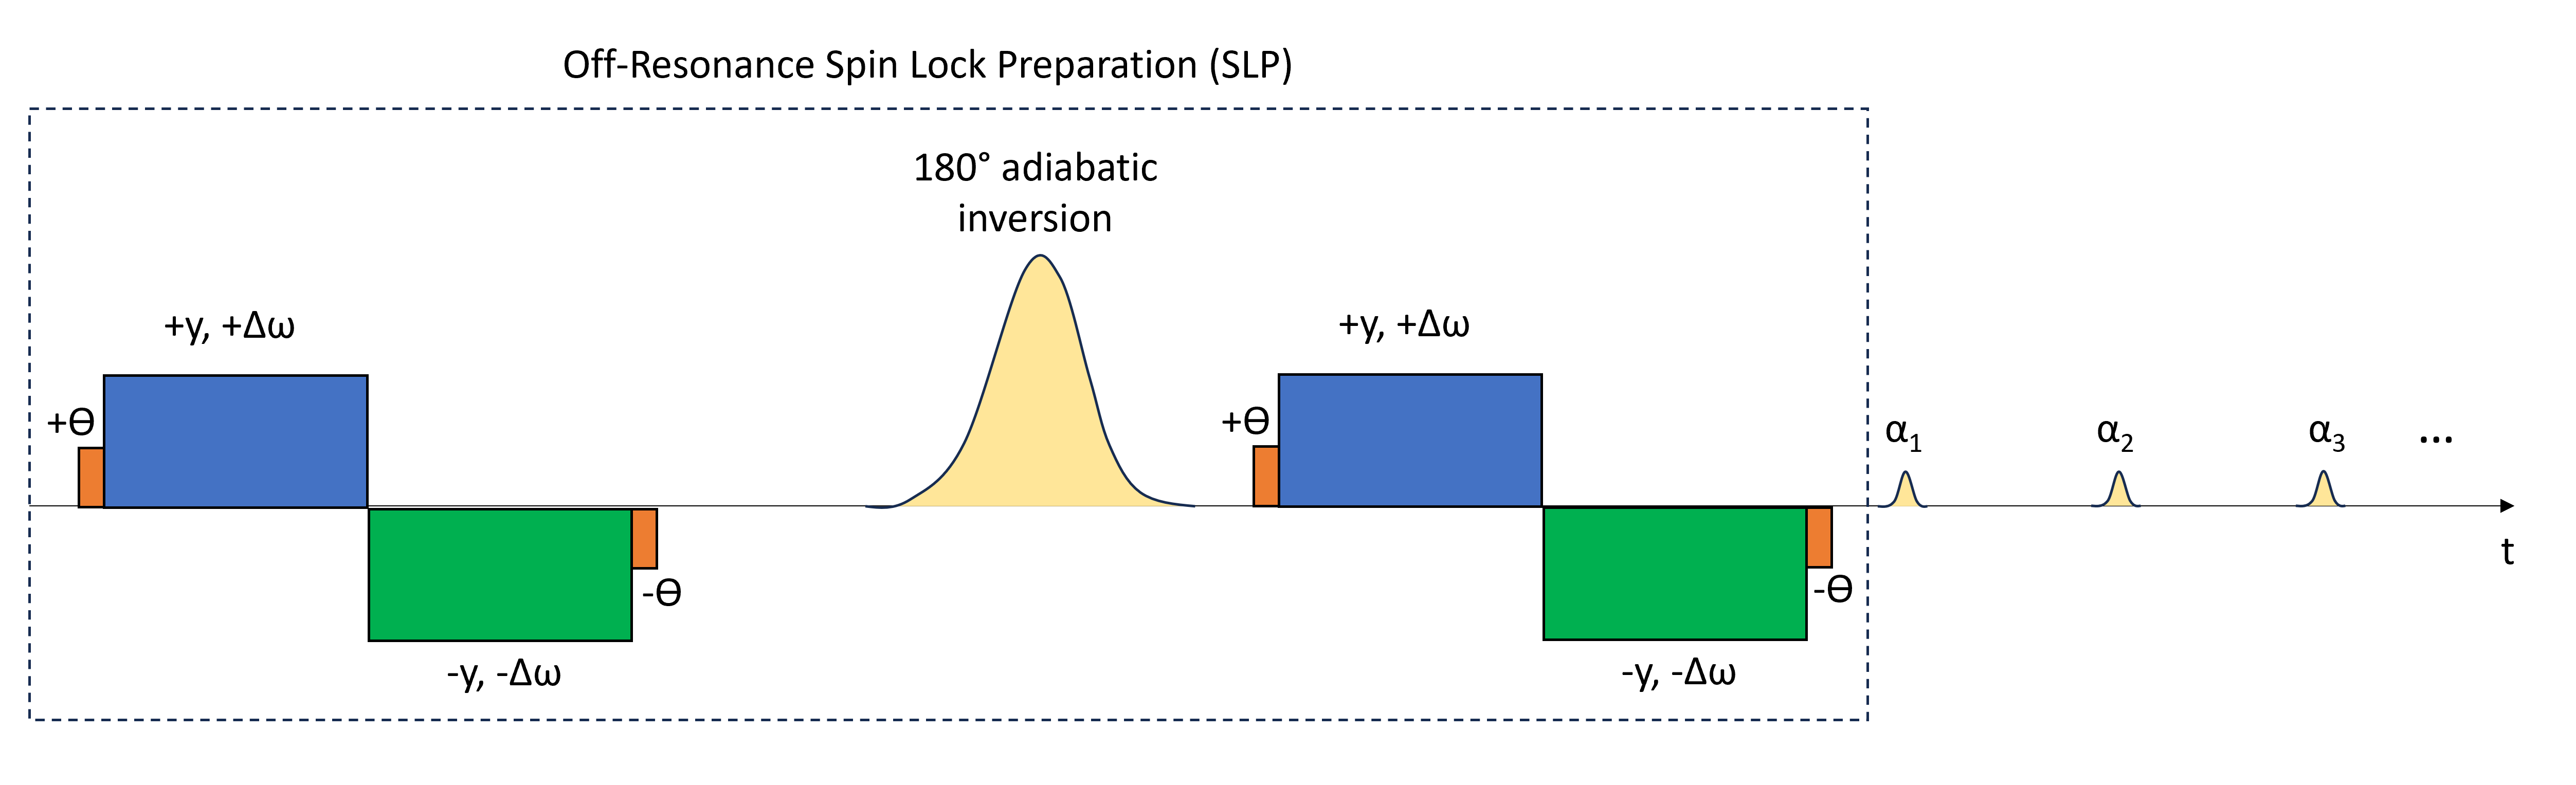
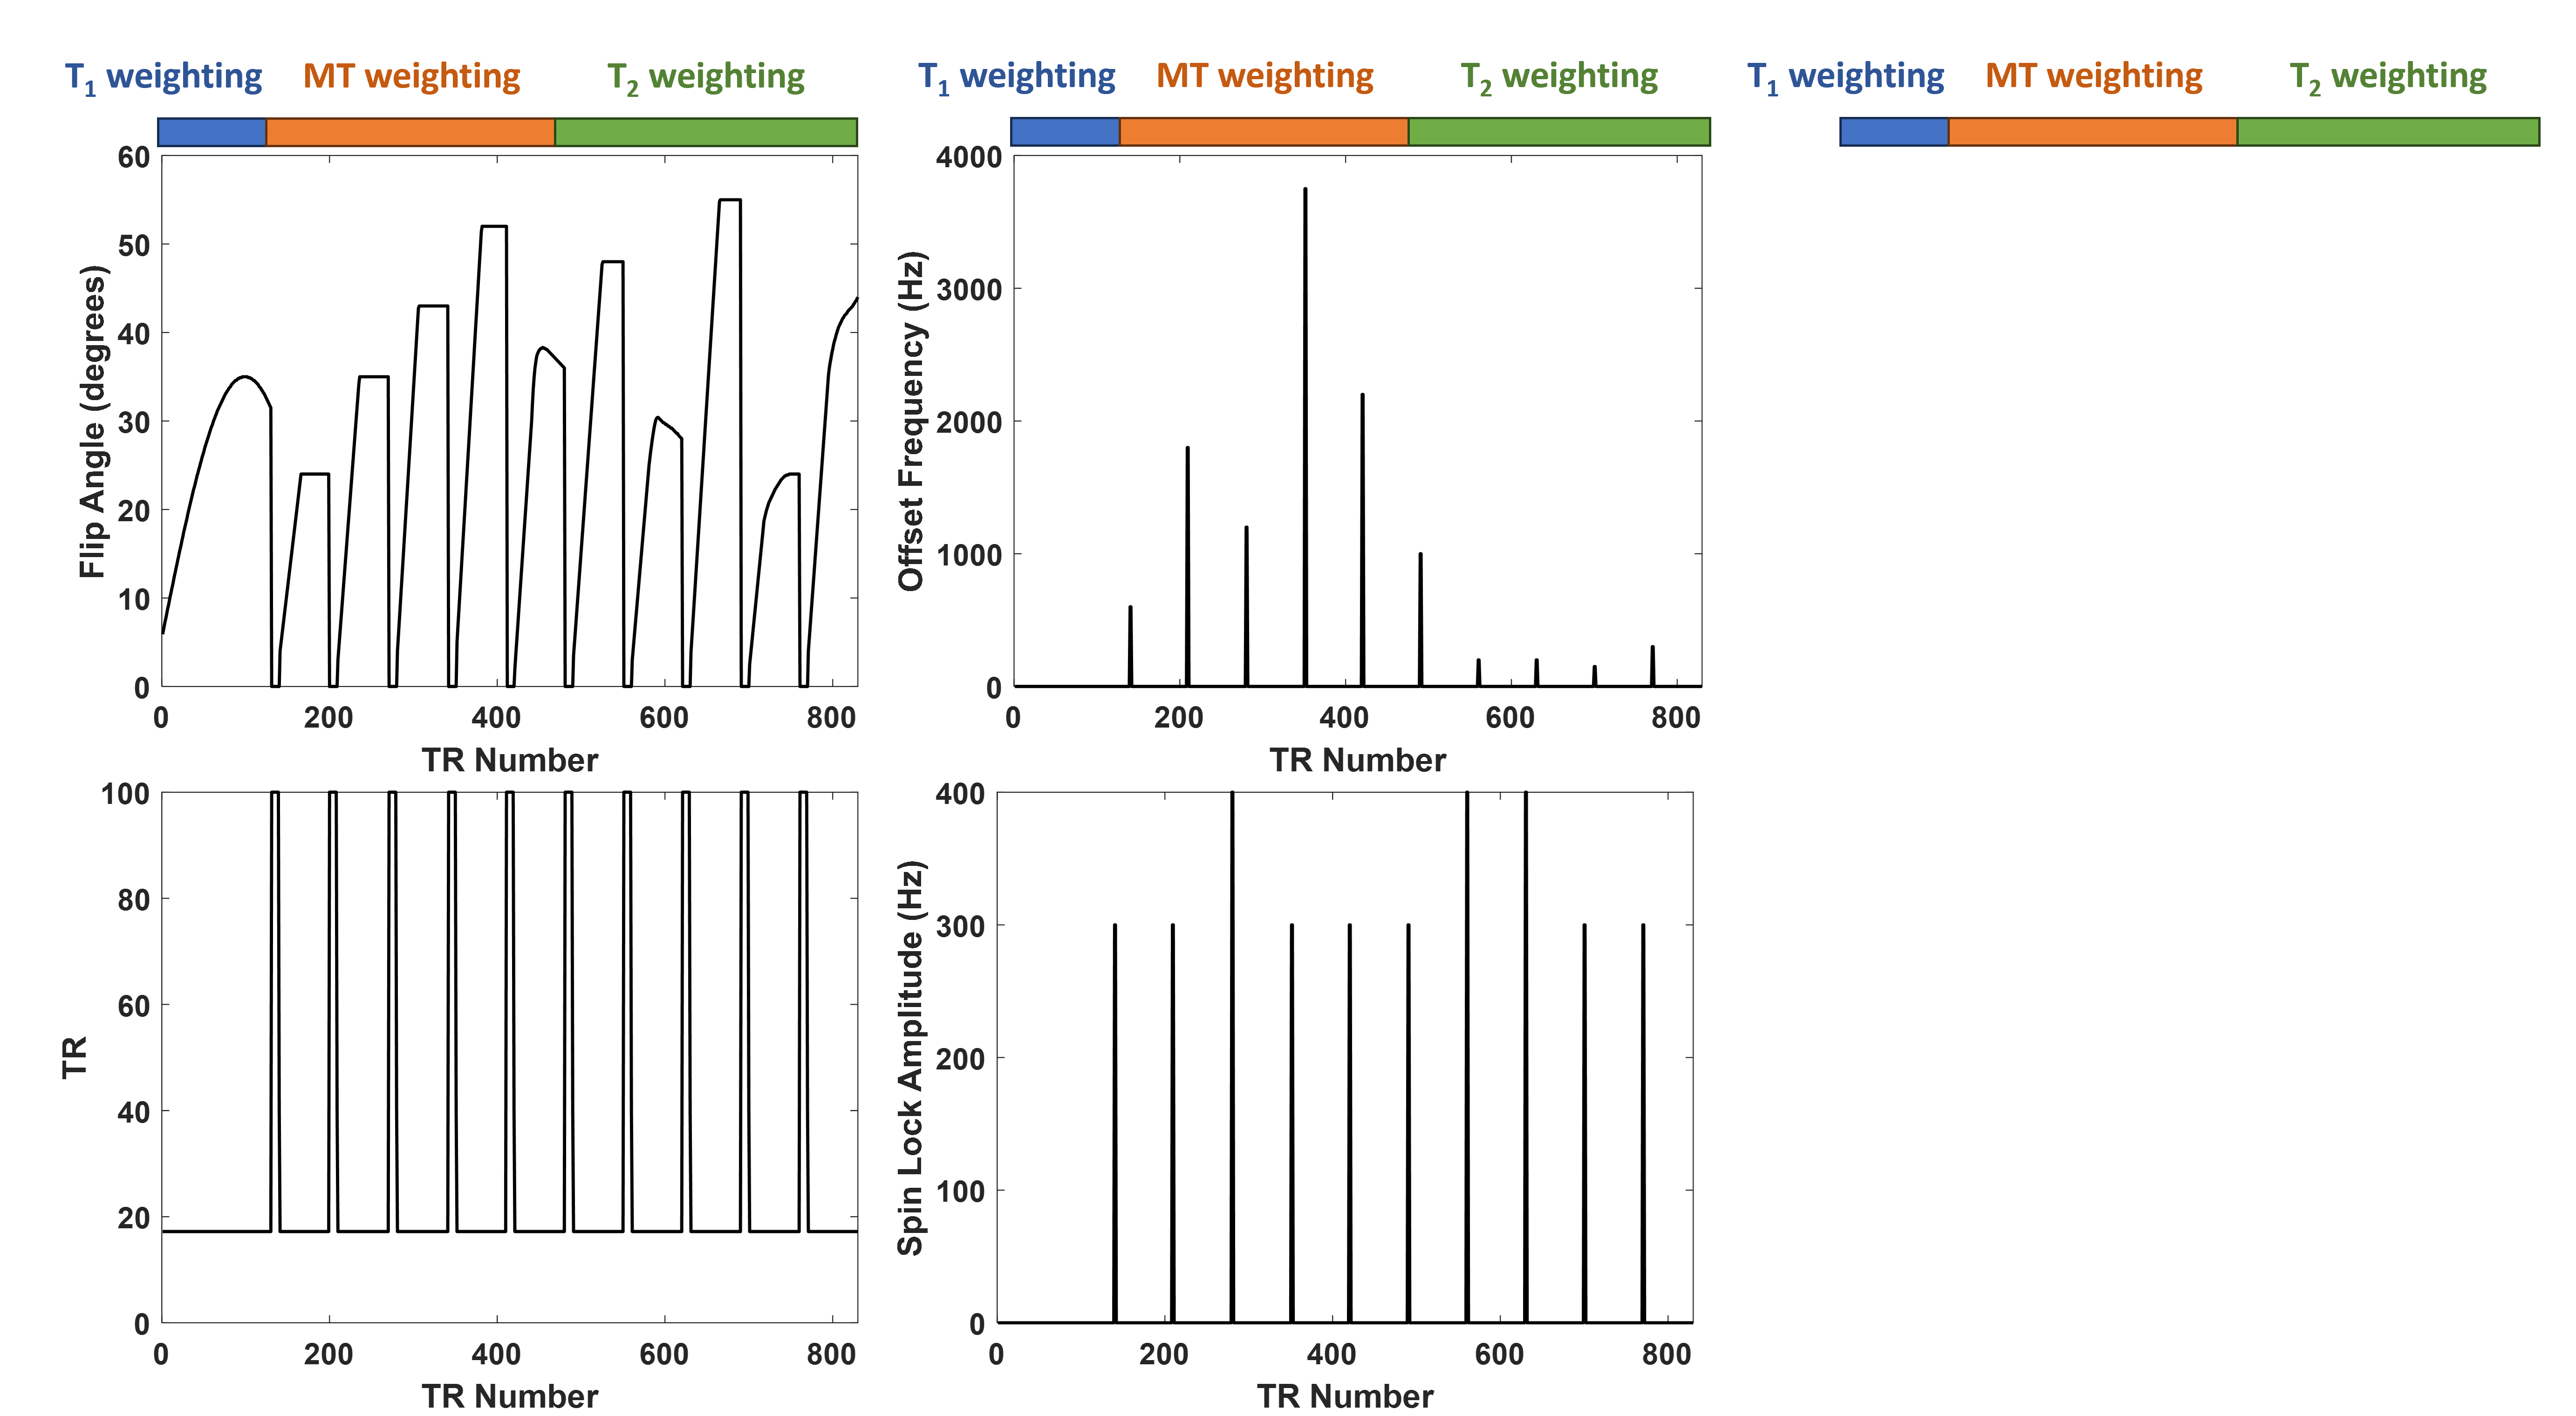
Sequence Design: The MRF design is based on a number of magnetization prepared segments, each containing approximately 60 TRs before a small break to allow for longitudinal magnetization to recover (830 TRs total). Before each segment, an off-resonant SLP is played. Each off-resonant SLP (shown in Figure 1) consists of two repeated spin lock clusters with an adiabatic inversion pulse in between to invert the magnetization, increasing T1 contrast in the following segment. The spin lock pulses themselves use a rotary echo to compensate for B1 inhomogeneity, as demonstrated by Witschey et al.[6]. The flip angles, repetition time (TR), off-resonant frequency of the SLPs, spin lock cluster duration, and spin lock amplitude are shown in Figure 2. An adiabatic inversion pulse is played before the start of the sequence to induce T1 relaxation. The sequence was sampled with a 2D undersampled variable density spiral which is approximately 24x undersampled at the center of k-space and 48x undersampled at the edges. RF spoiling with quadratic increase in phase was applied for all TRs. Additional parameters include FOV=25cm, data matrix=256x256, TE=2.3ms. The scan time was approximately 22 seconds per slice.Image Processing: A dictionary of possible signals was generated using Bloch simulation of 40 spins. The relaxation and magnetization transfer during the SLP was simulated using equations from Hou et al.[5] and Zaiss et al.[7] assuming T1free = T1bound, T2bound=10µs, and kba =55s-1, similar to Yarnykh et al.[8]. The dictionary was simulated for T1 values from 200:25:3000ms, T2 values from 4:2:120, and MPF values from 0.0025:0.0025:0.3. Images were reconstructed using a subspace constrained FISTA reconstruction in the Berkeley Advanced Reconstruction Toolbox (BART) toolbox[9]. The reconstructed subspace images were then fit for T1, T2, and MPF values using the dictionaries entries with the highest inner product.
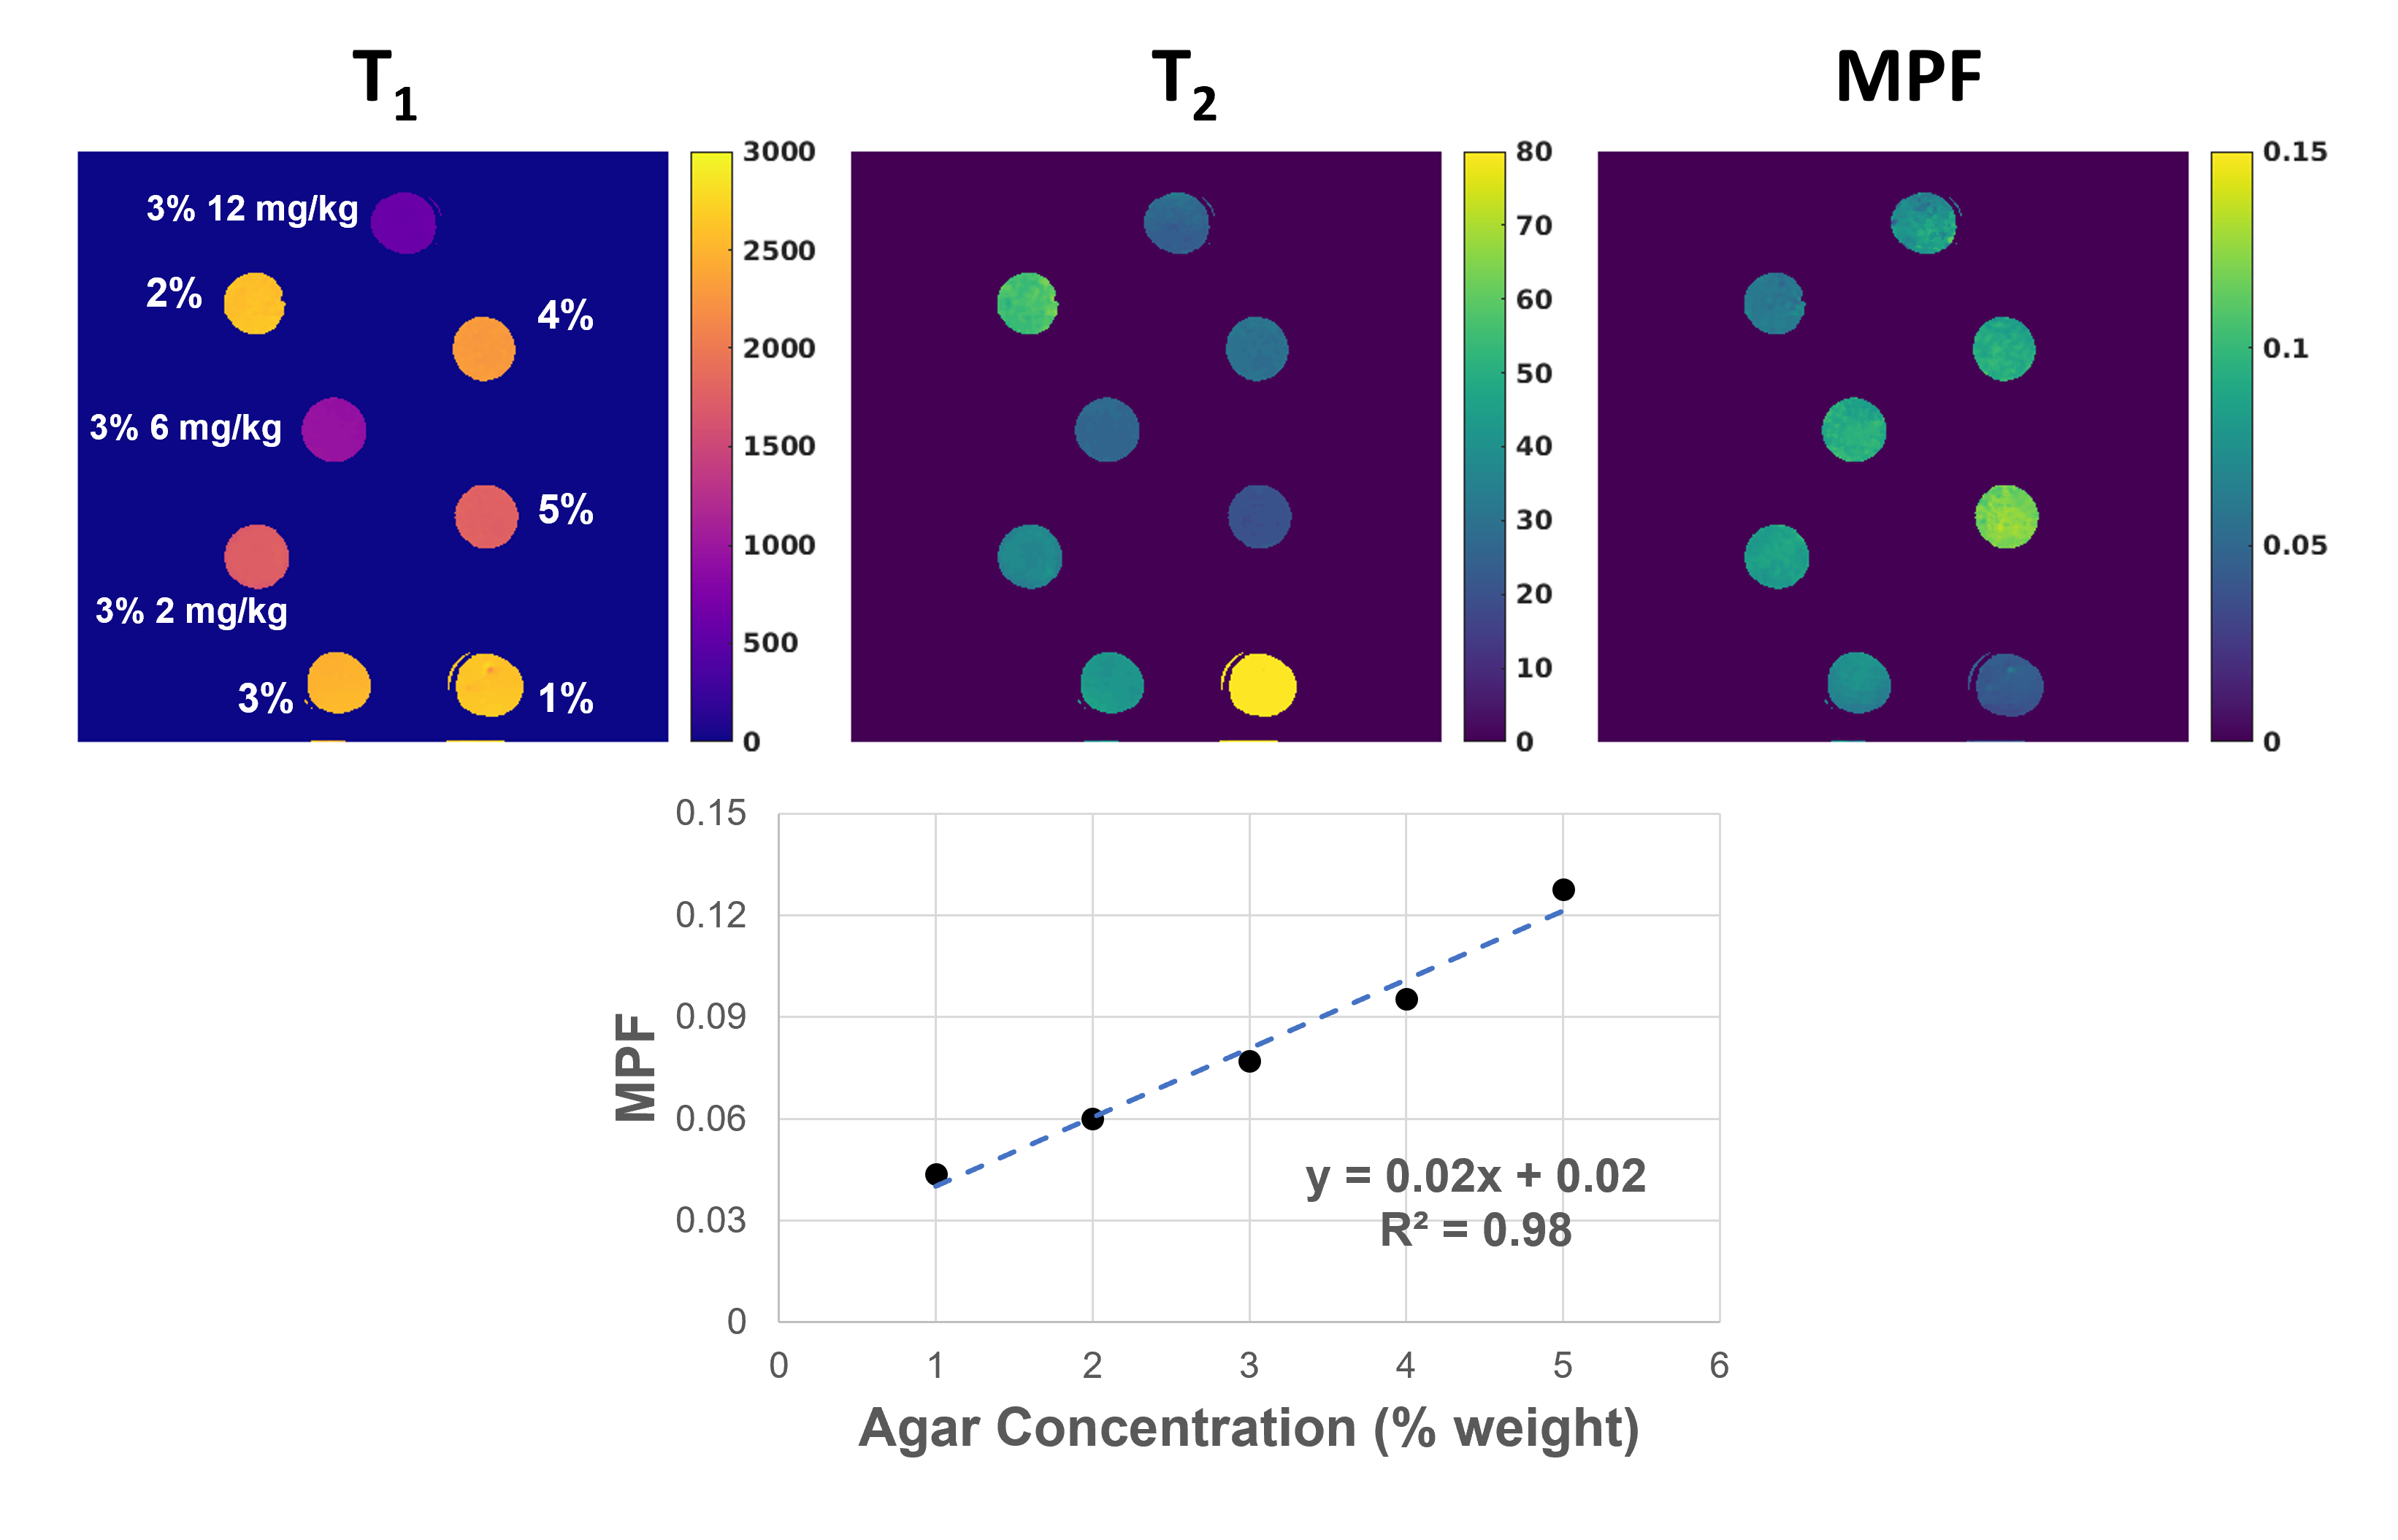
Phantom Validation: To demonstrate the feasibility of the proposed technique, agarose phantoms of various concentrations were created and scanned with the proposed sequence. Eight phantoms (1/2/3/4/5% agarose, and 3% agarose with 2/6/12mg/kg of ferumoxytol) were scanned in a 20-channel head coil on a Siemens 3T Prisma system. Mean values were obtained from the center 5x5 section of each phantom.
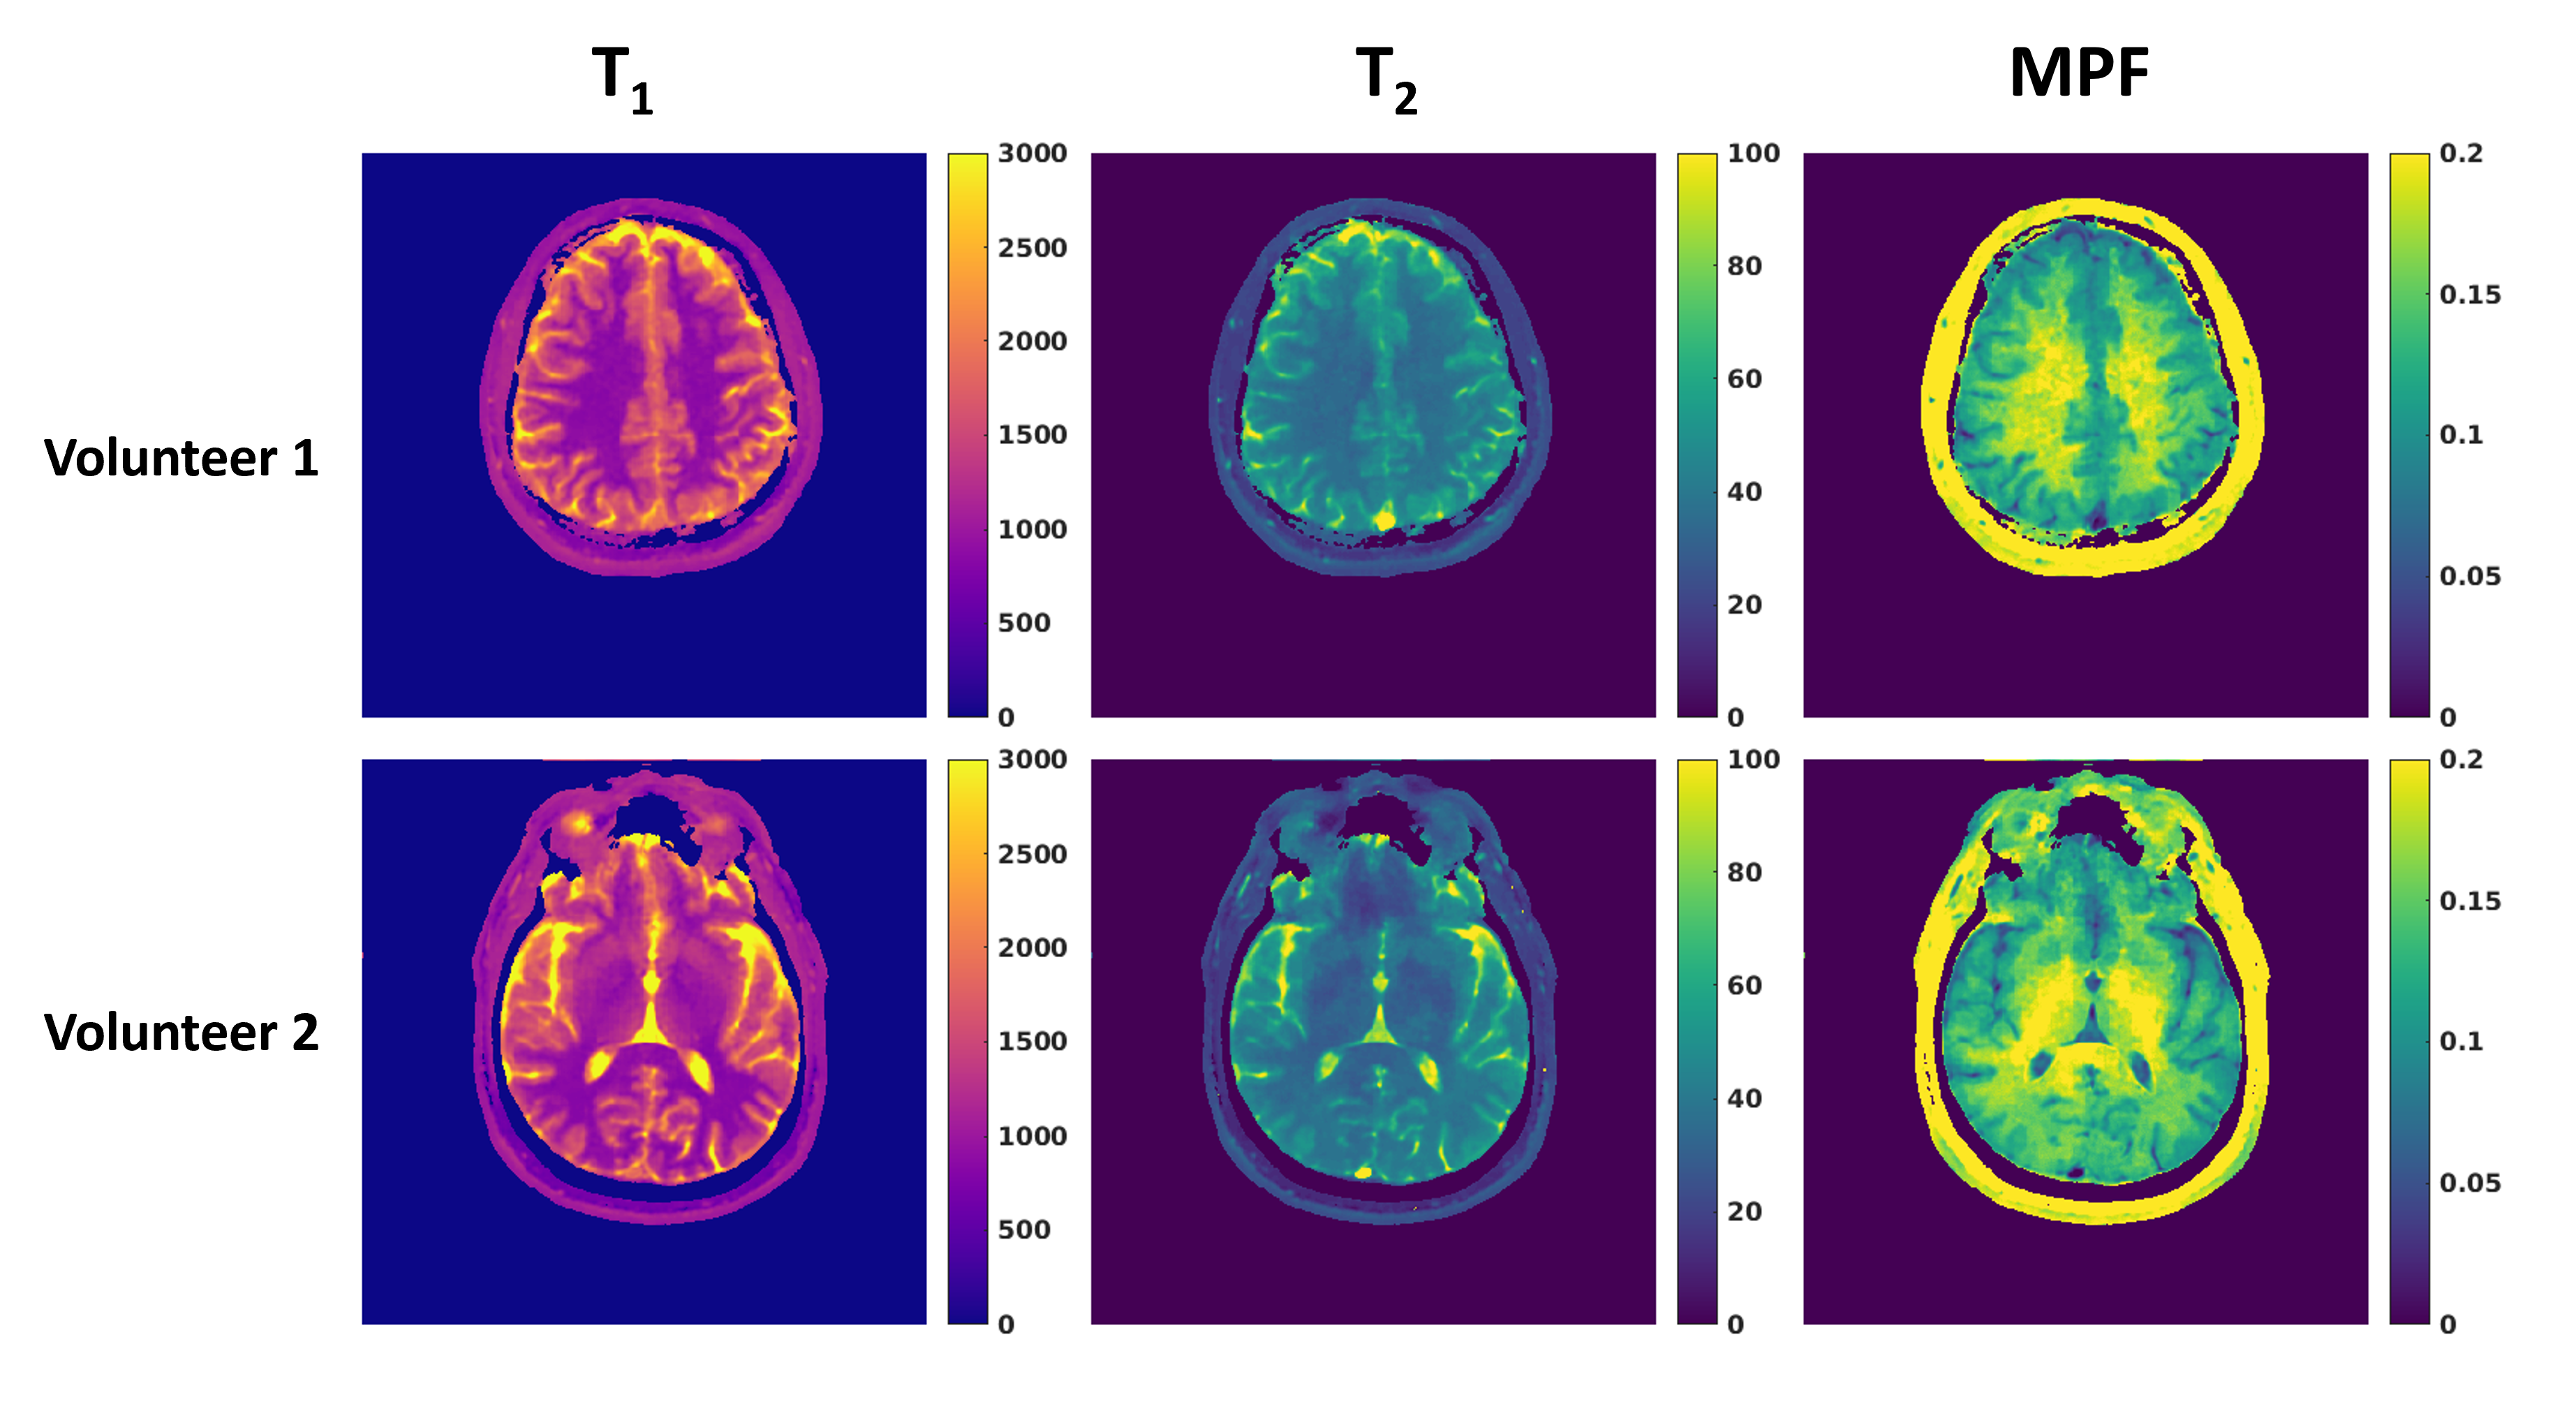
In Vivo Validation: Two healthy volunteers (22 and 68 year old males) were recruited under an IRB approved protocol and scanned on the 3T Siemens Prisma scanner with a 20-channel head coil.
Results
T1, T2, and MPF maps are shown for the phantom experiment in Figure 3. Additionally, a plot of MPF against agar concentration is shown in Figure 3. Example T1, T2, and MPF maps from the brain of each of the two volunteers are shown in Figure 4, demonstrating good image quality and the expected contrast for all 3 maps.Discussion
Lower T1 and T2 values are seen in phantoms as the agarose concentration increases, while the MPF values increase linearly with agarose concentration. Additionally, while the T1 and T2 vary substantially in the phantoms with ferumoxytol, the MPF is mostly constant for the same agarose concentration. In the brain, we see increased MPF values in WM compared to GM, along with very low values in the cerebral spinal fluid (CSF). There are some increased MPF values at the center of the brain in volunteer 2 that may be due to B1 inhomogeneity.Conclusion
This study demonstrates the effectiveness of using spin lock pulses for efficient saturation of off-resonant spins and allow for quick acquisition of MPF maps that are corrected for the T1 and T2 of the tissue. These maps could be used to assess macromolecular content in tissue, including in multiple sclerosis or fibrosis.Acknowledgements
Grant Support: This project was supported in part by a training fellowship from the Brenden-Colson Center for Pancreatic Care, NIDDK grant R01DK117459, and a young investigator grant from the American Pancreatic Association.References
1. Perlman, O., C.T. Farrar, and H.Y. Heo, MR fingerprinting for semisolid magnetization transfer and chemical exchange saturation transfer quantification. NMR Biomed, 2023. 36(6): p. e4710.
2. West, D.J., et al., An MR fingerprinting approach for quantitative inhomogeneous magnetization transfer imaging. Magn Reson Med, 2022. 87(1): p. 220-235.
3. Hilbert, T., et al., Magnetization transfer in magnetic resonance fingerprinting. Magn Reson Med, 2020. 84(1): p. 128-141.
4. Jin, T., et al., Spin-locking versus chemical exchange saturation transfer MRI for investigating chemical exchange process between water and labile metabolite protons. Magn Reson Med, 2011. 65(5): p. 1448-60.
5. Hou, J., et al., Macromolecular proton fraction mapping based on spin-lock magnetic resonance imaging. Magn Reson Med, 2020. 84(6): p. 3157-3171.
6. Witschey, W.R., et al., Compensation for spin-lock artifacts using an off-resonance rotary echo in T1rhooff-weighted imaging. Magn Reson Med, 2007. 57(1): p. 2-7.
7. Zaiss, M., et al., A combined analytical solution for chemical exchange saturation transfer and semi-solid magnetization transfer. NMR Biomed, 2015. 28(2): p. 217-30.
8. Yarnykh, V.L., E.V. Tartaglione, and G.N. Ioannou, Fast macromolecular proton fraction mapping of the human liver in vivo for quantitative assessment of hepatic fibrosis. NMR Biomed, 2015. 28(12): p. 1716-25.
9. Uecker M, O.F., Tamir J, Bahri D, Virtue P, Cheng J, Zhang T, Lustig M., Berkeley advanced reconstruction toolbox, in Proceedings of the 23rd annual meeting of ISMRM. 2015: Toronto. p. p. 2486.
Figures