3550
Feasibility of Knee MR Fingerprinting at 0.55T and comparison with 3.0T MAPSS: Hip-OA cohort with probable early knee cartilage-loss1Department of Radiology & Biomedical Imaging, University of California, San Francisco (UCSF), San Francisco, CA, United States, 2Department of Radiology, Stanford University, Stanford, CA, United States, 3Department of Electrical Engineering, Stanford University, Stanford, CA, United States
Synopsis
Keywords: MR Fingerprinting, Low-Field MRI
Motivation: Low-cost 0.55T-scanners pose an excellent opportunity to formulate efficient, fast, and quantitative T2 mapping methods that could enhance the reach of early OA-diagnosis.
Goal(s): To analyze the feasibility of a novel, fast, and high-resolution MRF-scanning technique to quantify knee cartilage-T2 overcoming the low SNR and inefficient gradient systems at 0.55T and compare against the MAPSS approach at 3.0T.
Approach: A suite of techniques was leveraged for MRF, including an optimized-sampling-trajectory, subspace-reconstruction, locally-low-rank-constraint, gradient-waveform-correction, Cramer-Rao-Lower-Bound (CRLB)-optimization for flip-angle-patterns, motion-correction, and deep-learning-based-denoising.
Results: The average T2 increase at 0.55T compared to 3.0T provides a wider range for the depiction of granular regions of elevated cartilage-T2
Impact: In this study, advanced techniques including CRLB-optimization, gradient trajectory correction, subspace reconstruction, attention-based denoising, and motion correction were included to demonstrate the feasibility and benefits of a faster, higher-resolution Knee MRF acquisition on a cost-effective 0.55T scanner compare with 3.0T MAPSS.
Introduction
Relaxation mapping at 3.0T, especially T2, is considered a well-established biomarker to depict early cartilage degenerative changes caused by losses in the collagen matrix of the knee, in probable cases of Osteoarthritis (OA)(1). However, high-resolution quantitative T2 mapping is often time-consuming, suffers from longer patient wait times, and requires complex acquisition processes(2). Low-cost 0.55T scanners(3) would therefore pose an excellent opportunity to formulate efficient, fast, and quantitative T2 mapping methods that could enhance the reach of early OA diagnosis to a wider population, spread far across locations. MR-Fingerprinting (MRF)(4) could be particularly beneficial due to its capability to acquire multiple contrasts (T2, T1, Proton Density) at the same time. In this study, we analyzed the feasibility of a novel, fast, and high-resolution MRF scanning technique to quantify knee cartilage T2 overcoming the low signal-to-noise-ratio (SNR) and inefficient gradient systems at 0.55T. The T2 values were compared against the well-established MAPSS approach at 3.0T. A cohort of patients with radiographic Hip-OA subjects was chosen for knee scans, as a probable early cartilage-loss group of candidates(5).Methods
Subjects: In this prospective study approved by the local Institutional Review Board (IRB), seven knees of five Hip-OA subjects (Age: 64.2 ± 13.71 years, BMI: 22.72 ± 1.55, 1 female, Hip Kellgren-Lawrence/KL scores(6) >=2), were included with no clinically diagnosed knee OA. The subjects provided written informed consents and underwent two consecutive MRI scans on a 3.0T (Signa Premier, GE Healthcare, Waukesha, WI, USA) and a 0.55T (MAGNETOM Free.Max, Siemens Healthineers, Erlangen, Germany) with an hour of rest in between.MRI Acquisition:
MRF at 0.55T: To overcome the lower gradient strength of 0.55T scanner and to achieve higher isotropic resolution and faster scans, a suite of techniques were leveraged, including an optimized sampling trajectory, subspace reconstruction (7, 8), locally low-rank constraint(9), gradient waveform correction(10), Cramer-Rao-Lower-Bound (CRLB) optimization for flip angle patterns(11), motion correction, and deep learning-based denoising (12)(13). Further details are provided in Figure-1. Multiple acquisition groups are acquired to carry out different spiral encodings, thereby populating the 3D k-space via a tiny-golden-angle-shuffling scheme. The TR and TE are consistently maintained at 12.5 ms and 0.6 ms, respectively. A specially tailored tiny-golden-angle-shuffling 3D spiral trajectory was designed to deliver 0.8 mm isotropic resolution and a FOV of 160x160 mm2 for detailed knee examinations. Both the gradient delay and actual gradient trajectory were measured and utilized in the image reconstruction process. A subspace reconstruction with LLR constraints and motion correction was implemented. The reconstructed coefficient maps are put into an attention-based deep learning network ST-CNNT (spatial-temporal CNN transformers) is employed for denoising and boosting SNR. T1, T2, and PD relaxation maps are generated. Three major cartilage compartments (Femur, Tibia, Patella) are marked by an experienced musculoskeletal researcher to extract compartment-wise T2 values.
MAPSS at 3.0T: A Magnetization-Prepared Angle-Modulated Partitioned-k-Space Spoiled-Gradient-Echo-Snapshots (MAPSS) was acquired(14). The T2 maps were obtained by fitting multiple TSLs and TEs corresponding to the images by Levenberg–Marquardt mono-exponential equation(5). Three major cartilage compartments (Femur, Tibia, Patella) were segmented using a pre-validated 3D V-Net architecture field (15), from the morphological images. Compartment-wise cartilage T2 relaxation values were extracted from the co-registered T2 maps with the DL segmented masks using a pre-validated approach(5). All image analyses were performed using an in-house program developed in MATLAB (version R2021a, The MathWorks Inc., Natick, MA, USA). All statistical analyses have been performed using RStudio (version 12.0+353; https://www.r-project.org/).
Results and Discussion
Mean T2 relaxation values with Standard Errors (SE), and the percentage increases from 3.0T MAPSS to 0.55T MRF for the three major compartments (Femoral, Tibial, and Patellar cartilage) are summarized in Figure-2. Bland-Altman plots in Figure-3, show T2 relaxation values estimated by the MRF approaches at 0.55T are within agreeable limits for all the cartilage compartments compared to 3.0T MAPSS. T1 and T2 maps from MRF at 0.55T for a healthy reference control and a hip-OA subject (probable knee-OA) are displayed in Figure-4. Elevated T2 in certain regions of cartilage can often be indicative of degenerative changes even before morphological degradation, as assessed via KL scores(6), has been manifested at all. The average T2 increase at 0.55T compared to 3.0T provides a wider range for the depiction of such granular regions, as seen in Figure-5.Conclusion
In this study, advanced techniques including CRLB optimization, gradient trajectory correction, subspace reconstruction, attention-based denoising, and motion correction were included to demonstrate the feasibility and benefits of a faster, higher-resolution Knee MRF acquisition on a cost-effective 0.55T scanner and compare with 3.0T MAPSS.Acknowledgements
This work was supported by: NIH research grants: R01EB020613, R01MH116173, R01EB019437, R01EB028797, R01EB016695, U01EB025162, P41EB030006, U01EB026996, R03EB031175 and UCSF Departmental Seed Grant.
References
1. Dunn TC, Lu Y, Jin H, Ries MD, Majumdar S: T2 relaxation time of cartilage at MR imaging: Comparison with severity of knee osteoarthritis. Radiology 2004; 232:592–598.
2. Li X, Han ET, Busse RF, Majumdar S: In vivo T 1ρ mapping in cartilage using 3D magnetization‐prepared angle‐modulated partitioned k ‐space spoiled gradient echo snapshots (3D MAPSS). Magn Reson Med 2008; 59:298–307.
3. Lopez Schmidt I, Haag N, Shahzadi I, et al.: Diagnostic Image Quality of a Low-Field (0.55T) Knee MRI Protocol Using Deep Learning Image Reconstruction Compared with a Standard (1.5T) Knee MRI Protocol. J Clin Med 2023; 12:1916.
4. Ma D, Gulani V, Seiberlich N, et al.: Magnetic Resonance Fingerprinting. Nature 2013; 495:187–192.
5. Bhattacharjee R, Thahakoya R, Luitjens J, et al.: Effects of T1p Characteristics of Load-Bearing Hip Cartilage on Bilateral Knee Patellar Cartilage Subregions: Subjects With None to Moderate Radiographic Hip Osteoarthritis. J Magn Reson Imaging JMRI 2023.
6. Kellgren JH, Lawrence JS: Radiological assessment of osteo-arthrosis. Ann Rheum Dis 1957; 16:494–502.
7. Cao X, Wang K, Liao C, et al.: Efficient T2 mapping with Blip-up/down EPI and gSlider-SMS (T2-BUDA-gSlider). Magn Reson Med 2021; 86:2064–2075.
8. Tamir JI, Uecker M, Chen W, et al.: T2 shuffling: Sharp, multicontrast, volumetric fast spin-echo imaging. Magn Reson Med 2017; 77:180–195.
9. Lima da Cruz G, Bustin A, Jaubert O, Schneider T, Botnar RM, Prieto C: Sparsity and locally low rank regularization for MR fingerprinting. Magn Reson Med 2019; 81:3530–3543.
10. Estimation of k-space trajectories in spiral MRI - PubMed [https://pubmed.ncbi.nlm.nih.gov/19353671/]
11. Lee PK, Watkins LE, Anderson TI, Buonincontri G, Hargreaves BA: Flexible and efficient optimization of quantitative sequences using automatic differentiation of Bloch simulations. Magn Reson Med 2019; 82:1438–1451.
12. Jiang Y, Ma D, Seiberlich N, Gulani V, Griswold MA: MR fingerprinting using fast imaging with steady state precession (FISP) with spiral readout. Magn Reson Med 2015; 74:1621–1631.
13. Cao X, Liao C, Iyer SS, et al.: Optimized multi-axis spiral projection MR fingerprinting with subspace reconstruction for rapid whole-brain high-isotropic-resolution quantitative imaging. Magn Reson Med 2022; 88:133–150.
14. Li X, Han ET, Busse RF, Majumdar S: In vivo T(1rho) mapping in cartilage using 3D magnetization-prepared angle-modulated partitioned k-space spoiled gradient echo snapshots (3D MAPSS). Magn Reson Med 2008; 59:298–307.
15. Astuto B, Flament I, Namiri NK, et al.: Automatic deep learning–assisted detection and grading of abnormalities in knee MRI studies. Radiol Artif Intell 2021; 3.
Figures
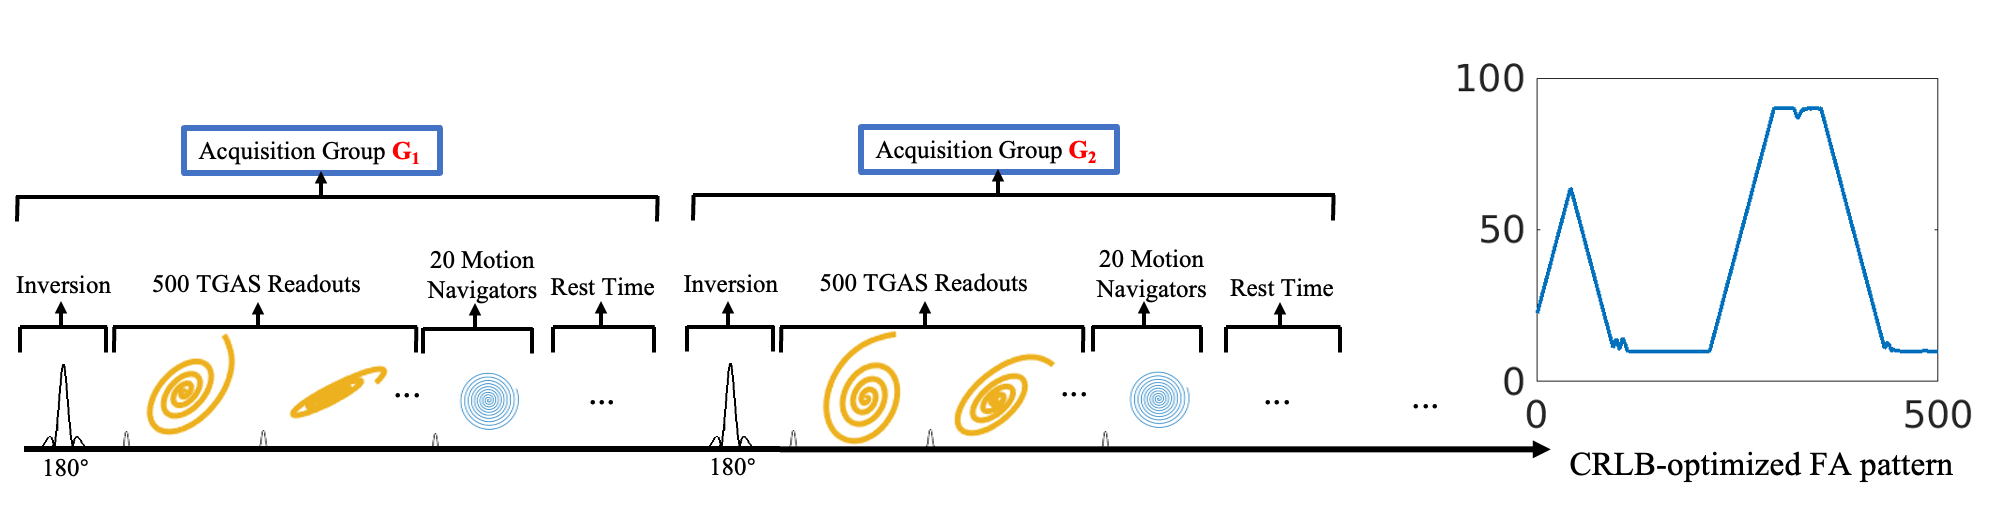
Figure-1: A unilateral FISP-based MRF sequence was acquired with a TR of 500 ms with varying FA ranging from 10 to 90 degrees with a non-selective hard pulse, prepared through an adiabatic inversion pulse with TI of 20 ms. Following the completion of the 500 TRs acquisition, a rest interval of 1.2 seconds is implemented to allow for the signal recovery before the initialization of the subsequent acquisition. Each of these acquisitions, constituting 500 TRs with FISP readout, adiabatic recovery pulse, and rest interval, is designated as an “acquisition group”.
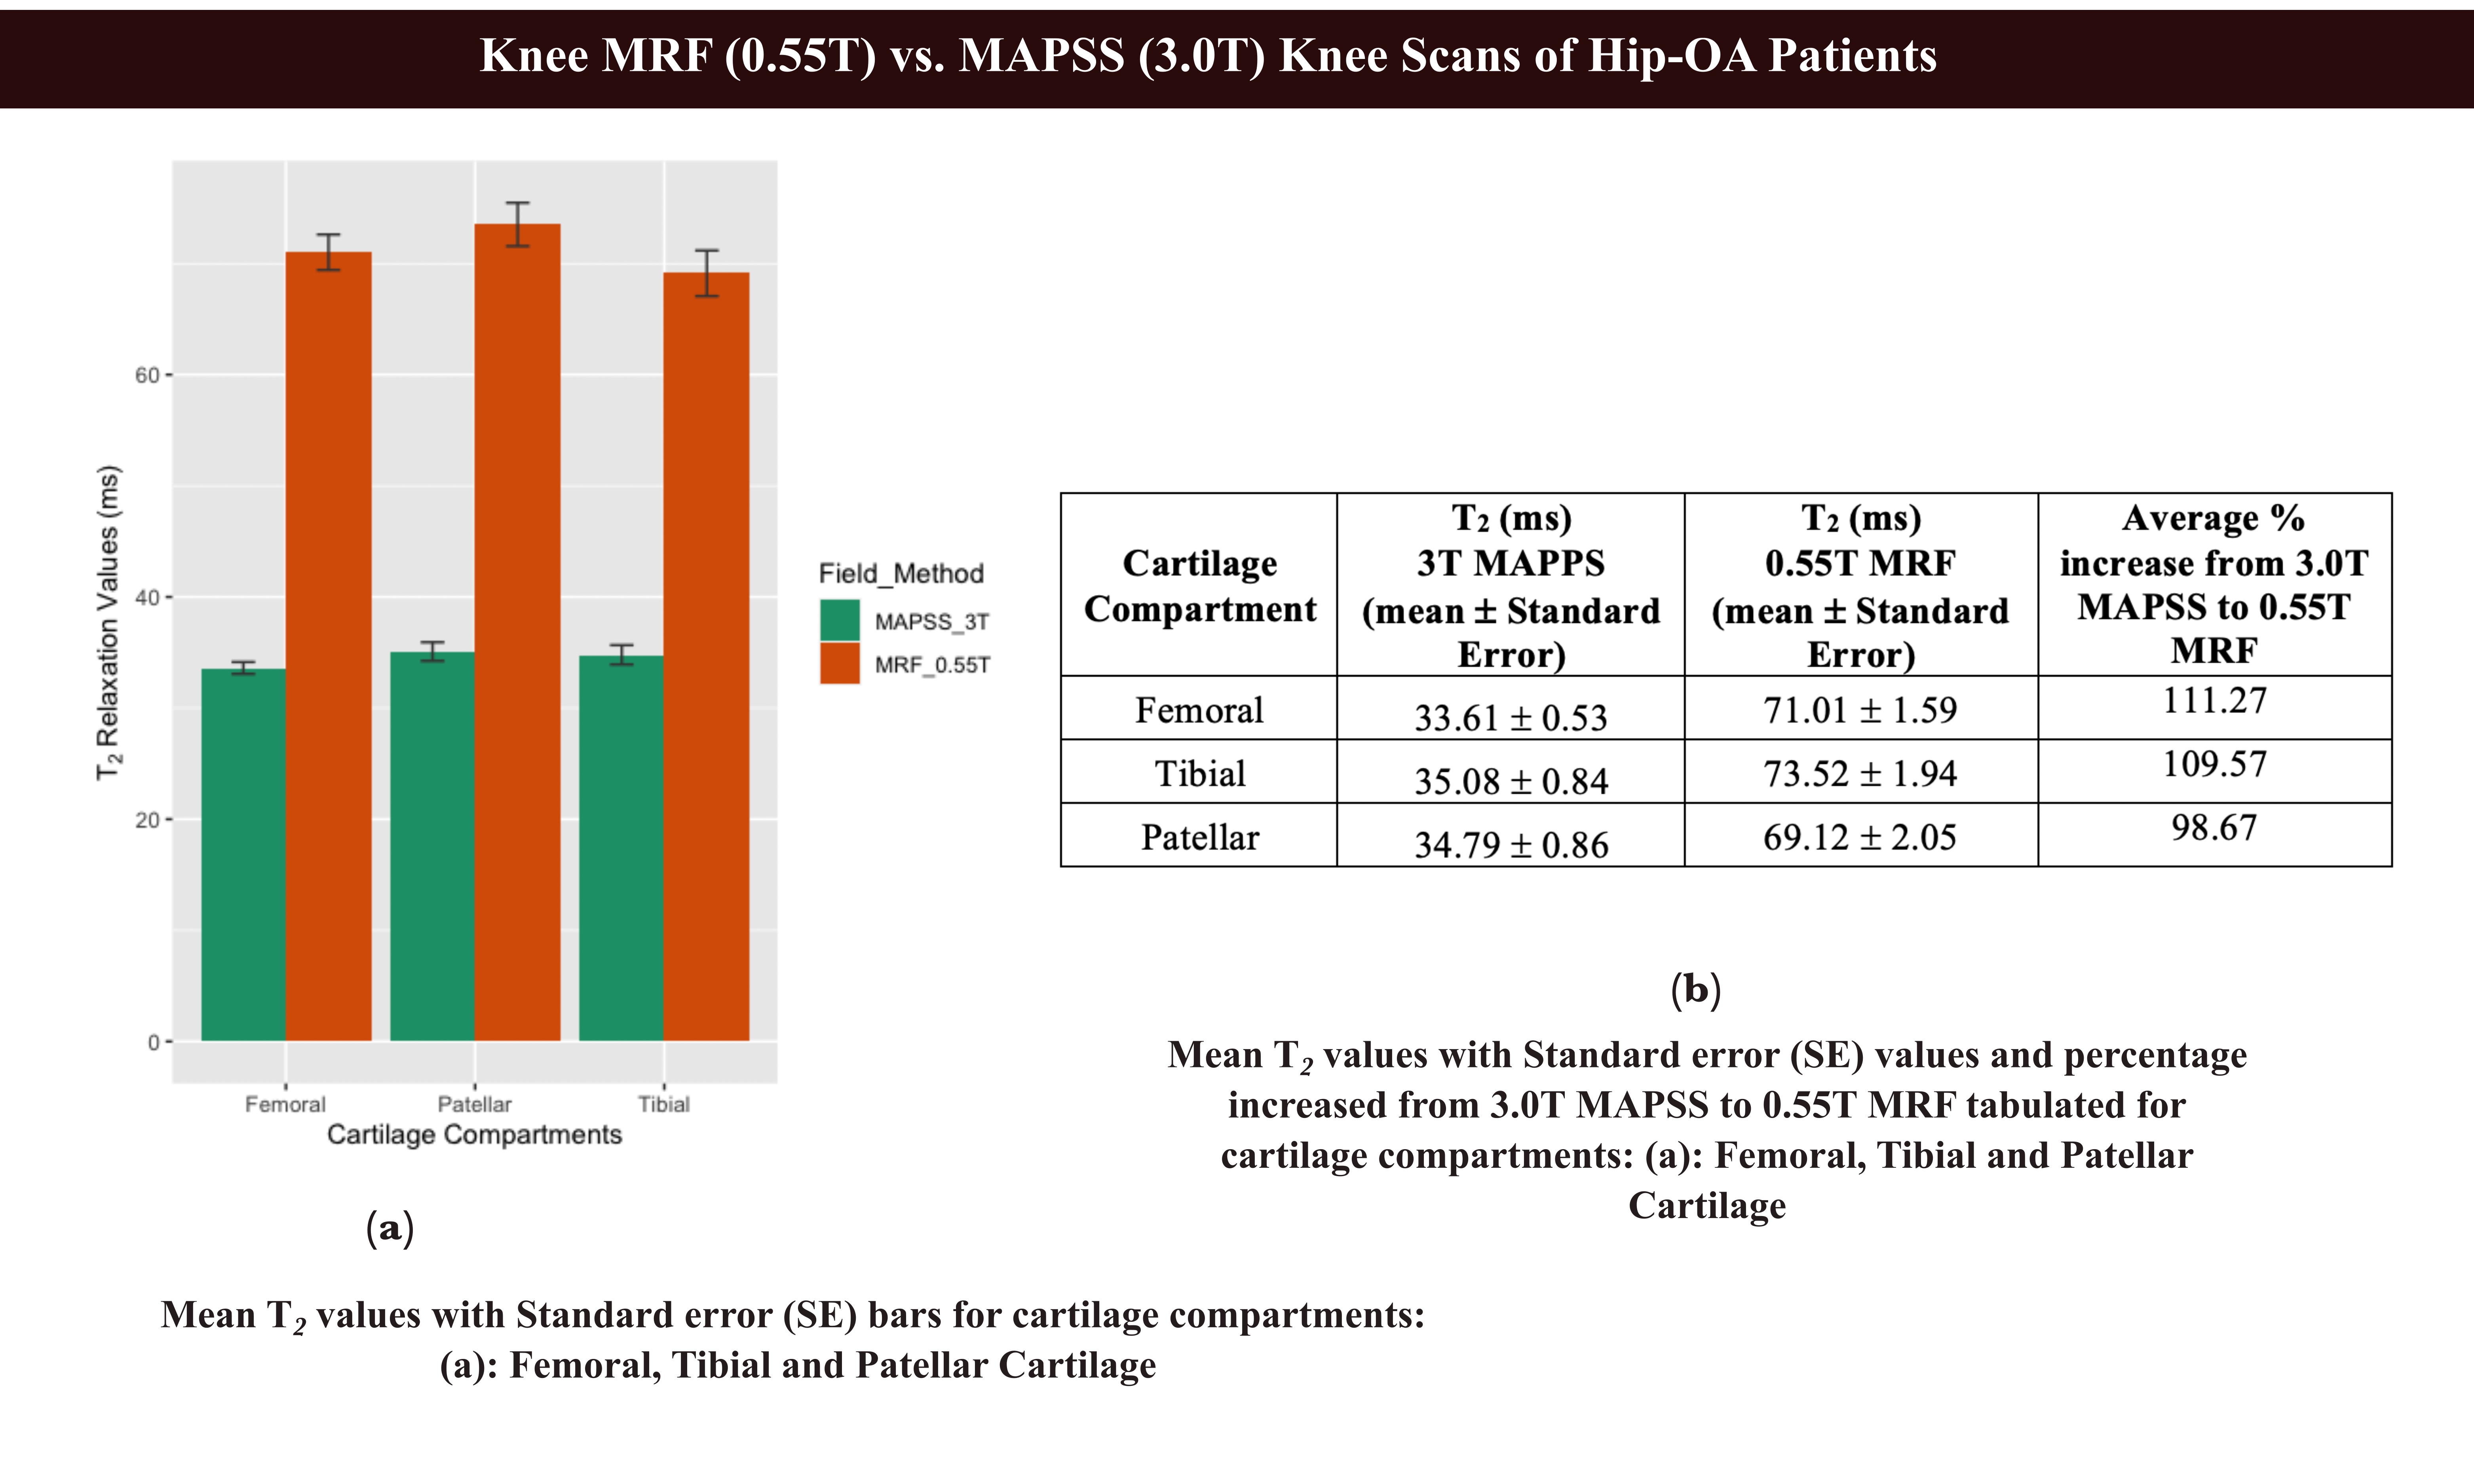
Figure-2: (a): Bar plots and (b) Summarized values of Mean T2 with Standard Error (SE) for three major cartilages (Femoral, Tibial, Patellar) at 3.0T MAPSS and 0.55T MRF.
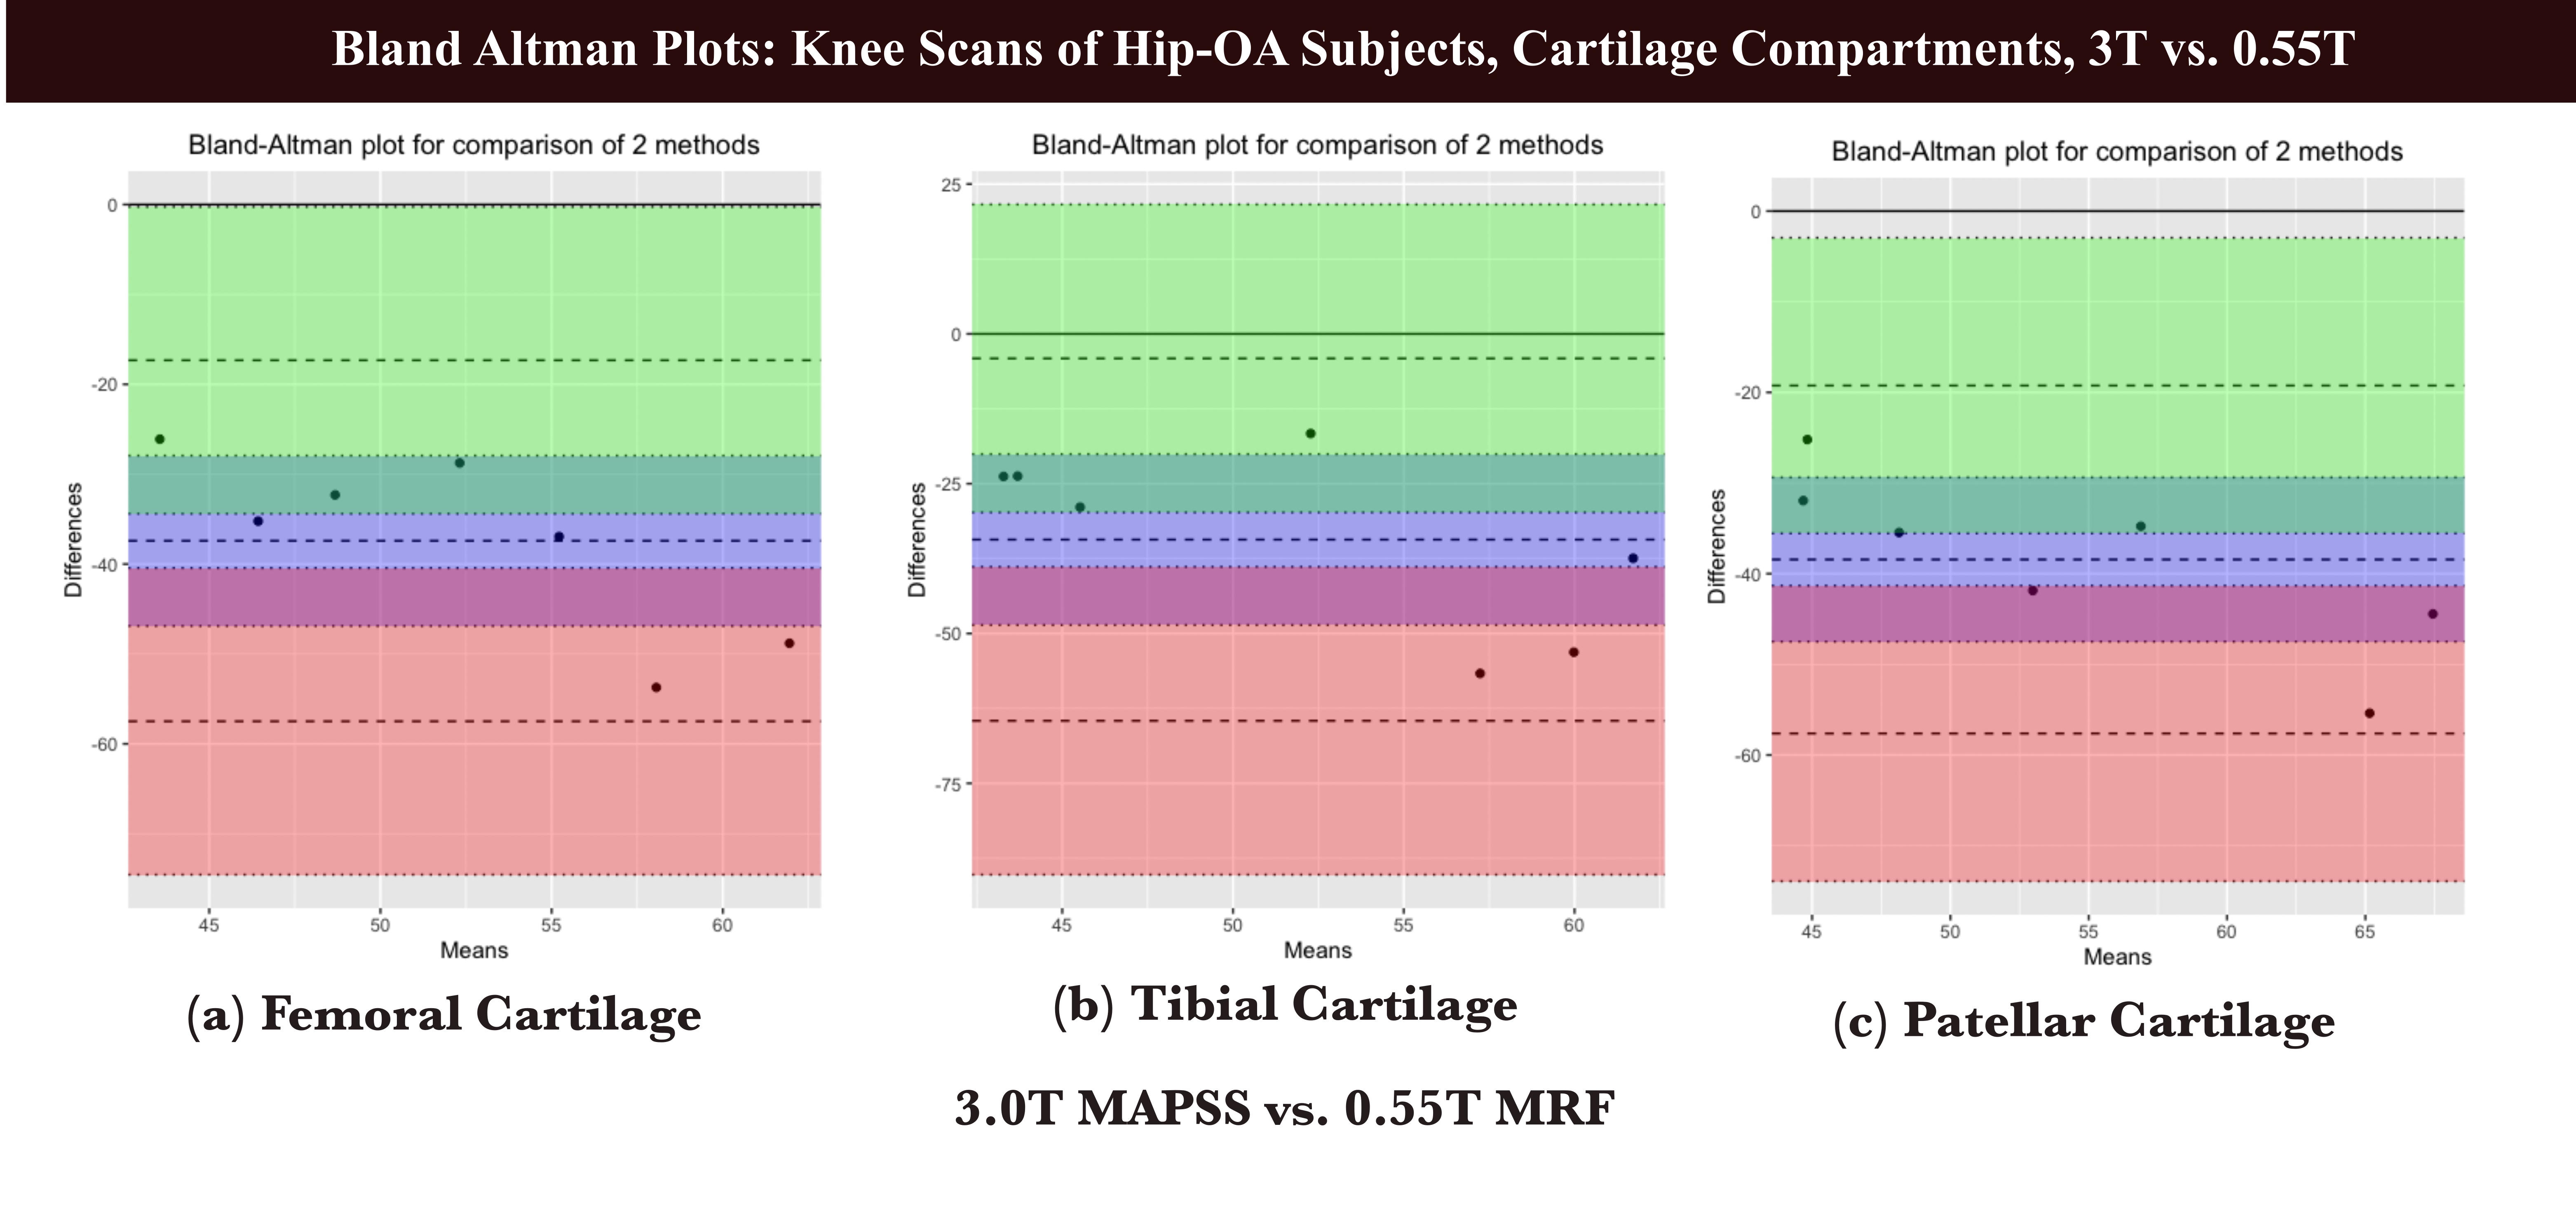
Figure-3: Bland-Altman plots between 3.0T MAPSS vs. 0.55T MRF T2 values for (a) Femoral, (b) Tibial, and (c) Patellar cartilage.
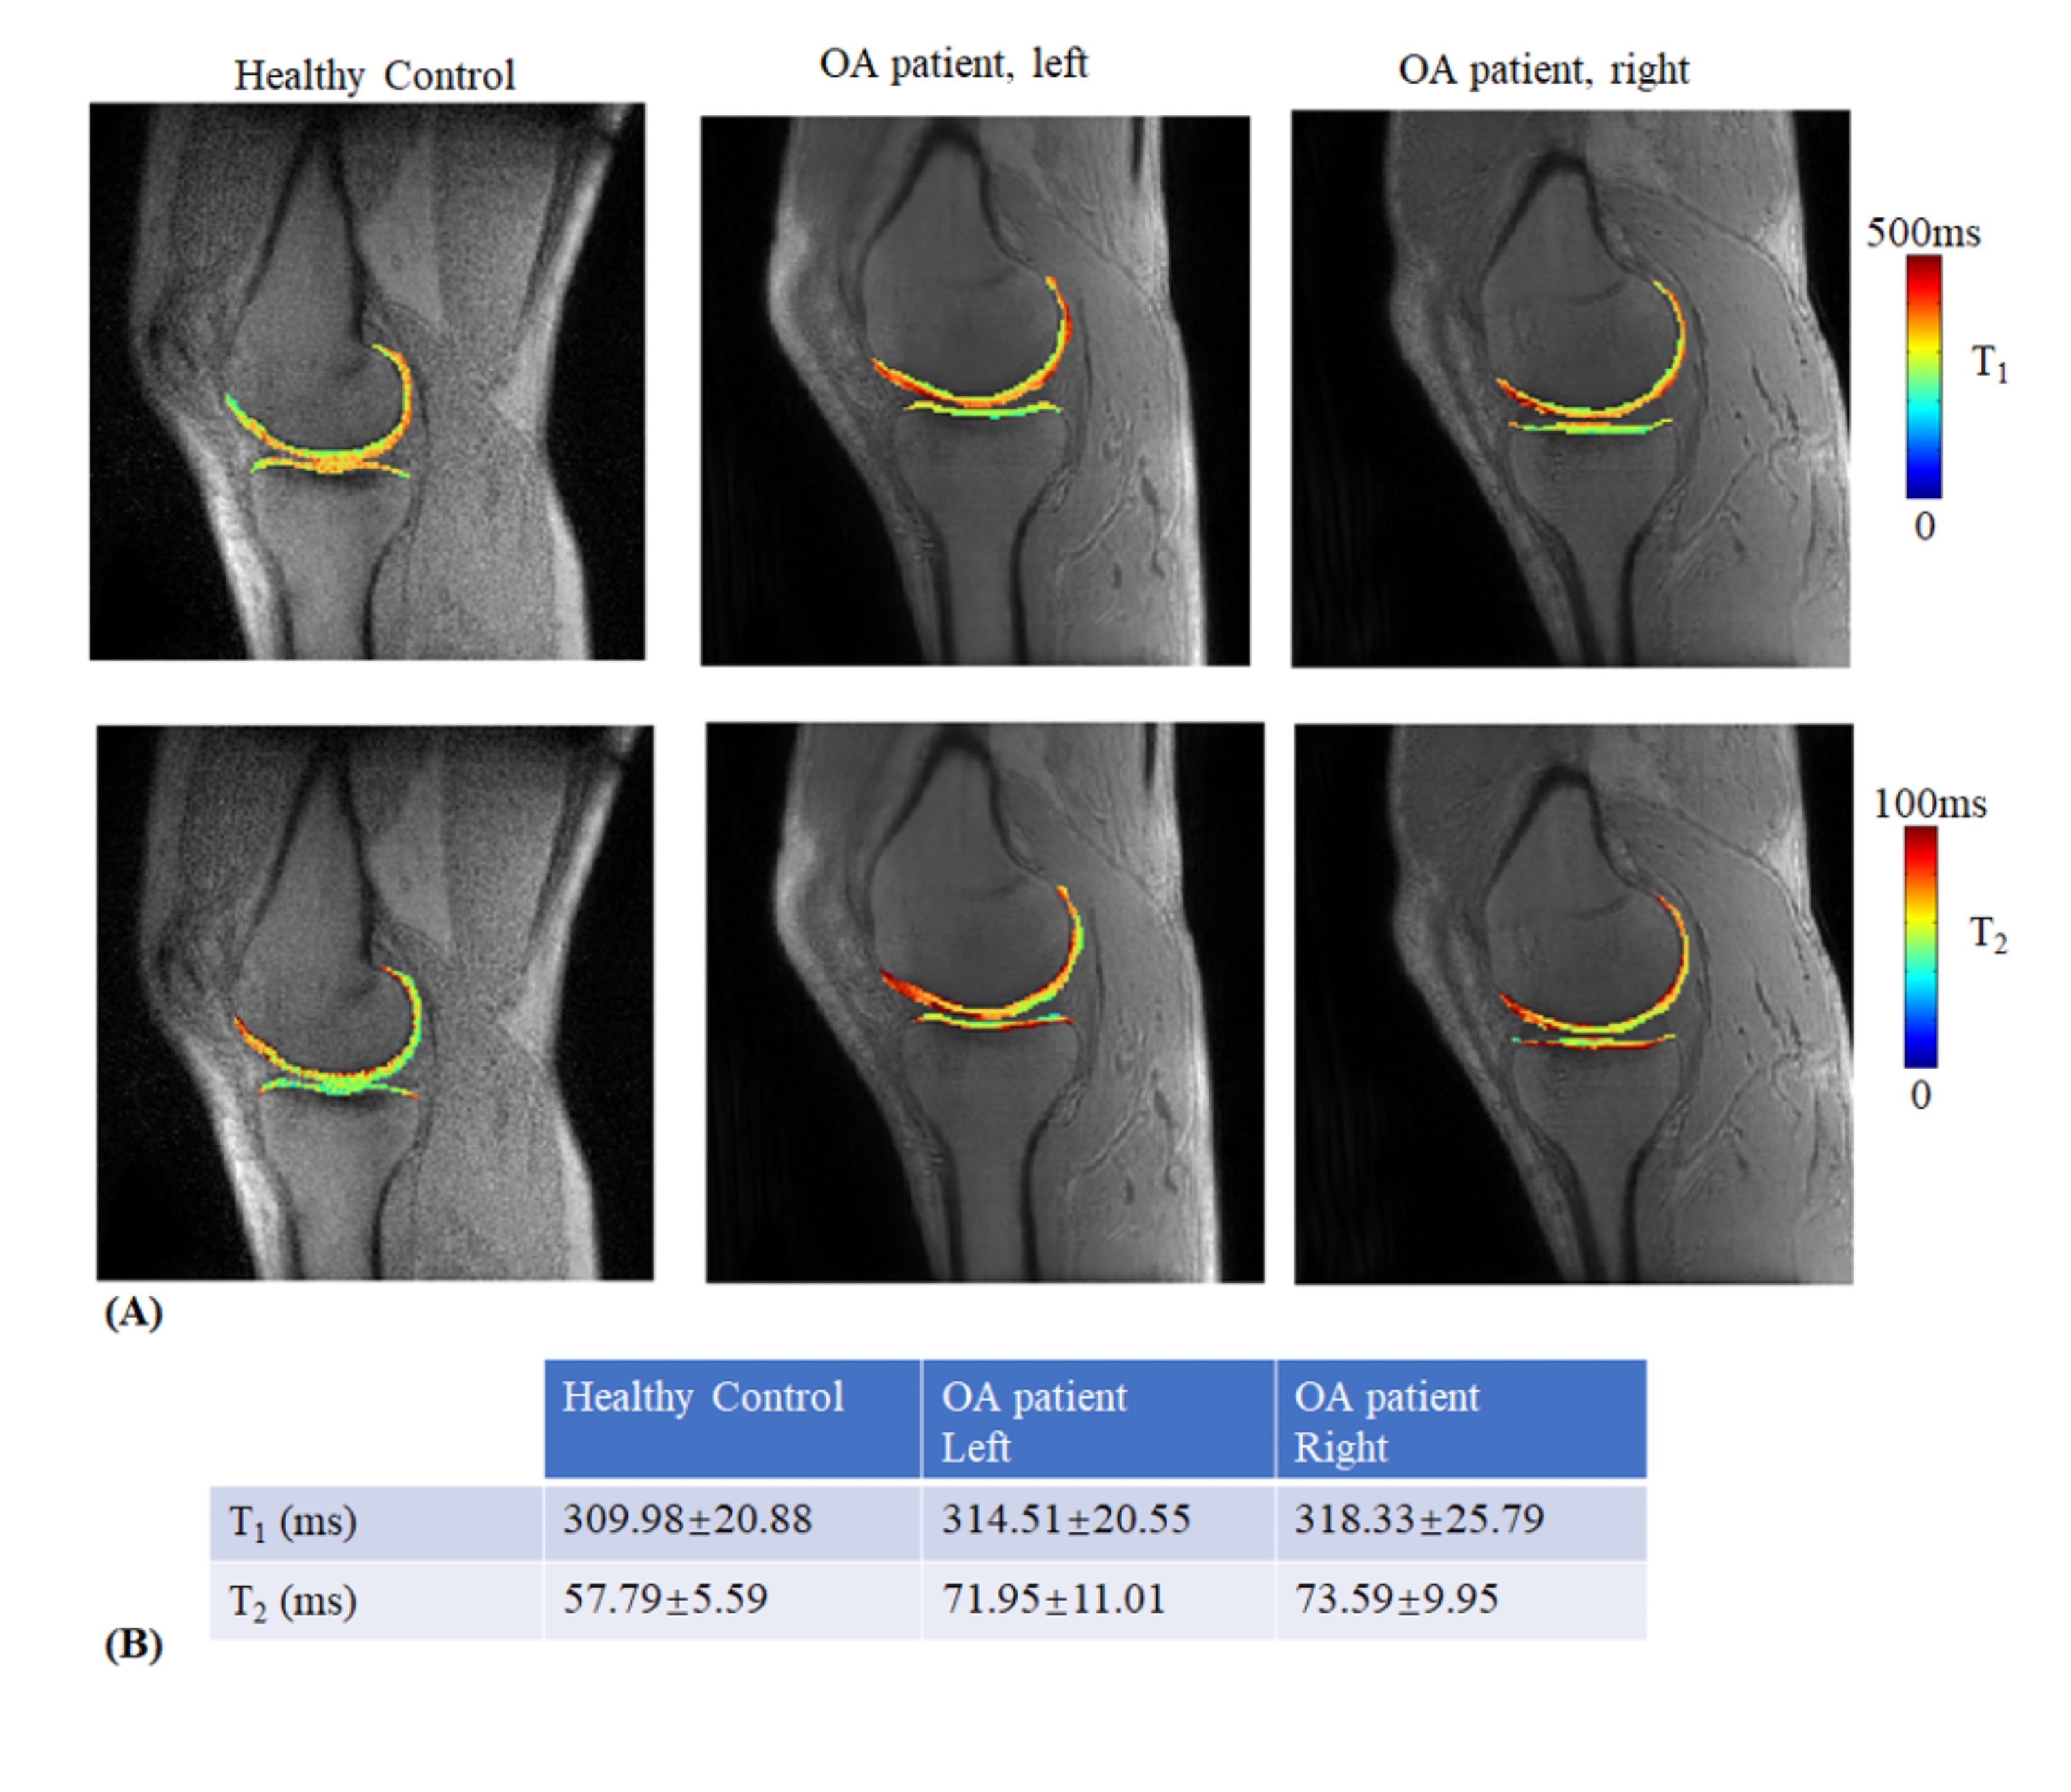
Figure-4: (A) T1 and T2 maps using the proposed MRF sequence of a healthy volunteer (1st column) and a hip-OA patient (2nd column for the left knee and the 3rd column for the right knee). (B) The T1 and T2 average values and standard deviations of the whole knee cartilage.
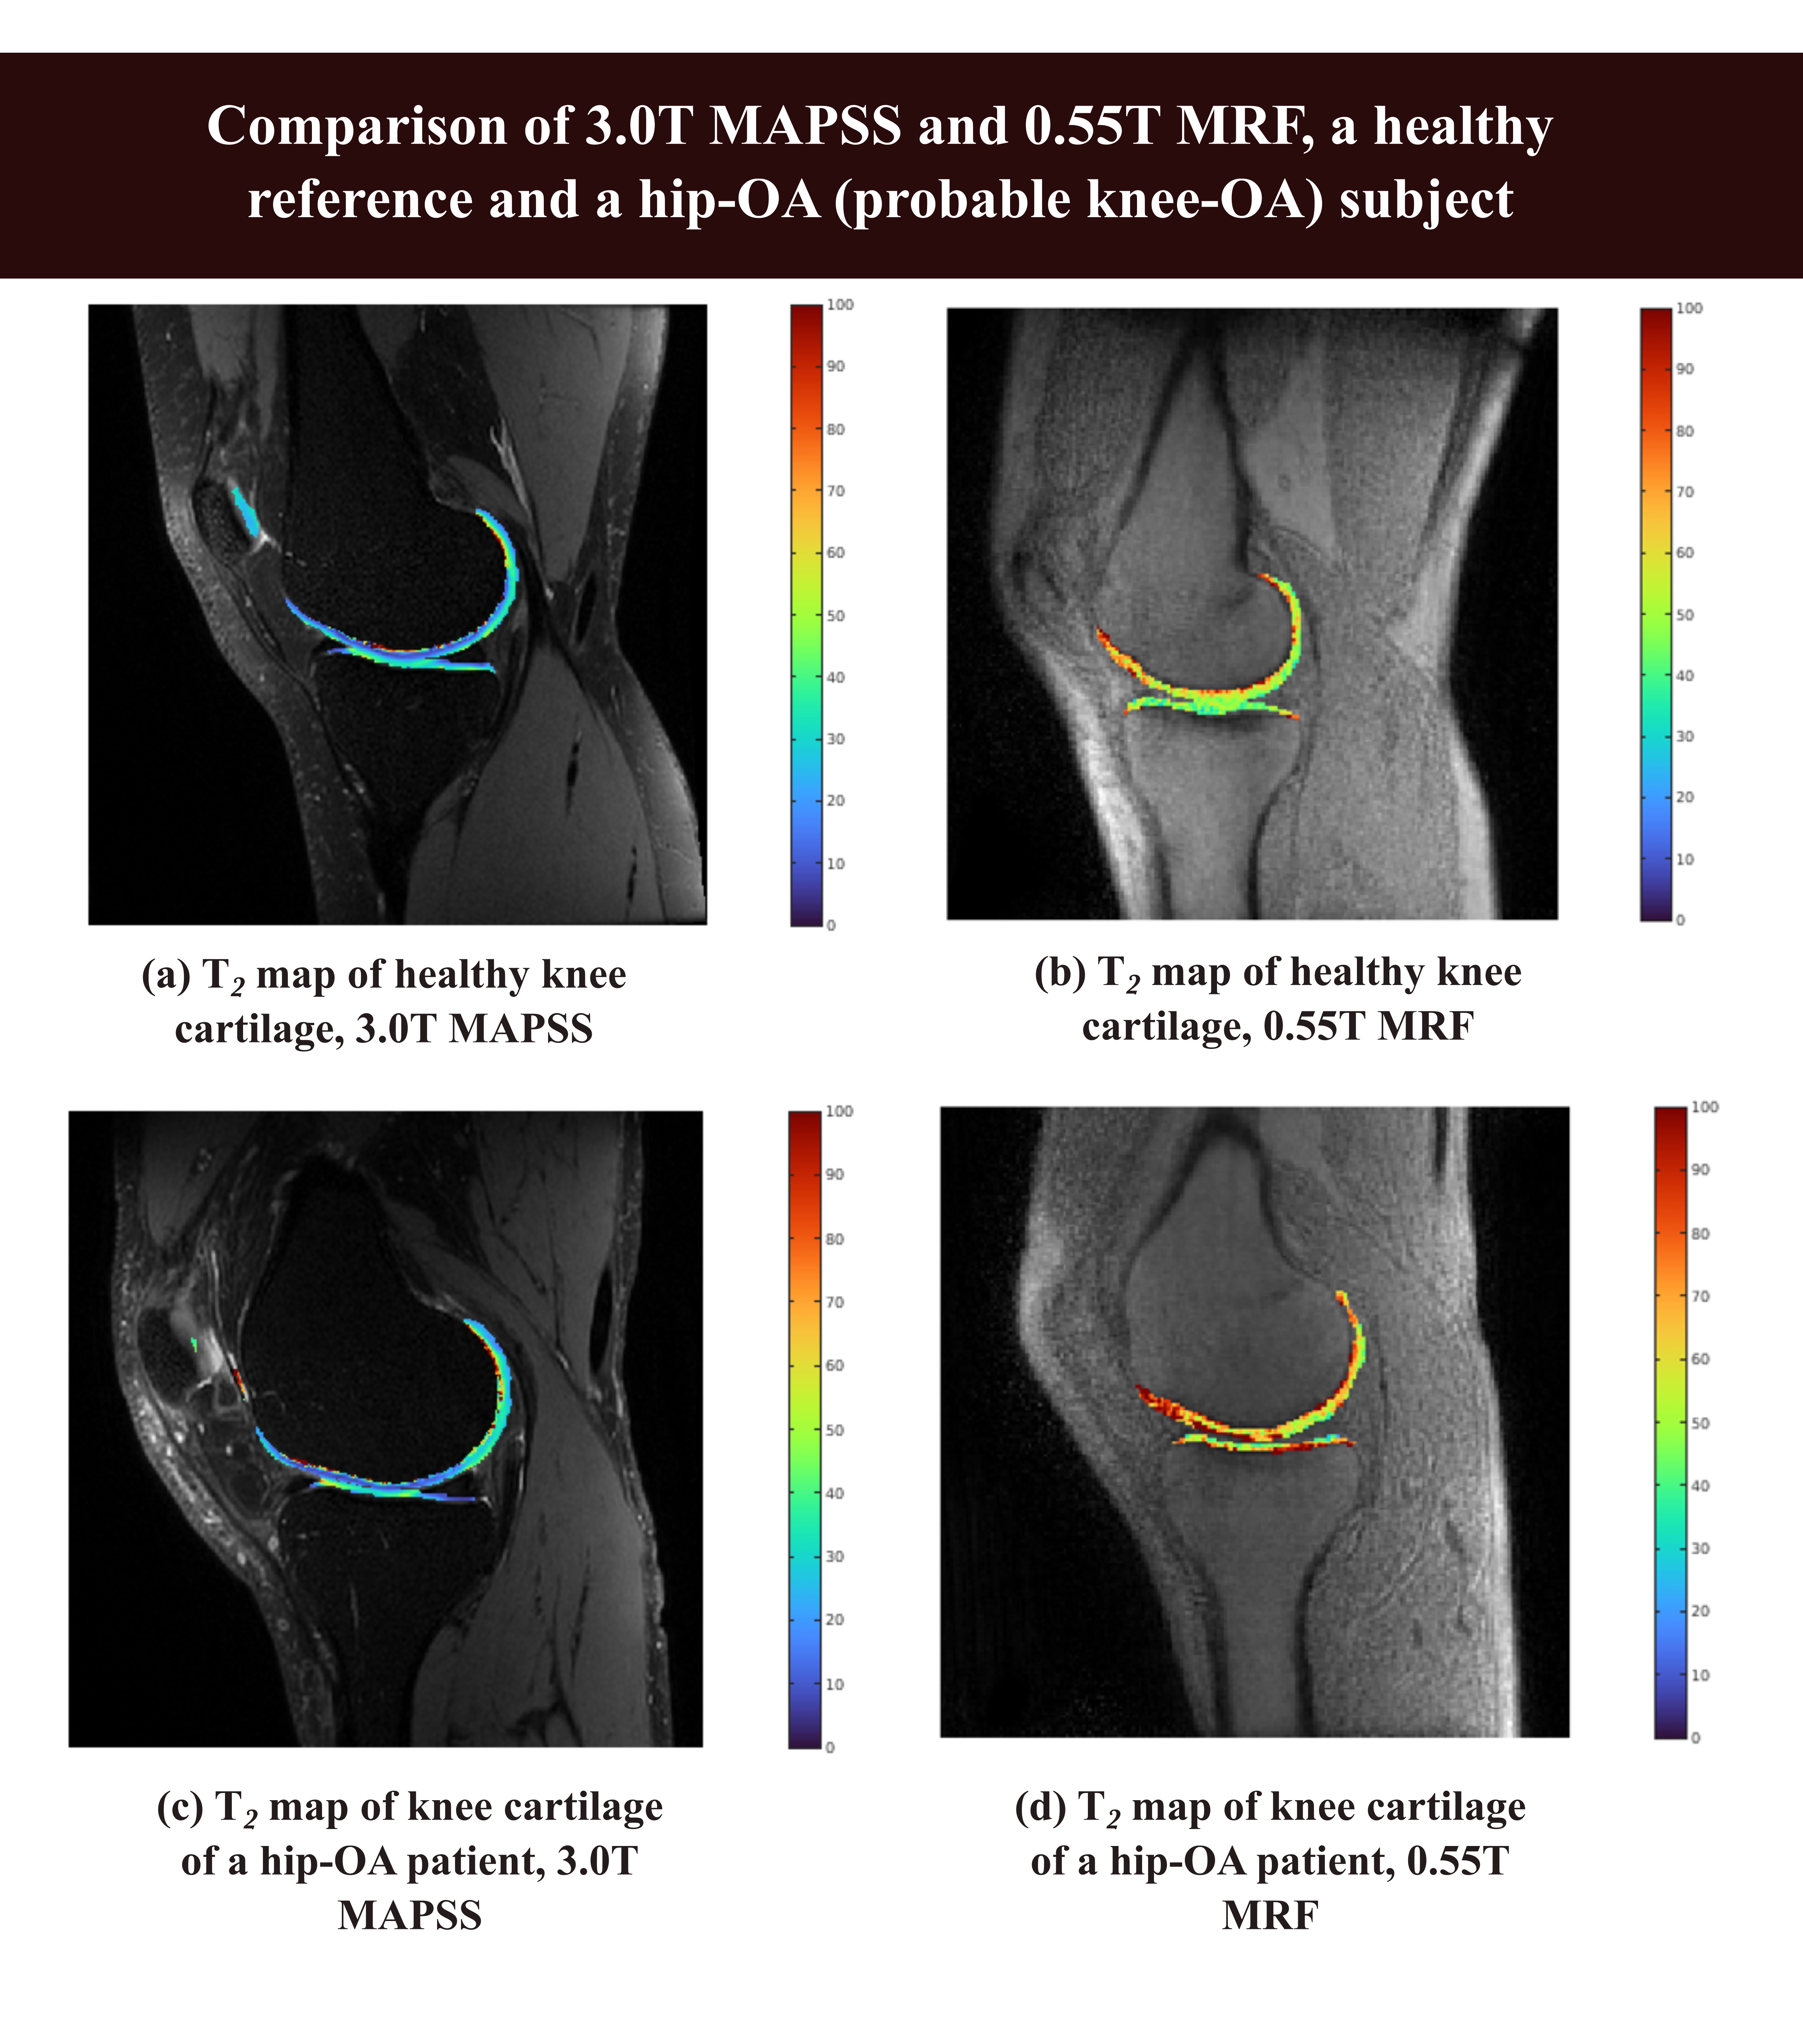
Figure-5: Benefits of T2 mapping at 0.55T over 3.0T, a wider range of granular change depiction. Smaller regions of elevated T2 are seen in the 0.55T MRF T2 maps but are subsided in the 3.0T T2 map.