3548
Preparation Scheme Optimization for Abdominal MRF1Department of Biomedical Engineering, University of Michigan, Ann Arbor, MI, United States, 2Department of Radiology, University of Michigan, Ann Arbor, MI, United States
Synopsis
Keywords: MR Fingerprinting, MR Fingerprinting, Abdominal
Motivation: Optimal sequence design for magnetization-prepared abdominal MRF is largely unexplored. Optimization could potentially result in reduced scan times and increased precision and accuracy.
Goal(s): Investigate the predictive power of CRLB-based cost functions on the performance of magnetization-prepared MRF sequences.
Approach: Sequences with different preparation schemes were selected based on CRLB cost functions and evaluated in simulations and in vivo experiments. In the resulting T1 and T2 maps, precision and accuracy were compared to the relative performance predictions of the cost functions.
Results: The CRLB depends on selection and placement of preparation modules and is correlated with the quantification performance of the resulting sequences.
Impact: Preliminary simulations and experiments indicate that the CRLB correlates well with precision and accuracy in magnetization-prepared abdominal MRF, and may be used for the optimization of these sequences.
Introduction
T1 and T2 mapping using MRF has been shown to indicate areas of fibrosis and inflammation in the liver1. In analogy to cardiac MRF2, abdominal MRF often employs magnetization prepared sequences. However, unlike cardiac MRF, where data are typically collected during a diastolic window to avoid motion artifacts, abdominal MRF sequences can be designed more flexibly. While efforts have been made to recommend favorable sequence designs for cardiac MRF3, such an optimization has not yet been performed for abdominal MRF. In this work, we investigate the suitability of the Cramer-Rao Lower Bound (CRLB) as a predictor of the precision and accuracy of T1 and T2 maps derived using different magnetization-prepared abdominal MRF sequences.Methods
Previously, the CRLB has been used as a cost function in iterative algorithms to optimize flip angles and repetition times of MRF sequences4,5. However, since selecting preparation modules is a discrete and thus non-differentiable problem, a brute-force approach was used in this work to cover the optimization space. The CRLB was calculated for one million randomly created sequences with a duration of 10 seconds. These sequences consist of a variable number of blocks (here between 8 and 16), composed of a preparation module (either no preparation, inversion, or T2 preparation) and a FISP readout with 35 excitations (TR/TE/FA=5.7ms/1.0ms/15°). The number, selection and placement of blocks are randomized. All sequences were evaluated using three cost functions:$$cost_{T1}=\sqrt{\frac{CRLB(T_1)}{T_1^2}}\\
cost_{T2}=\sqrt{\frac{CRLB(T_2)}{T_2^2}}\\
cost_{T1,T2}=cost_{T1}+cost_{T2}$$
T1=660ms and T2=40ms were chosen as the optimization targets (corresponding to liver tissue at 1.5T).
The sequences selected for further investigation based on their low cost metrics are visualized in Figure 1. Additionally, two sequences resulting in a medium and high value of costT1,T2, respectively, are selected for comparison, as well as a sequence based on the established preparation scheme for cardiac MRF of Hamilton et al.2 (our reference). Other established preparation schemes (Jaubert6, Kvernby7) lead to a higher CRLB and were thus excluded after the cost function analysis.
Full MRF simulations were performed with the XCAT phantom8, taking into account data sampling (a spiral k-space trajectory with 48-fold undersampling) and coil sensitivities. The simulations were repeated with different noise levels. Several reconstruction techniques were employed: gridding, low-rank (LR) reconstruction9 and low-rank reconstruction with locally low-rank (LLR)10. The mean and standard deviations for the resulting T1 and T2 values were evaluated in liver ROIs. Finally, the selected sequences were used for in vivo experiments in two healthy subjects. MRF data were collected on a 1.5 T scanner (MAGNETOM Sola, Siemens Healthineers, Erlangen, Germany) using 2D breathheld scans with FOV=300x300 mm2, slice thickness=8 mm, and spatial resolution=1.6x1.6 mm2.
Results
Of the one million sequences examined, approximately 14% outperformed the preparation scheme proposed by Hamilton et al.2 in terms of costT1, 1.2% in terms of costT2, and only 0.09% in terms of costT1,T2.Example T1 and T2 maps from simulated MRF acquisitions are shown in Figure 2. The means and standard deviations in the liver ROI obtained with the different sequences, noise levels, and reconstruction techniques are visualized in Figure 3. Generally, the precision and accuracy of T1 and T2 measurements depend both on the sequence and reconstruction method used. The sequence with low costT1,T2 yields comparable results to the sequence of Hamilton et al.2 for both T1 and T2 quantification. Sequences with higher cost function values lead to both high standard deviations and significant biases. Optimization for only one relaxation time (using costT1 or costT2) generally leads to poor quantification performance of the other.
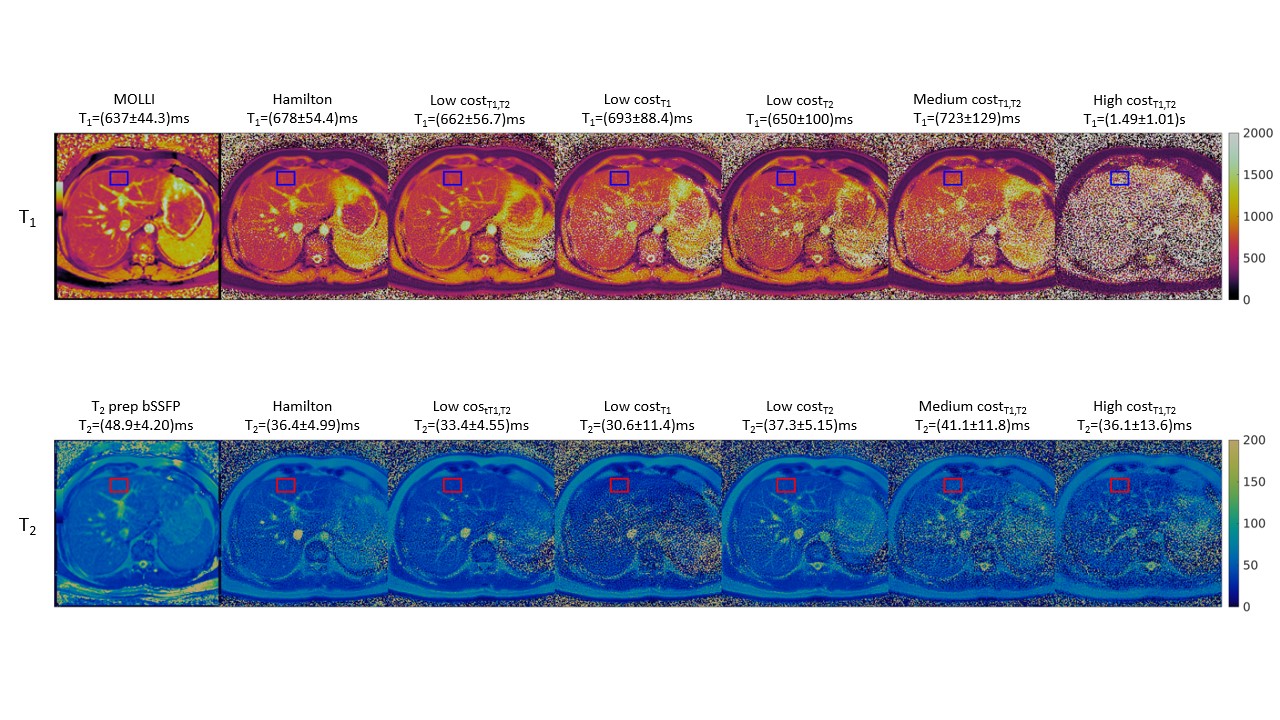
The T1 and T2 maps obtained from in vivo experiments are shown in Figure 4. The dependence of precision and accuracy on the used sequence is in general agreement with simulations, with a few exceptions. Specifically, the sequence with low costT1 performs poorly in terms of T1 precision and accuracy, which might be due to T2 error propagation (cross-talk effects)12.
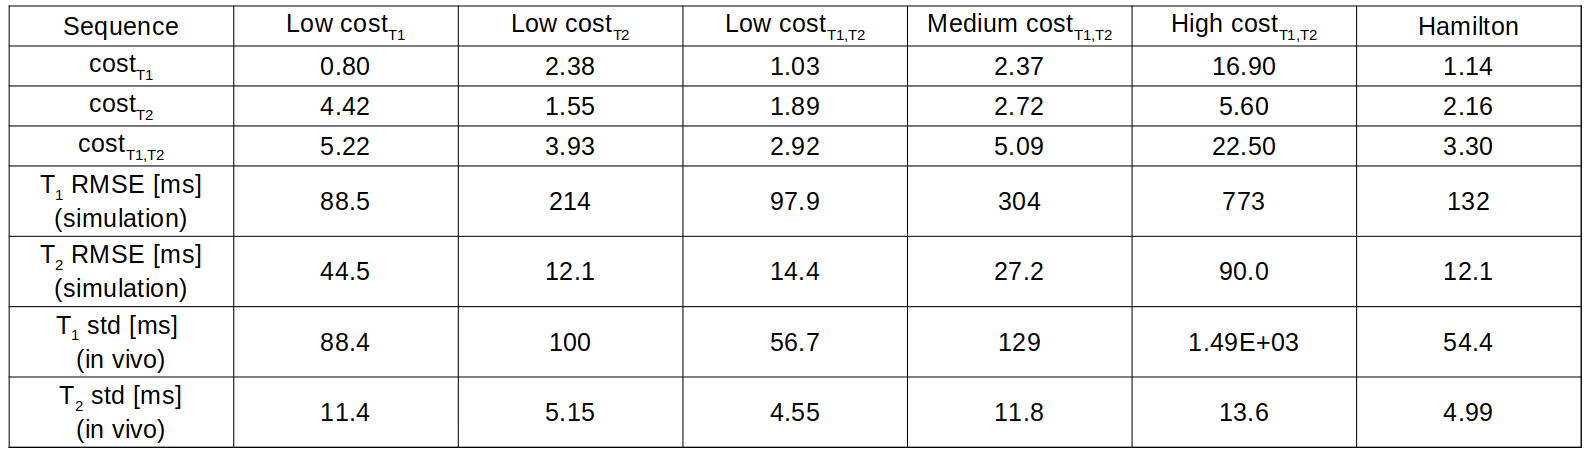
A summary of the evaluations of the different sequences can be found in Figure 5, where RMSE and standard deviation tend to increase with CRLB.
Discussion
Preliminary results indicate that the performance of magnetization-prepared MRF sequences may be predicted using the CRLB. Under otherwise identical conditions, the selection and placement of preparation modules have a high impact on the precision and accuracy of the resulting relaxation time maps in both simulations and in vivo experiments.The optimization approach pursued in this work does not yet result in significant improvements over the sequence design proposed by Hamilton et al2. Next steps could include the exploitation of additional degrees of freedom in the design of abdominal MRF sequences.
Acknowledgements
This work was supported in part by the NIH (R01 HL153034, R01HL163991, R01HL163030) and Siemens Healthineers.References
Fujita S, Sano K, Cruz G, Fukumura Y, Kawasaki H, Fukunaga I, Morita Y, Yoneyama M, Kamagata K, Abe O, Ikejima K, Botnar RM, Prieto C, Aoki S. MR Fingerprinting for Liver Tissue Characterization: A Histopathologic Correlation Study. Radiology. 2023 Jan;306(1):150-159. doi: 10.1148/radiol.220736.
Hamilton JI, Jiang Y, Chen Y, Ma D, Lo WC, Griswold M, Seiberlich N. MR fingerprinting for rapid quantification of myocardial T1 , T2 , and proton spin density. Magn Reson Med. 2017 Apr;77(4):1446-1458. doi: 10.1002/mrm.26216.
Hamilton JI, Jiang Y, Ma D, Lo WC, Gulani V, Griswold M, Seiberlich N. Investigating and reducing the effects of confounding factors for robust T1 and T2 mapping with cardiac MR fingerprinting. Magn Reson Imaging. 2018 Nov;53:40-51. doi: 10.1016/j.mri.2018.06.018.
Bo Zhao, Haldar JP, Congyu Liao, Dan Ma, Yun Jiang, Griswold MA, Setsompop K, Wald LL. Optimal Experiment Design for Magnetic Resonance Fingerprinting: Cramér-Rao Bound Meets Spin Dynamics. IEEE Trans Med Imaging. 2019 Mar;38(3):844-861. doi: 10.1109/TMI.2018.2873704.
Lee PK, Watkins LE, Anderson TI, Buonincontri G, Hargreaves BA. Flexible and efficient optimization of quantitative sequences using automatic differentiation of Bloch simulations. Magn Reson Med. 2019 Oct;82(4):1438-1451. doi: 10.1002/mrm.27832.
Jaubert O, Arrieta C, Cruz G, Bustin A, Schneider T, Georgiopoulos G, Masci PG, Sing-Long C, Botnar RM, Prieto C. Multi-parametric liver tissue characterization using MR fingerprinting: Simultaneous T1 , T2 , T2 *, and fat fraction mapping. Magn Reson Med. 2020 Nov;84(5):2625-2635. doi: 10.1002/mrm.28311.
Kvernby, S., Warntjes, M.J.B., Haraldsson, H. et al. Simultaneous three-dimensional myocardial T1 and T2 mapping in one breath hold with 3D-QALAS. J Cardiovasc Magn Reson 16, 102 (2014). doi: 10.1186/s12968-014-0102-0.
Segars WP, Sturgeon G, Mendonca S, Grimes J, Tsui BM. 4D XCAT phantom for multimodality imaging research. Med Phys. 2010 Sep;37(9):4902-15. Doi: 10.1118/1.3480985.
Zhao B, Setsompop K, Adalsteinsson E, Gagoski B, Ye H, Ma D, Jiang Y, Ellen Grant P, Griswold MA, Wald LL. Improved magnetic resonance fingerprinting reconstruction with low-rank and subspace modeling. Magn Reson Med. 2018 Feb;79(2):933-942. doi: 10.1002/mrm.26701.
Lima da Cruz G, Bustin A, Jaubert O, Schneider T, Botnar RM, Prieto C. Sparsity and locally low rank regularization for MR fingerprinting. Magn Reson Med. 2019 Jun;81(6):3530-3543. doi: 10.1002/mrm.27665.
Messroghli DR, Radjenovic A, Kozerke S, Higgins DM, Sivananthan MU, Ridgway JP. Modified Look-Locker inversion recovery (MOLLI) for high-resolution T1 mapping of the heart. Magn Reson Med. 2004 Jul;52(1):141-6. doi: 10.1002/mrm.20110.
Stolk CC, Sbrizzi A. Understanding the Combined Effect of k -Space Undersampling and Transient States Excitation in MR Fingerprinting Reconstructions. IEEE Trans Med Imaging. 2019 Oct;38(10):2445-2455. doi: 10.1109/TMI.2019.2900585.
Figures
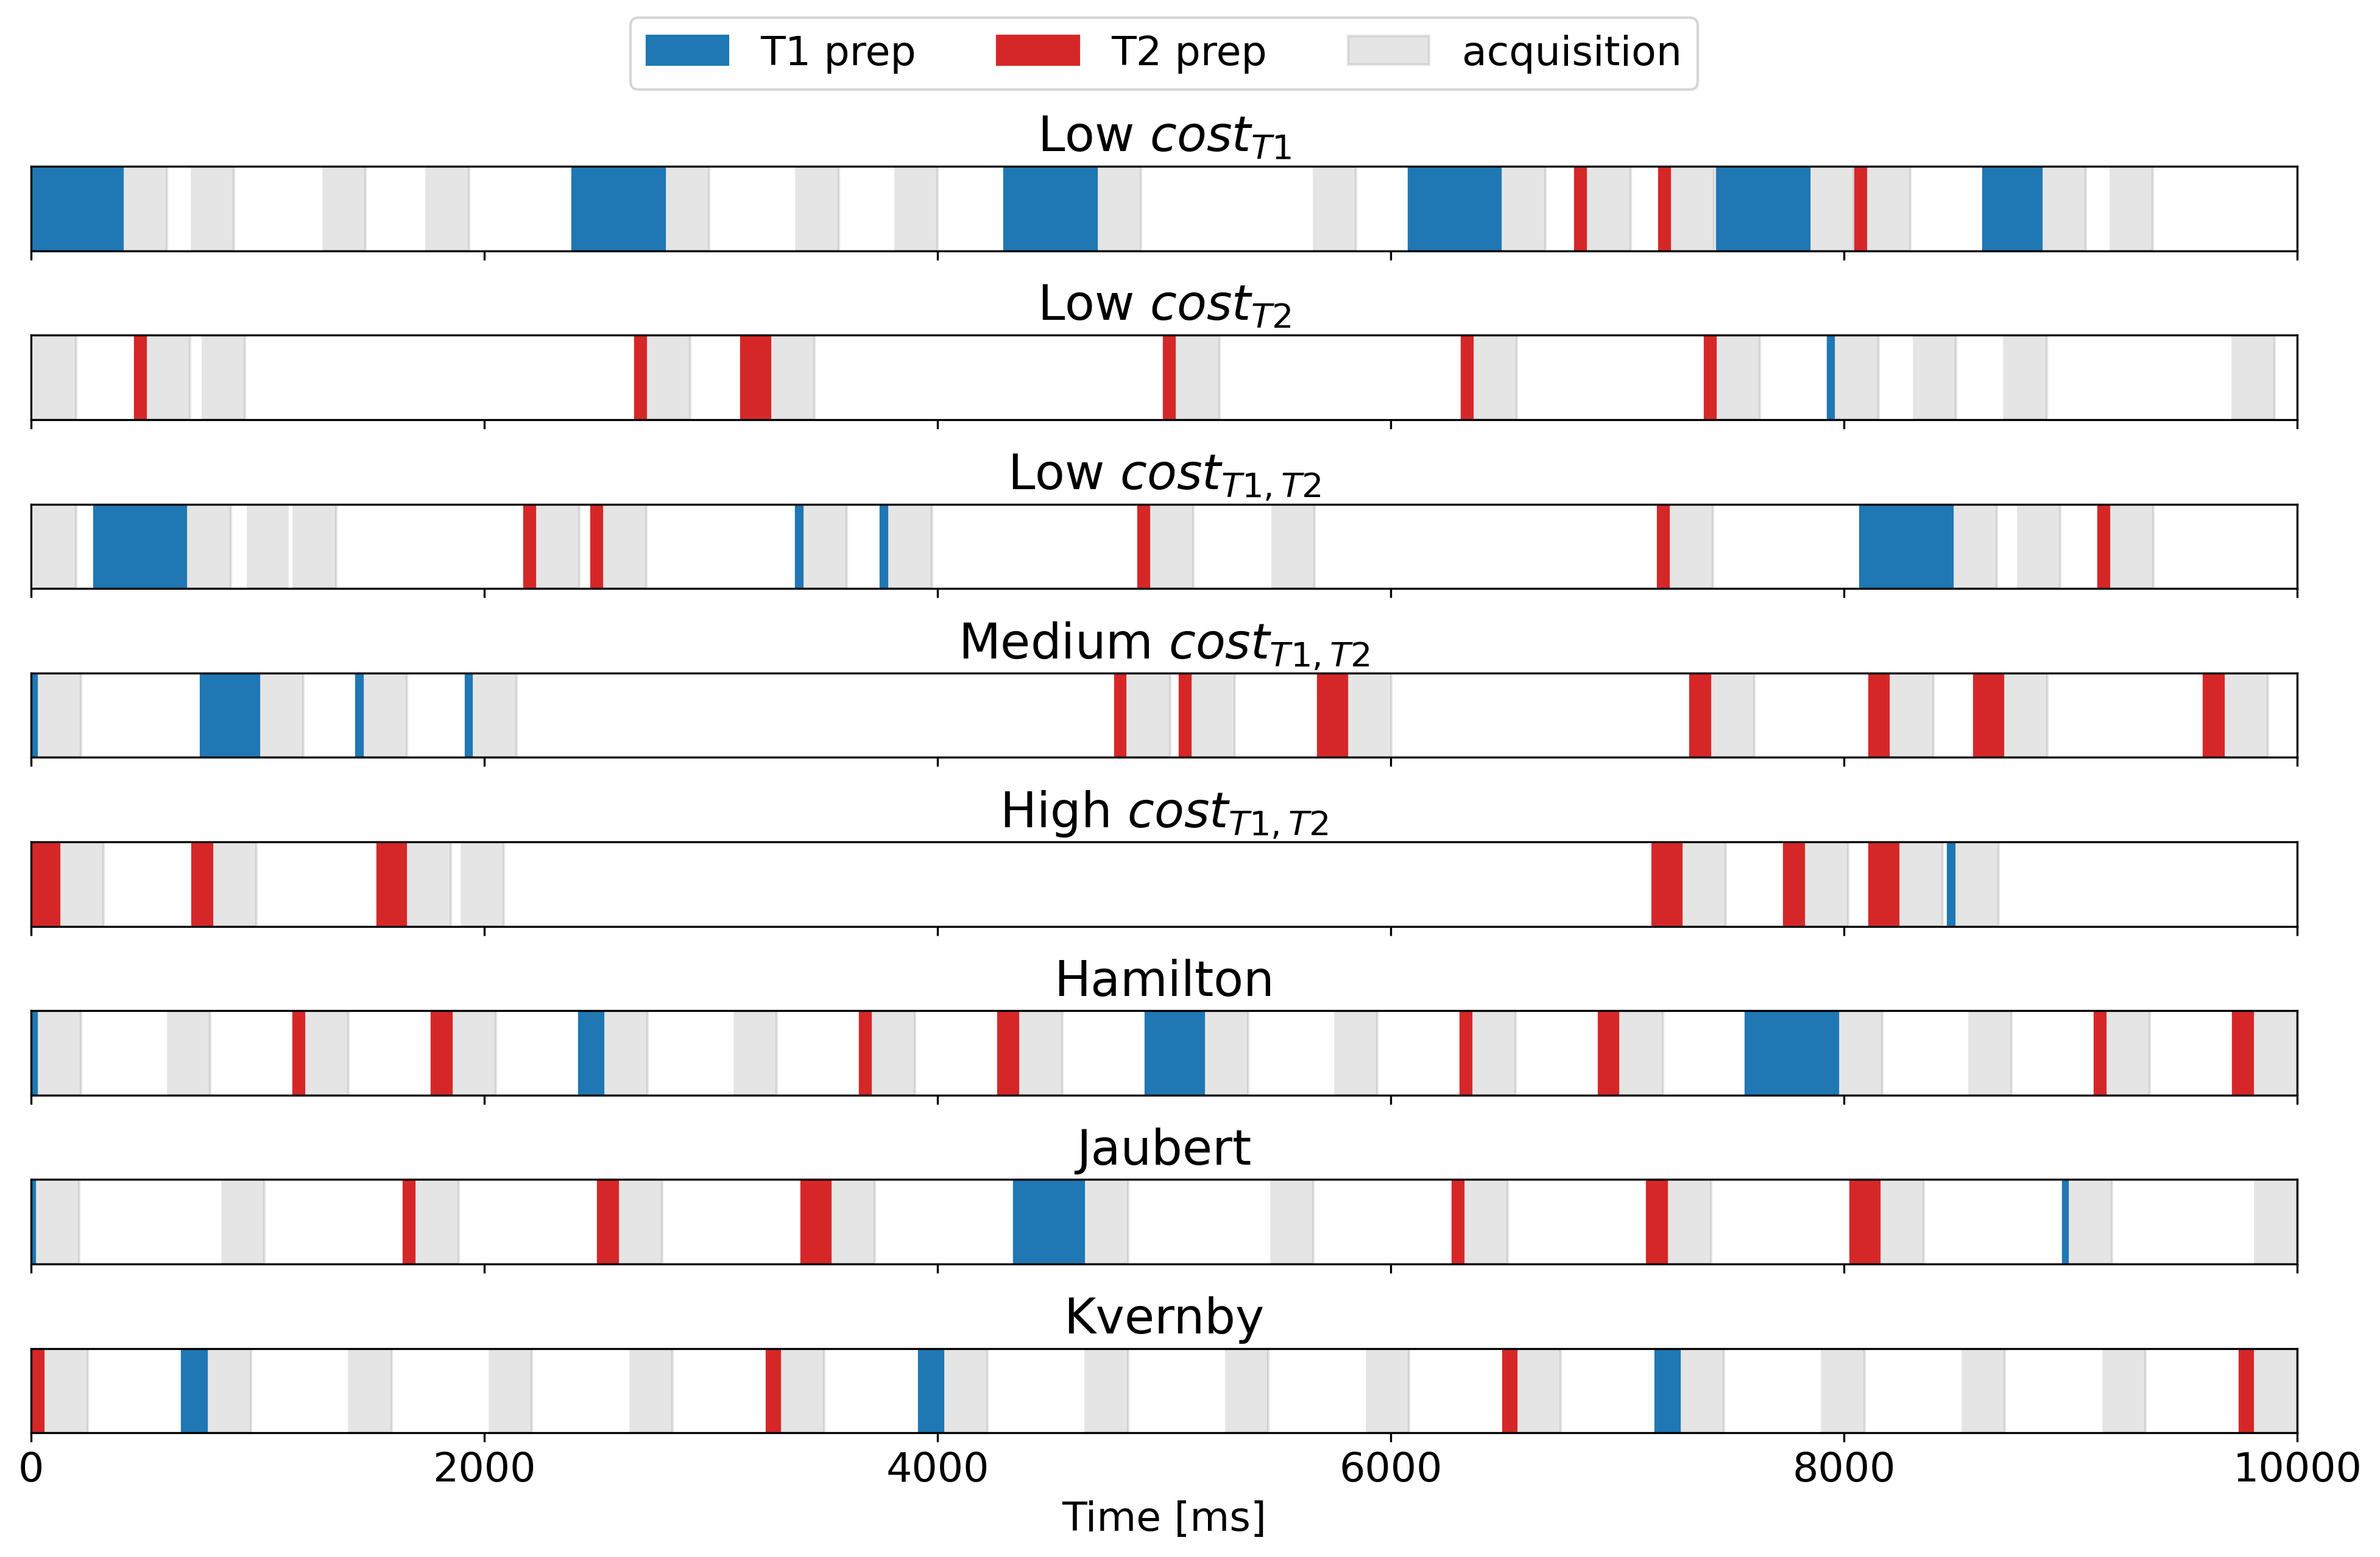
Figure 1: Representative sequences that result in low and high cost function values (top 5 rows) and sequences derived from established preparation schemes (bottom 3 rows). Because the preparation schemes as proposed by Jaubert et al.6 and Kvernby et al.7 lead to higher cost function values than that proposed by Hamiltonet al.2, they are not considered for further investigation.
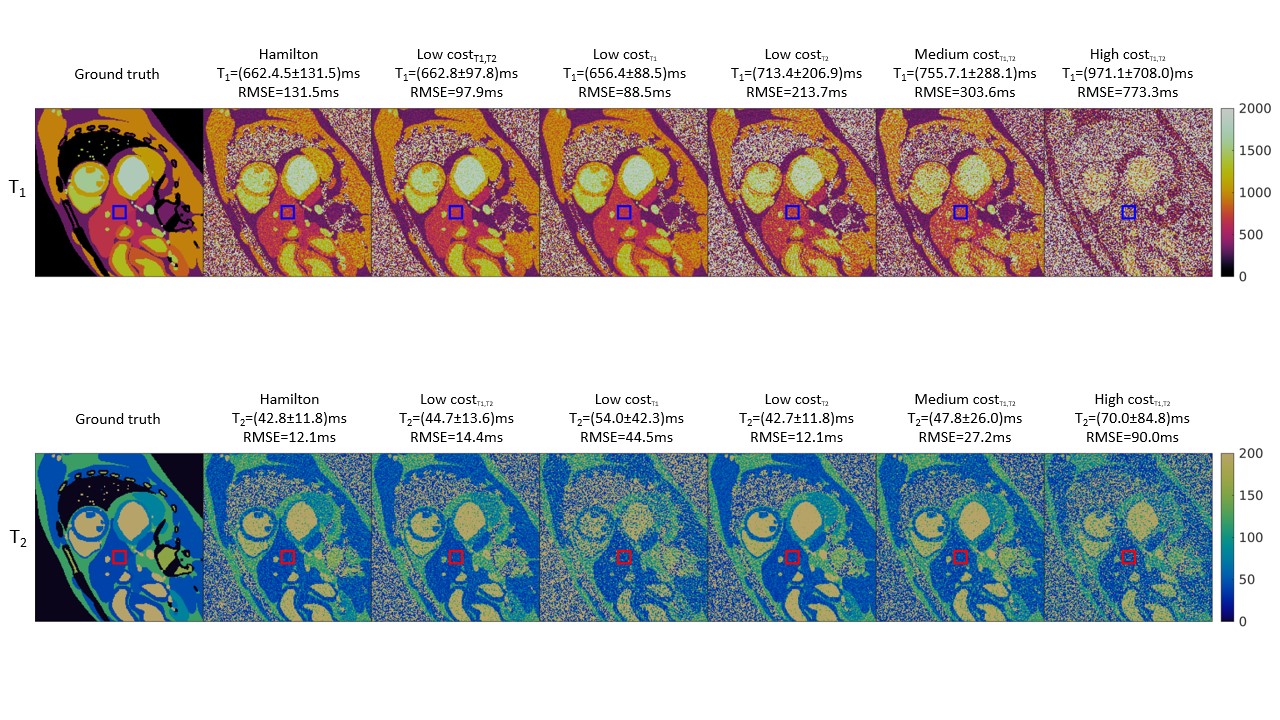
Figure 2: Example relaxation time maps resulting from simulated acquisitions with different MRF sequences. The simulated data has been reconstructed using low-rank reconstruction. The numbers above each subplot correspond to the ROI drawn in the liver. In the ground truth used for simulation, this is a homogeneous region with T1=660ms, T2=40ms.
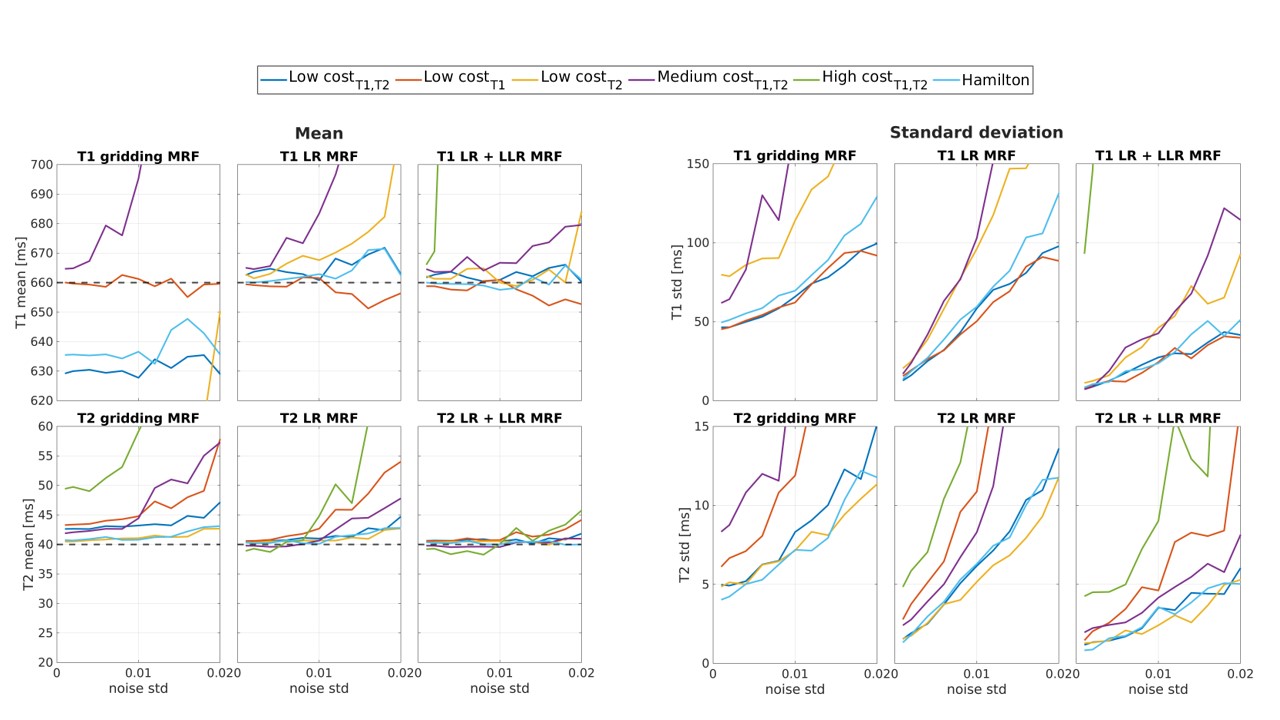
Figure 3: Mean and standard deviation of relaxation times in the liver ROI as determined with the XCAT simulation, depending on the used sequence, reconstruction technique and standard deviation of added noise. The dotted lines in the mean plots represent the ground truth. In both subplots. the leftmost column corresponds to reconstruction without application of low rank methods, the middle one to LR reconstruction, and the rightmost column corresponds to LR reconstruction with LLR.