3547
Towards Sequence Optimization for Multi-Compartment Magnetic Resonance Fingerprinting1Experimental Physics 5, University of Würzburg, Würzburg, Germany, 2Department of Biomedical Engineering, University of Michigan, Ann Arbor, MI, United States, 3Department of Radiology, University of Michigan, Ann Arbor, MI, United States, 4Department of Internal Medicine I, University Hospital Würzburg, Würzburg, Germany, 5Magnetic Resonance and X-Ray Imaging Department, Division Development Center X-Ray Technology, Fraunhofer Institute for Integrated Circuits IIS, Würzburg, Germany
Synopsis
Keywords: MR Fingerprinting, MR Fingerprinting, Myelin
Motivation: Volumetric measurements of the myelin water fraction in the human brain are hampered by long acquisition times.
Goal(s): Investigate the extent to which sequence optimization can improve the encoding efficiency of multi-compartment Magnetic Resonance Fingerprinting.
Approach: Implement different cost functions to optimize MRF sequence parameters. Validate the results with simulations, one-dimensional projection measurements in phantoms and in vivo measurements.
Results: MRF sequence design has a significant influence on partial volume estimation with MRF. Optimization can yield improved tissue discrimination and more detailed myelin water fraction maps.
Impact: MRF sequence design has a significant influence on partial volume estimation, yielding potential for optimization of, for example, tissue discrimination and myelin water fraction mapping. Further investigation of cost functions and validation of results is needed.
Introduction
While efforts have been made to determine optimal sequence parameters for Magnetic Resonance Fingerprinting (MRF)1-4, to date mostly heuristically chosen sequence parameters are used for MRF based partial volume estimation5,6. This approach apparently cannot be deemed optimal, leading to the question: to what extent can sequence optimization yield improvements for multi-compartment MRF, and which approaches are most promising? In this work, we optimized sequence parameters specific to the problem of partial volume estimation for the quantification of the myelin water fraction in the human brain. We evaluated our approaches in simulations as well as in phantom and in vivo experiments.Methods
The first implemented cost function (based on an idea presented by Cohen and Rosen3) is aimed at increasing the discrimination of signal evolutions originating from different tissue types. In this case, we aimed at differentiating between myelin water (MW), white matter (WM), and cerebrospinal fluid (CSF).The second cost function builds on an idea presented by Heesterbeek7. We implemented a Cramer-Rao Lower Bound (CRLB)-based cost function to minimize the variance of the tissue fraction estimate fMW=MMW/(MMW+MWM) in a two-compartment setting.
All optimizations were taylored for an MRF sequence with a preceding inversion pulse and FISP readout and were initialized with flip angles and repetition times as used by Cao8. In total, four optimizations were studied in more detail, each using one of the two cost functions in combination with the optimization constraints 5°<α<25° or 10°<α<60°. The maximum allowed flip angle difference in subsequent excitations was set to 1°, repetition times were between 8 and 16 ms. Resulting sequences are shown in Figure 1.
To numerically evaluate the sensitivity to noise of the optimized sequences, a highly simplified model of an MRF experiment was employed. The signal evolution of a voxel consisting of myelin water and white matter was calculated, then artificial noise was added and the tissue fraction fMW was determined using partial volume dictionary matching. This procedure was repeated ten thousand times and the variance of the result was calculated.
For the experimental validation of the sequences optimized for partial volume estimation, we first performed 1D projection measurements in homogeneous phantoms with relaxation times similar to those of myelin water, white matter, and CSF (cf. Figure 2). The advantage of 1D projections as a validation tool is the high SNR and the absence of undersampling artifacts.
Finally, first in vivo measurements were performed on a healthy volunteer using Pulseq-generated sequences9. For image acquisition, a variable density spiral readout was applied, resulting in a scan time of 6-8 seconds per slice. All measurements were performed on a clinical 3T scanner (Siemens MAGNETOM Skyra). A low rank alternating method of multipliers was employed for data reconstruction10. To obtain tissue fraction maps, partial volume dictionary matching was applied to the reconstructed MRF frames.
Results
The evaluation of the simulated partial volume dictionary matching shows that both optimization approaches can reduce the variance of the estimated tissue fraction in a simplified model to a similar extent. Allowing higher flip angles generally leads to a bigger reduction. In the studied case, the variance of the tissue fraction estimate can be reduced by up to 38%.The results of the 1D projection phantom measurements shown in Figure 3 confirm the increased discrimination of the (normalized) signal evolutions originating from different tissues when measured with optimized sequences, even though the relaxation times of the phantoms do not exactly match those used for optimization.
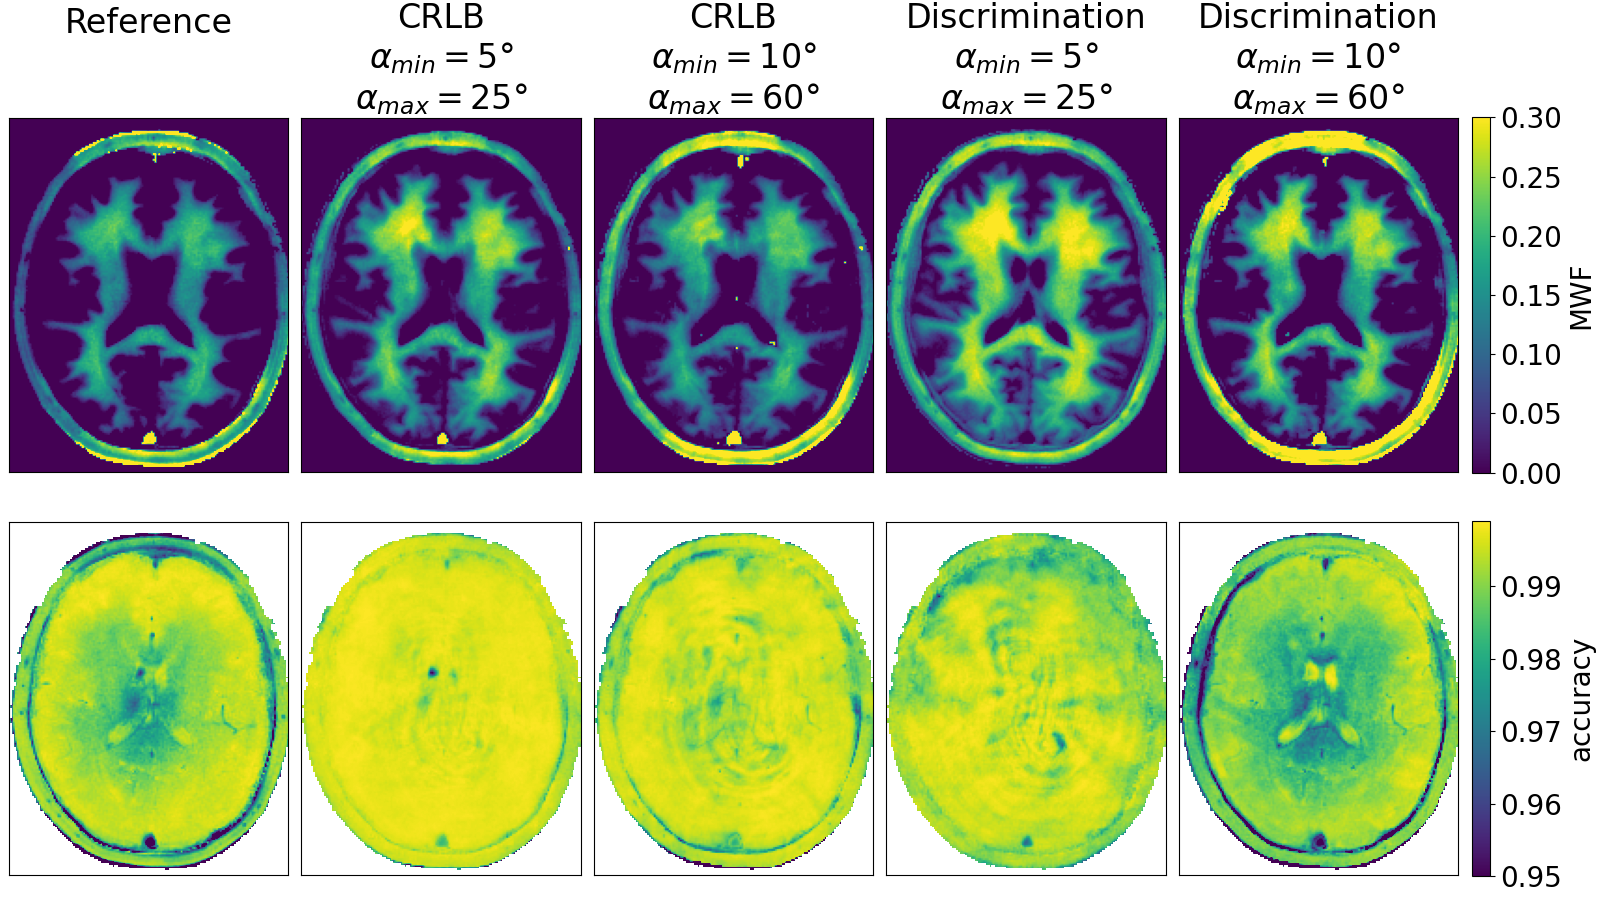
Figure 4 shows myelin water fraction maps from the in vivo measurements. The use of optimized sequences results in more detailed maps. However, the fraction values vary depending on the used sequence. An investigation of the similarity of measured and matched signal evolutions suggests that lower flip angles generally lead to a better concordance of measurement and simulation.
Discussion
First experimental results from phantom and in vivo measurements with optimized sequences indicate a strong dependence of the results on sequence design as well as a potential for increased tissue discrimination and more detailed myelin water maps. Further steps could be the consideration of undersampling effects in sequence optimization or a combination of the presented cost functions. The proposed 1D projection measurements could be extended to mimic a controlled partial volume setting. Ultimately, the optimized sequences could be combined with a three-dimensional acquisition for whole-brain exams in under five minutes, as proposed by Cao8.Conclusion
MRF partial volume estimation results heavily depend on the used sequence parameters. Sequence optimization has the potential to improve tissue discrimination and yield more detailed myelin water maps in the human brain.Acknowledgements
No acknowledgement found.References
- Bo Zhao, Haldar JP, Congyu Liao, Dan Ma, Yun Jiang, Griswold MA, Setsompop K, Wald LL. Optimal Experiment Design for Magnetic Resonance Fingerprinting: Cramér-Rao Bound Meets Spin Dynamics. IEEE Trans Med Imaging. 2019 Mar;38(3):844-861. doi: 10.1109/TMI.2018.2873704.
- Lee PK, Watkins LE, Anderson TI, Buonincontri G, Hargreaves BA. Flexible and efficient optimization of quantitative sequences using automatic differentiation of Bloch simulations. Magn Reson Med. 2019 Oct;82(4):1438-1451. doi: 10.1002/mrm.27832.
- Cohen O, Rosen MS. Algorithm comparison for schedule optimization in MR fingerprinting. Magn Reson Imaging. 2017 Sep;41:15-21. doi: 10.1016/j.mri.2017.02.010.
- Heesterbeek DGJ, Koolstra K, van Osch MJP, van Gijzen MB, Vos FM, Nagtegaal MA. Mitigating undersampling errors in MR fingerprinting by sequence optimization. Magn Reson Med. 2023 May;89(5):2076-2087. doi: 10.1002/mrm.29554.
- McGivney D, Deshmane A, Jiang Y, Ma D, Badve C, Sloan A, Gulani V, Griswold M. Bayesian estimation of multi-component relaxation parameters in magnetic resonance fingerprinting. Magn Reson Med. 2018 Jul;80(1):159-170. doi: 10.1002/mrm.27017.
- Deshmane A, McGivney DF, Ma D, Jiang Y, Badve C, Gulani V, Seiberlich N, Griswold MA. Partial volume mapping using magnetic resonance fingerprinting. NMR Biomed. 2019 May;32(5):e4082. doi: 10.1002/nbm.4082.
- Heesterbeek D, Vos F, van Gijzen M, Nagtegaal M. Sequence Optimisation for Multi-Compartment Analysis in Magnetic Resonance Fingerprinting. ISMRM 2021, Abstract #1561.
- Cao X, Liao C, Iyer SS, Wang Z, Zhou Z, Dai E, Liberman G, Dong Z, Gong T, He H, Zhong J, Bilgic B, Setsompop K. Optimized multi-axis spiral projection MR fingerprinting with subspace reconstruction for rapid whole-brain high-isotropic-resolution quantitative imaging. Magn Reson Med. 2022 Jul;88(1):133-150. doi: 10.1002/mrm.29194.
- Layton KJ, Kroboth S, Jia F, Littin S, Yu H, Leupold J, Nielsen JF, Stöcker T, Zaitsev M. Pulseq: A rapid and hardware-independent pulse sequence prototyping framework. Magn Reson Med. 2017 Apr;77(4):1544-1552. doi: 10.1002/mrm.26235.
- Assländer J, Cloos MA, Knoll F, Sodickson DK, Hennig J, Lattanzi R. Low rank alternating direction method of multipliers reconstruction for MR fingerprinting. Magn Reson Med. 2018 Jan;79(1):83-96. doi: 10.1002/mrm.26639.
Figures
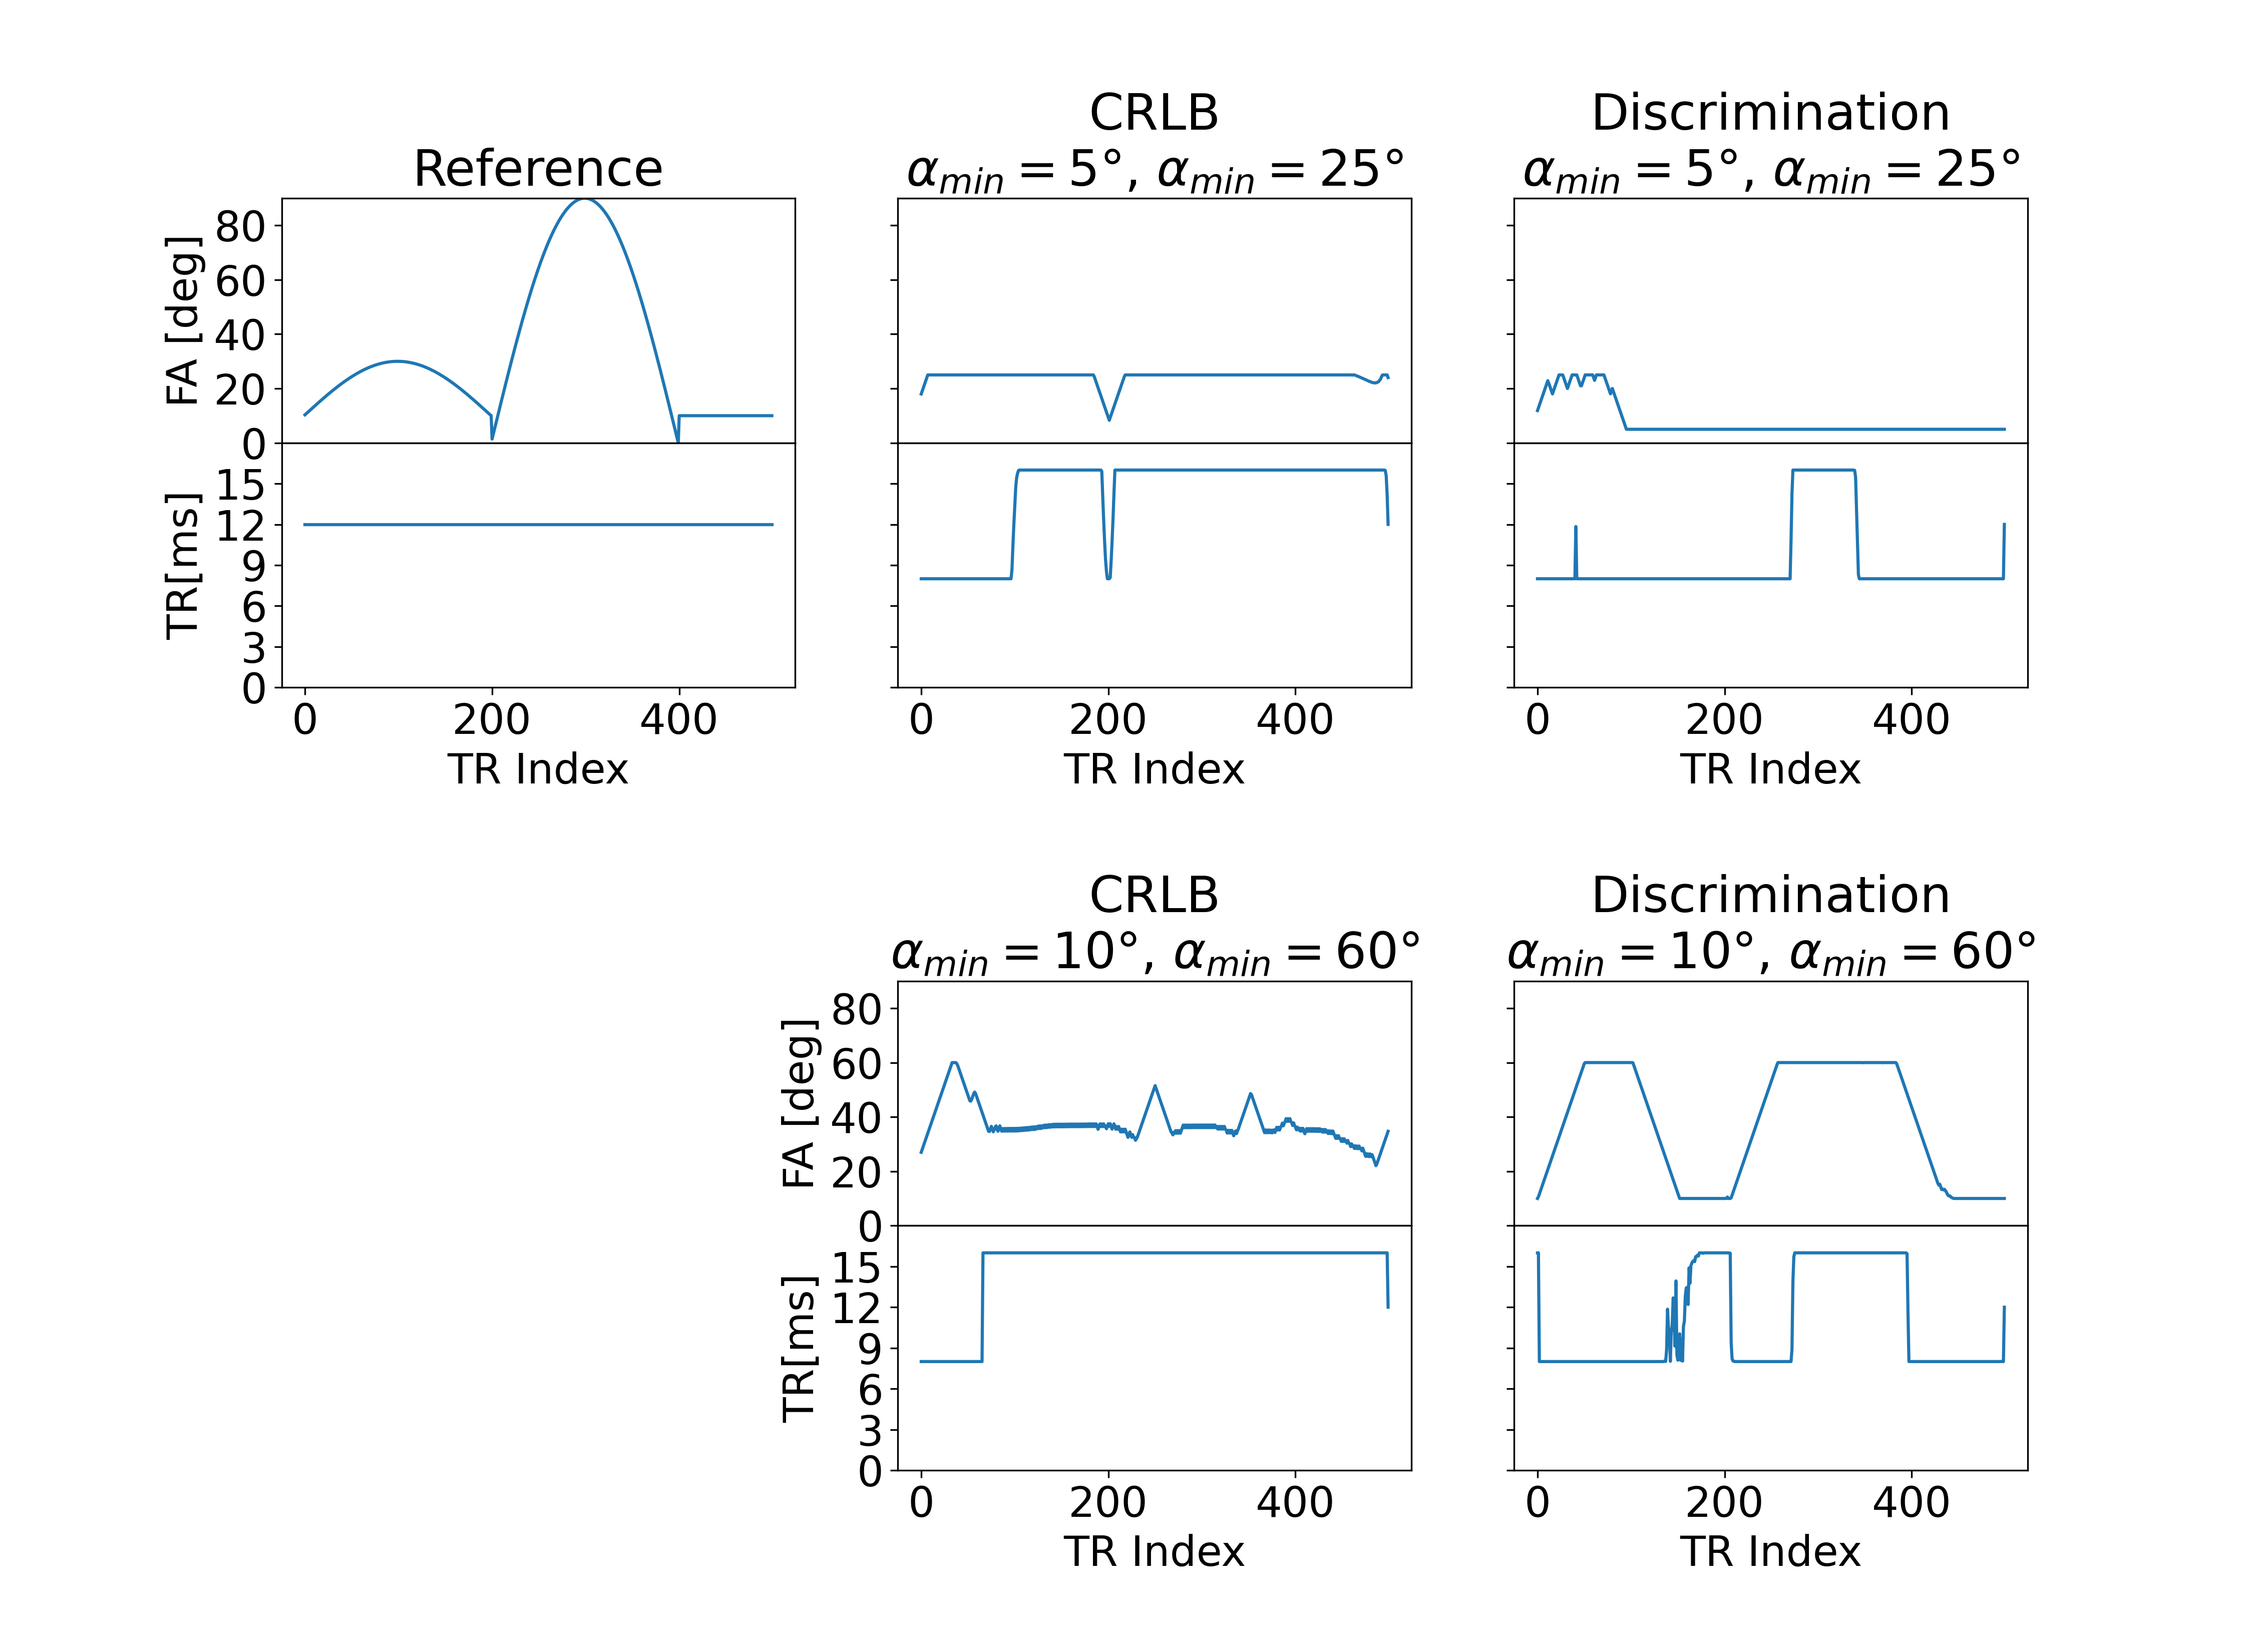
Figure 1: Resulting sequences from optimizations with different cost functions and sets of optimization constraints. Flip angles are constraint to either the range of 5-25° or 10-60°. The maximum allowed difference of successive flip angles is 1°. Repetition times are between 8 and 16 ms.
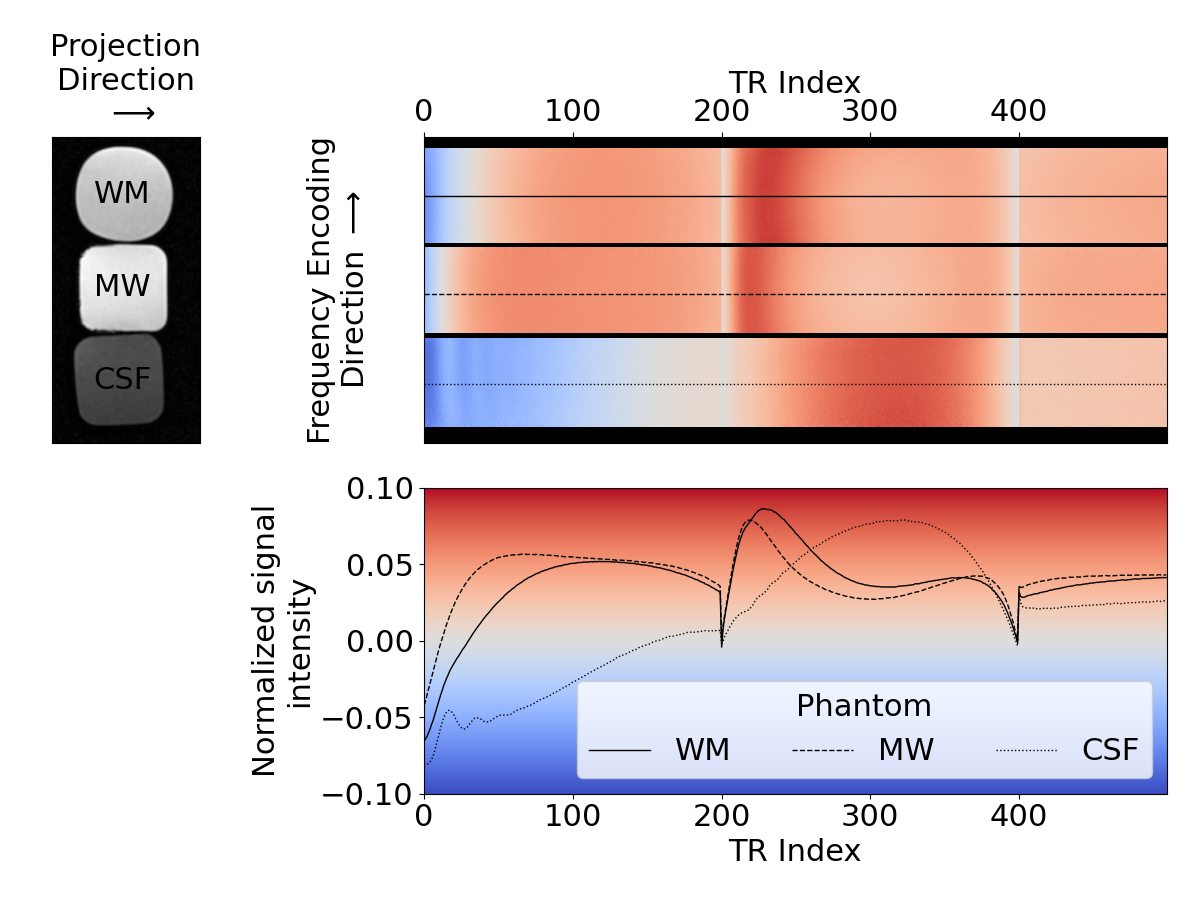
Figure 2: Schematic representation of the 1D projection measurements. Upper left: Localizer image of the three phantoms placed in the scanner. Upper right: projected signal intensity (color coded) as a function of position on the frequency encoding axis and TR index. Lower right: Signal evolutions, each averaged across one of the three phantoms. The relaxation times of the phantoms are: WM phantom: T1=643ms, T2=64.7ms; MW phantom: T1=243ms, T2=21.5ms; CSF phantom: T1=2404ms, T2=2185ms.
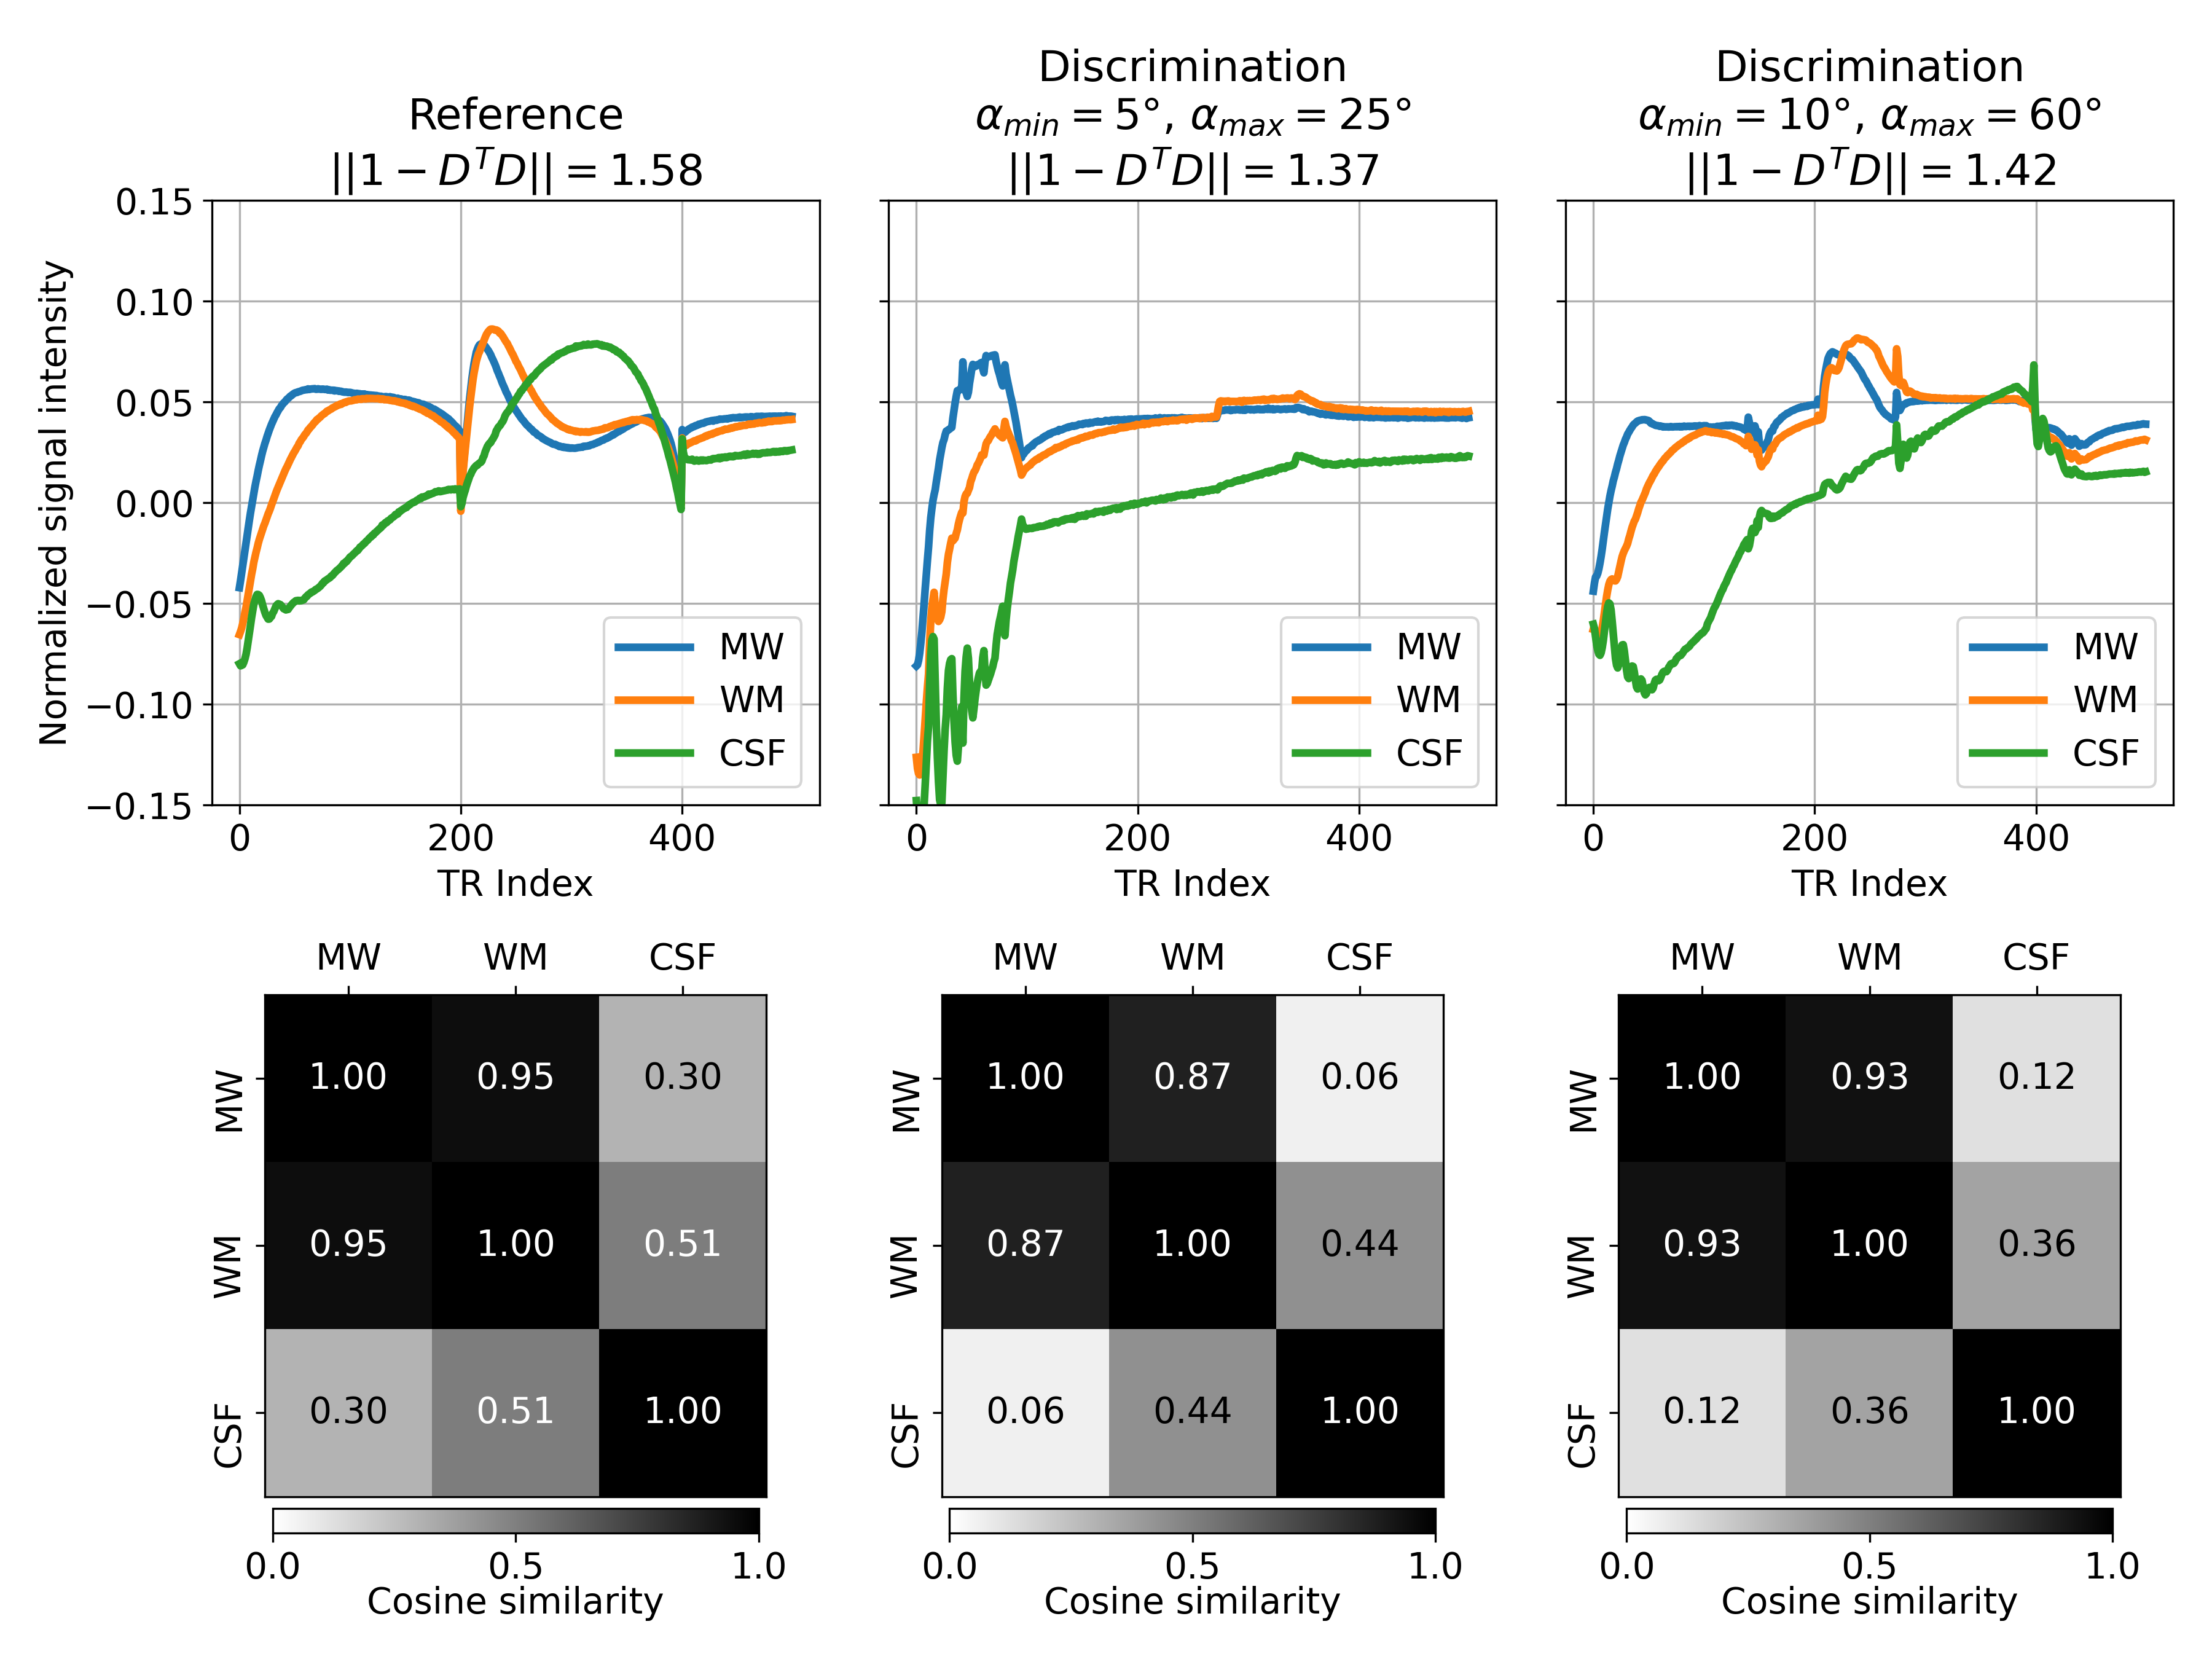
Figure 3: Upper row: Measured phantom signals. These can be combined to an array D, which in turn is used to calculate the tissue discrimination cost function ||1-DTD||, a measure for the orthogonality of the individual signal evolutions. Lower row: Orthogonality matrices DTD. It should be noted that the phantom relaxation times do not exactly match those used for optimization.