3546
3D Magnetic Resonance Fingerprinting for Rapid Simultaneous Bilateral T1, T2 and T1ρ Relaxation Mapping of the Hip Joint1Radiology, Center for Advanced Imaging Innovation and Research (CAI2R), Department of Radiology, New York Langone Health, New York, NY, United States
Synopsis
Keywords: MR Fingerprinting, Osteoarthritis, Bilateral Hip Imaging
Motivation: MR Fingerprinting (MRF) can accelerate simultaneous acquisition of multiple quantitative parametric maps with respect to conventional qMRI approaches.
Goal(s): To demonstrate the feasibility of 3D bilateral hip MRF to map T1 , T2 and T1ρ in the hip Joint.
Approach: 3D MRF maps of bilateral hip were acquired for 6 healthy subjects. Parametric maps estimated are compared against parametric maps estimated from VIBE variable flip angle and Turbo-Flash sequences.
Results: Parametric maps obtained from 3D MRF are highly correlated (R-square > 0.89) with parametric maps from reference MRI ; 6.3% - 7.4% variance in 3D MRF parametric maps in repeatability test.
Impact: 3D MR Fingerprinting (MRF) can accelerate the acquisition of parametric maps in the hip joint without considerably effecting the accuracy of the parametric maps.
INTRODUCTION
MRI plays a crucial role in diagnosing and analyzing conditions like Femeroacetabular impingement (FAI) and Osteoarthritis (OA) in the hip. Conventional1,2 quantitative MRI methods are limited, as they can estimate one quantitative map at a time and are prone to motion artifacts. Magnetic Resonance Fingerprinting (MRF) allows for simultaneous estimation of multiple tissue properties, including T1, T2, and T1ρ. In this study, we extend the 2D MRF approach3 to estimate T1, T2, and T1ρ to 3D and demonstrate its feasibility in model NIST/ISMRM phantom and healthy volunteers.METHODS
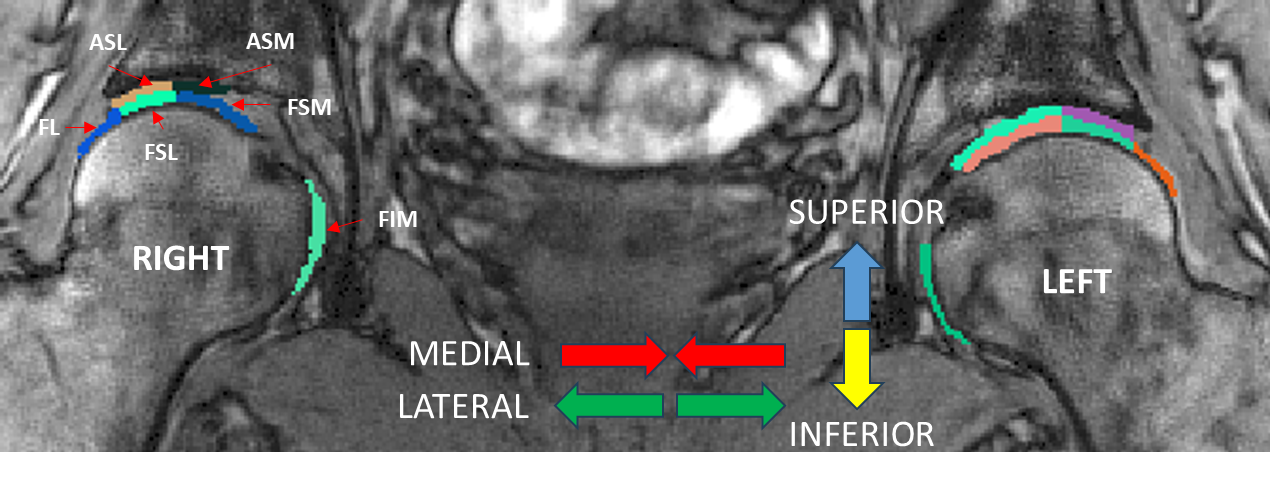
Bilateral hip 3D-MRF is acquired on 6 healthy subjects (Age: 29-34 yrs) on a 3T scanner after getting consent. The field of view of the acquisition is 300 mm; The acquired image has an in-plane resolution of 432x432; 14 slices; 0.7x0.7 mm voxel size; and 3mm slice thickness. MRI reference scans are acquired using a variable flip-angle VIBE sequence for T1 mapping and fat-suppressed magnetization-prepared Turbo Flash2 (TFL) for T2 and T1ρ mapping. A stack of star T1ρ-enabled MRF4; Spin-lock pulses (TSL)=0.50, 4.20, 9.80, and 21.80 ms; the spin-lock frequency=400 Hz and is used for acquisition. The MRF dictionary is constructed based on EPG-X5. Dictionary comprises of signal evolution corresponding to T1 = 300 to 1000ms ; T2 = 15 to 100ms ; T1ρ = 15 to 100ms with step size of 3% . The parametric T1, T2, T1ρ, and ΔB1 maps are reconstructed by matching the signal evolution to the dictionary.The MRF parametric maps are reconstructed for 1, 2, and 4-shot acquisitions and SNR is calculated on it with respect to a noisy MRF acquisition. The mean, standard deviation, and coefficient of variance (CV) are calculated for T1, T2, and T1ρ from these acquisitions. The T1, T2, and T1ρ maps obtained from MRF acquisition are compared with those obtained from reference MRI acquisition using regression analysis on a NIST/ISMRM phantom6. We repeat the MRF acquisition with the highest SNR and test the parametric maps obtained for repeatability using the bland-altman test. The articular cartilage in the hip joint is divided into subregions7: Femoral Lateral (FL), Femoral Superolateral (FSL), Femoral SuperoMedial (FSM), Femoral Inferior Medial (FIM), Acetabular Superolateral (ASL), and Acetabular Superomedial (ASM) as shown in figure1. The separability between subregions is measured using the Kruskall-Wallis test. The separability between the acetabular and femoral regions; left and right of the articular cartilage of the hip is measured using the Wilcoxon test. This study was approved by the institutional review board (IRB) of New York University Langone Health. The study is compliant with the Health Insurance Portability and Accountability Act (HIPAA).
RESULTS
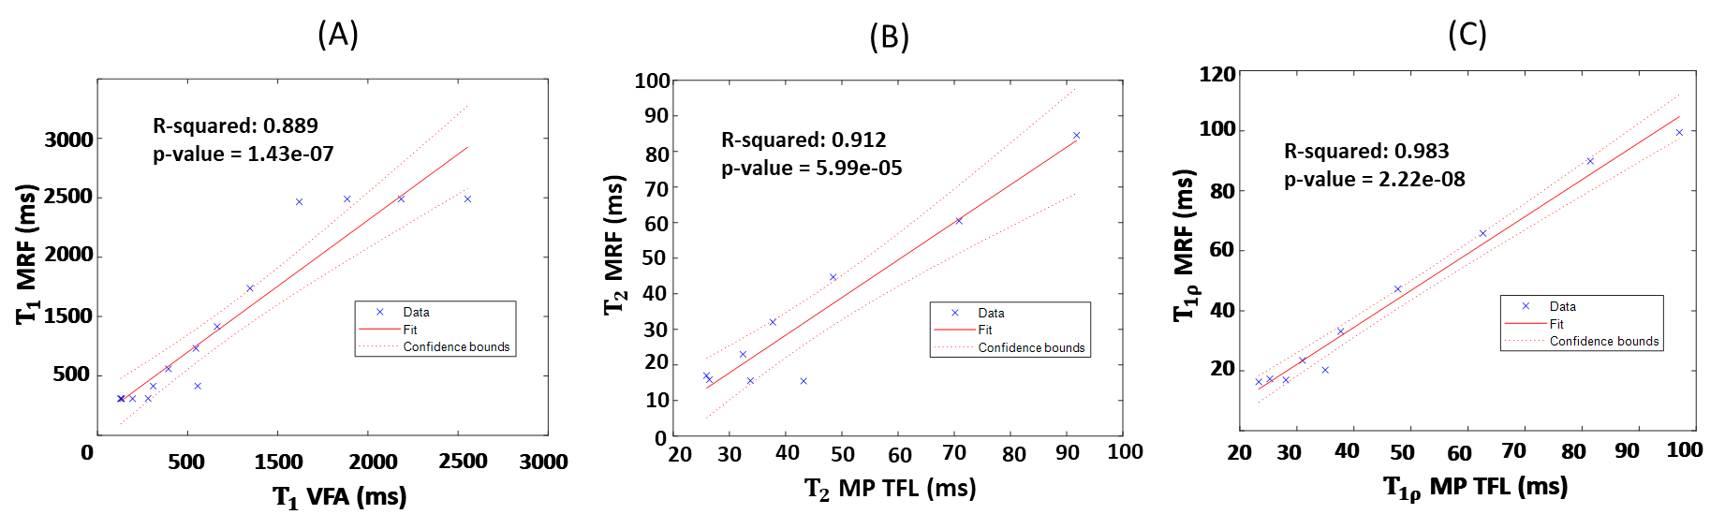
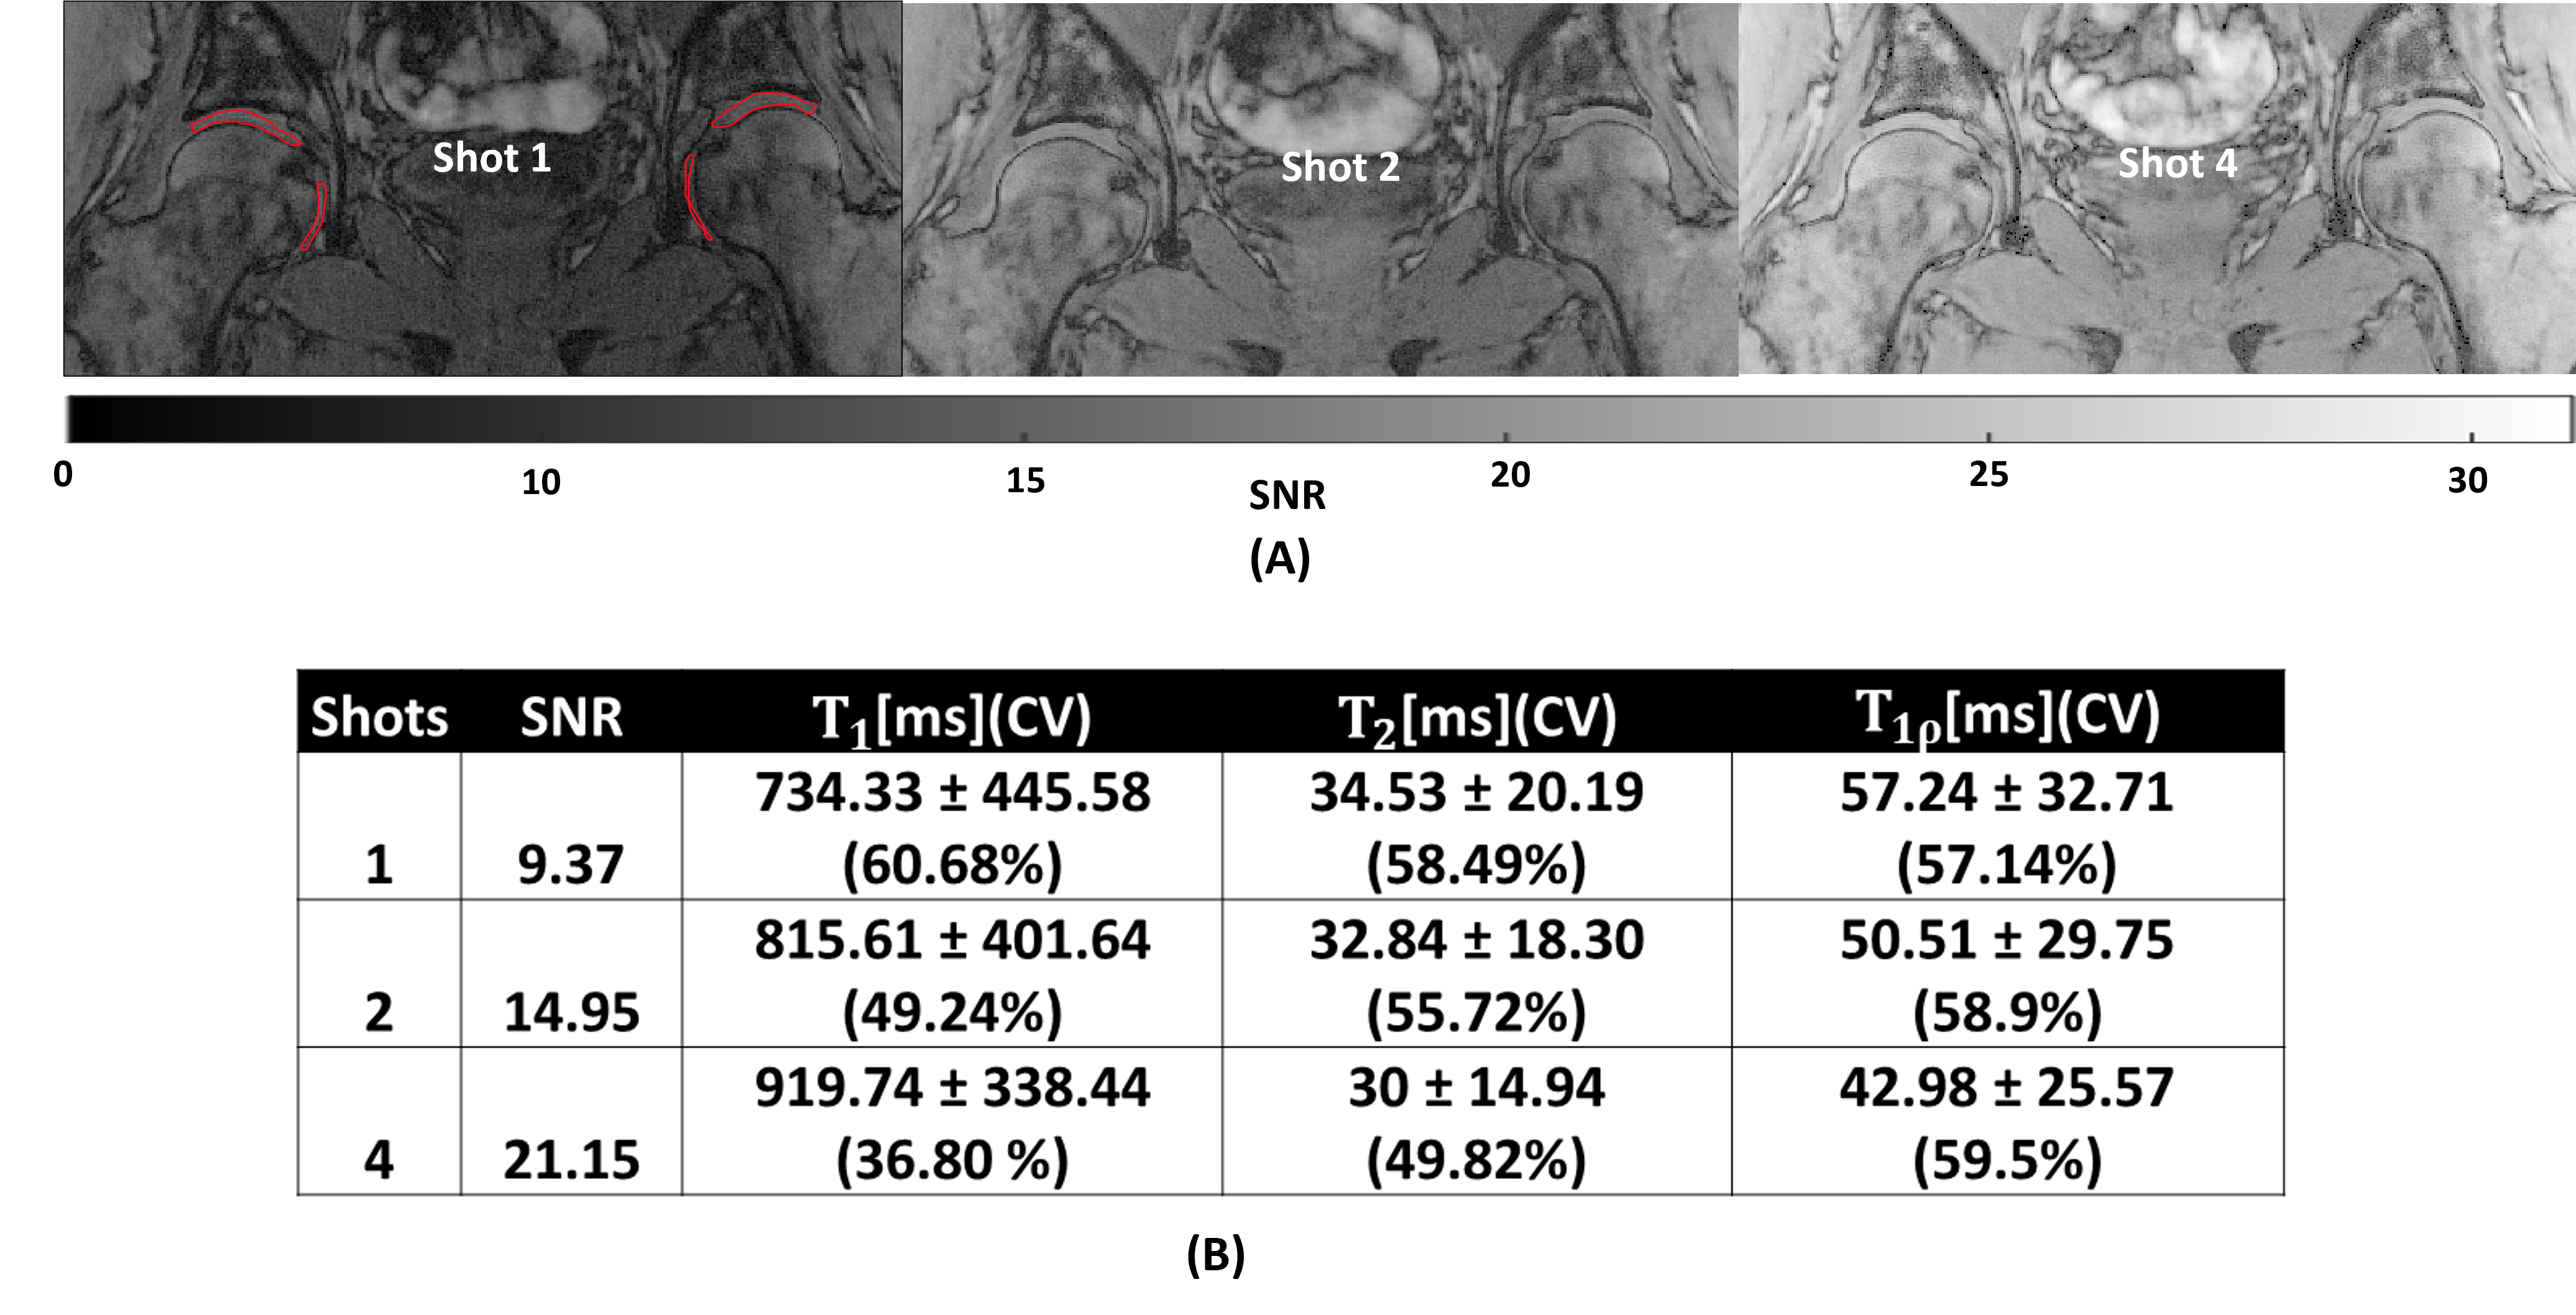
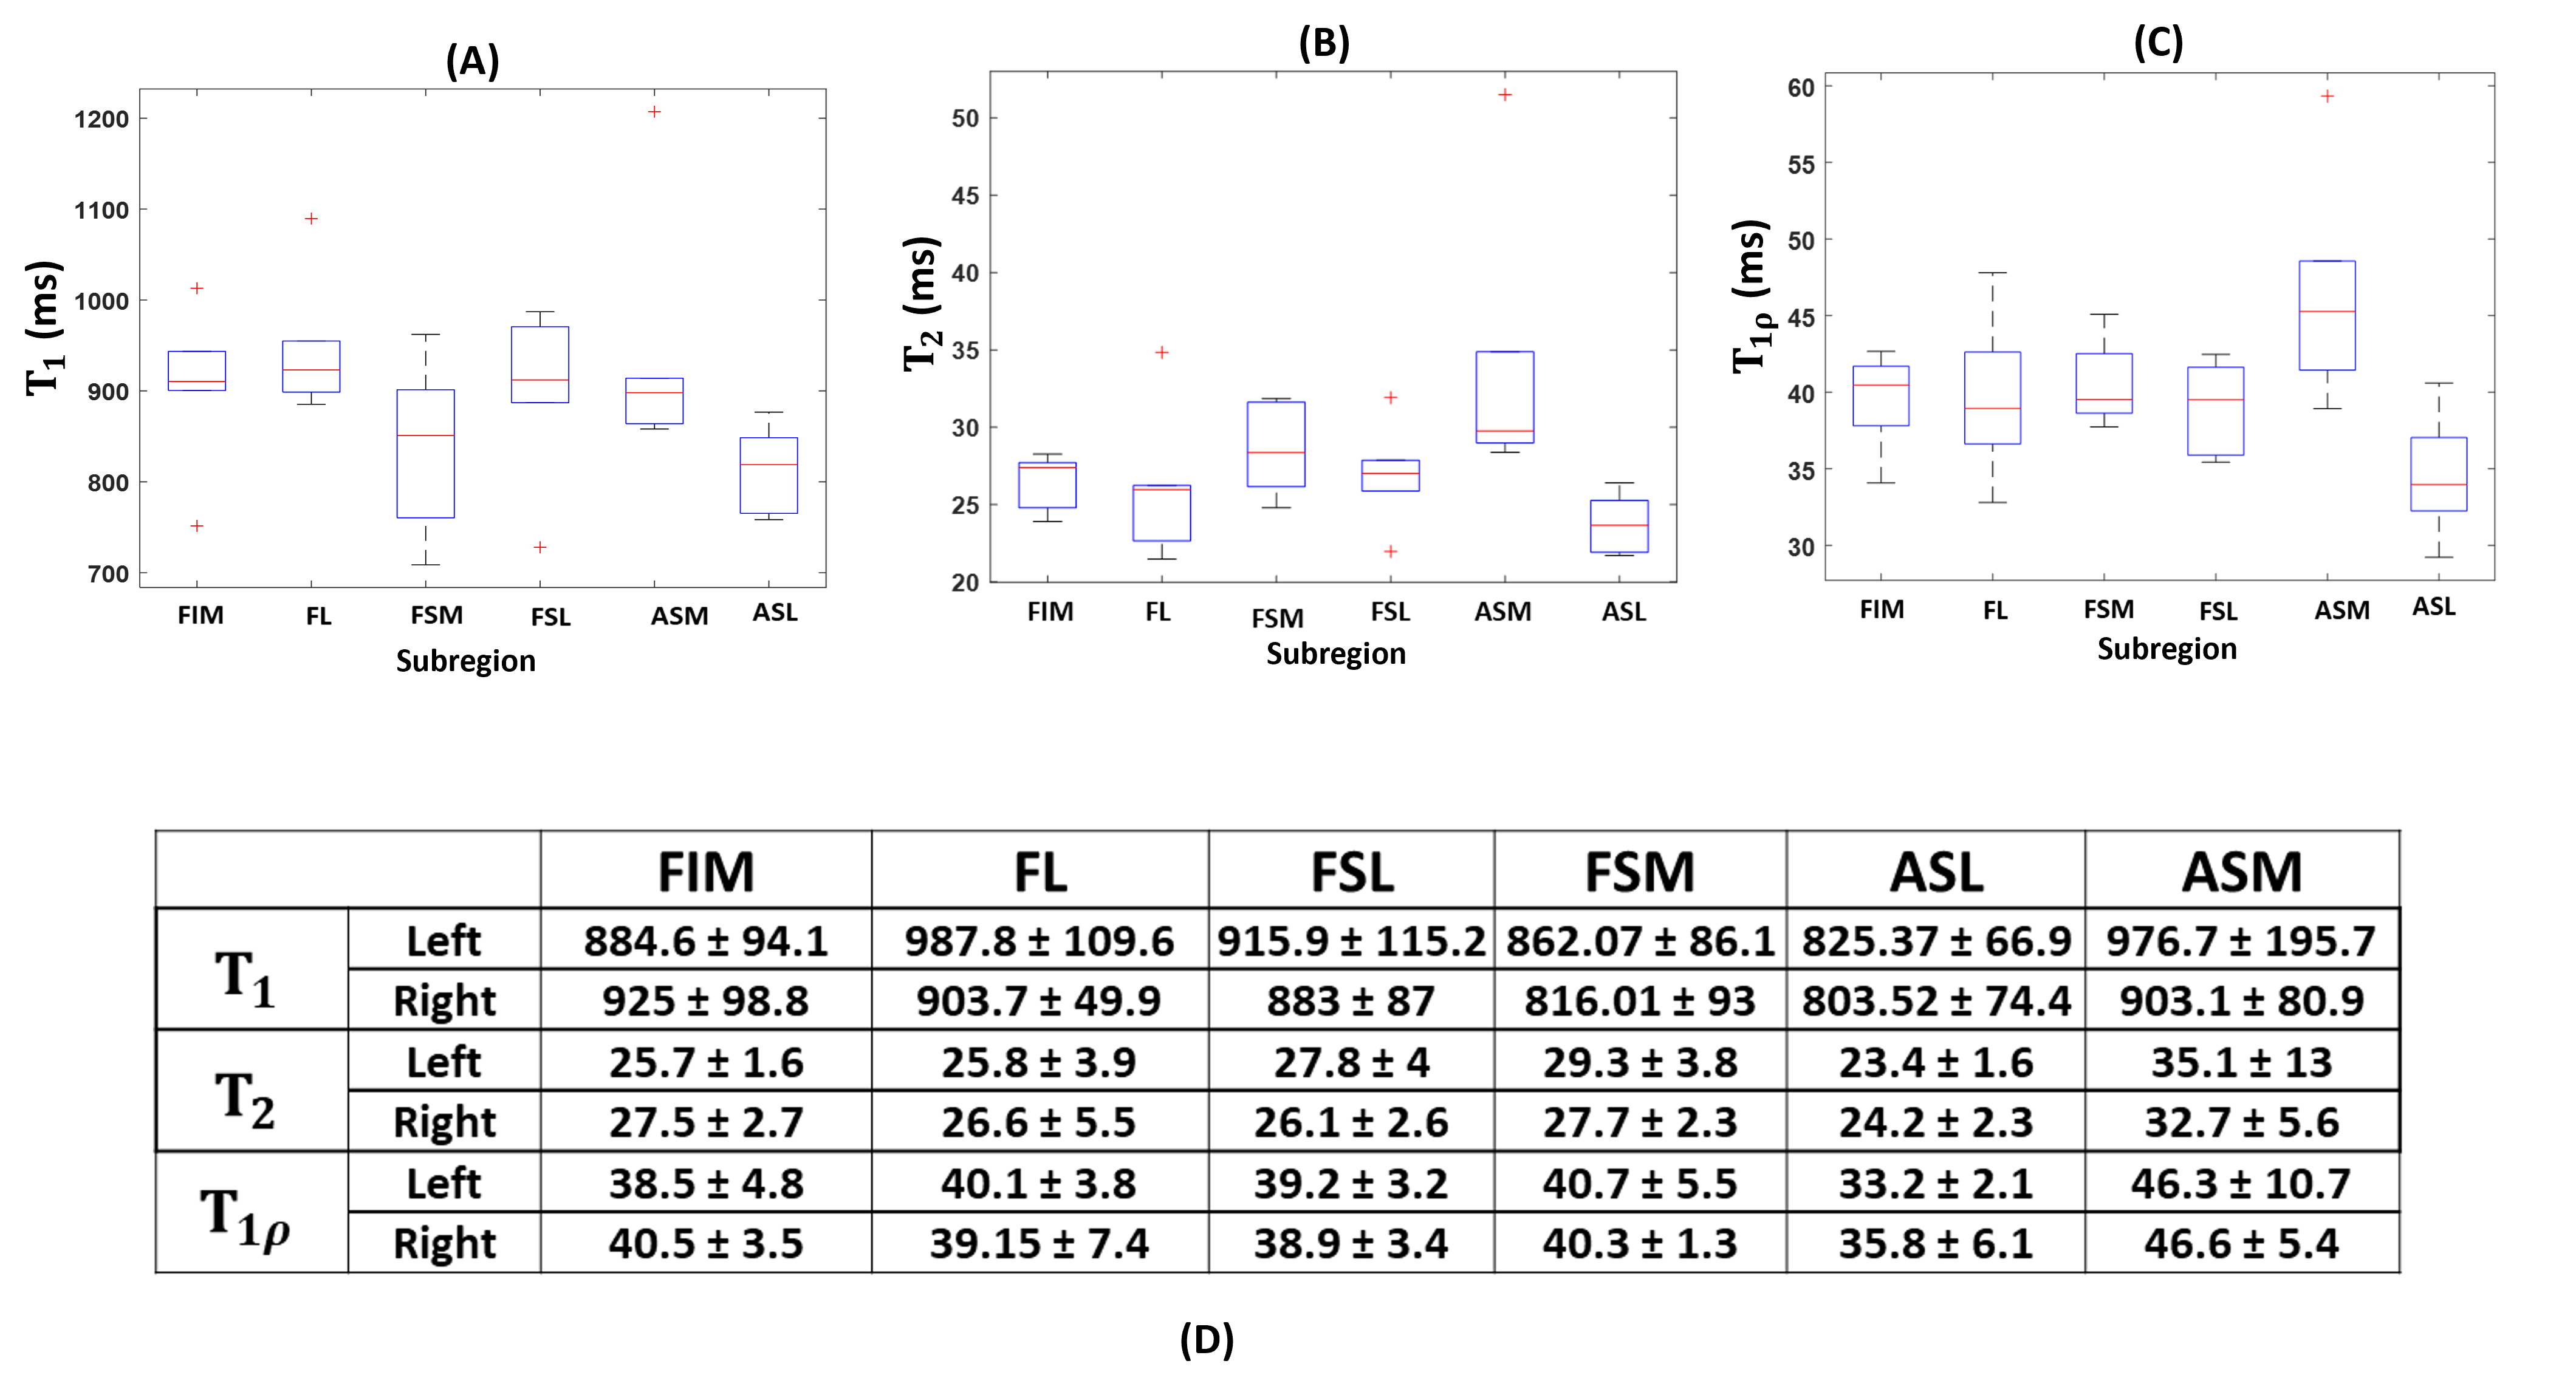
T1, T2, and T1ρ estimated from MRF are significantly correlated (p-value < 0.05) with maps estimated from conventional MRI sequences (Figure 2) like VIBE and TFL (R-squared = 0.889; 0.912 and 0.983 respectively). Figure 3 shows that the SNR for 1-shot, 2-shot, and 4-shot MRF acquisition are 9.37, 14.95, and 21.15 respectively. The 4-shot acquisition has SNR>20 and is suitable for quantitative measurements. Figure 3 shows that the CV of T1 and T2 decreases with an increase in the number of shots but for T1ρ it remains constant. Figure 4 represents the repeatability test of 4-shot MRF acquisition. The difference between the test-retest for T1, T2, and T1ρ are -20.78 ms, -1.604 ms, and 0.5221 ms respectively. The Intrasubject Coefficient of variation for T1 = 6.3%; T2 = 7.4%; T1ρ = 6.6%. There is no significant separability between the articular cartilage in the left hip and right hip for all parametric maps. The femoral and acetabular articular cartilage also show no significant separability. The Kruskall-Wallis test shows significant separability between subregions of the hip for T1, T2, and T1ρ (p-value = 0.04, 0.005, 0.02 respectively). Figure 5 shows that T2 and T1ρ for ASL are 35% and 20% higher compared to the rest of the subregion.DISCUSSION
We showed the feasibility of bilateral hip 3D-MRF in the hip joint. It takes 14 min 11 seconds to acquire 14 slices at 0.7mm x 0.7mm x 3 mm voxel size for the proposed 3D-MRF (1 minute per slice). The proposed approach is faster than the 2D-MRF approach1 (i.e. 3.33 min per slice ) but the intra-subject coefficient of variance (test-retest repeatability) is higher than the 2D-MRF. There is room for further improvement to match the sensitivity and repeatability of 2D-MRF acquisition.CONCLUSION
The feasibility of a 3D-MRF sequence in mapping T1, T2, and T1ρ of hip joints was demonstrated. The measurements are highly correlated with the reference sequence. The intrasubject Coefficient of variation is higher than previous attempts at mapping.Acknowledgements
This study was supported by NIH grants R01-AR076328-01A1, R01-AR076985-01A1, R01-AR078308-01A1, and R21-AR075259-01A1, and was performed under the rubric of the Center of Advanced Imaging Innovation and Research (CAI2R) at NYU Grossman School of Medicine, a NIBIB Biomedical Technology Resource Center (NIH P41 EB017183).References
1. Lattanzi R, Glaser C, Mikheev AV, Petchprapa C, Mossa DJ, Gyftopoulos S, Rusinek H, Recht M, Kim D. A B1-insensitive high resolution 2D T1 mapping pulse sequence for dGEMRIC of the HIP at 3 Tesla. Magn Reson Med. 2011 Aug;66(2):348-55. doi: 10.1002/mrm.23035. Epub 2011 Jun 17. PMID: 21688318; PMCID: PMC5204266.
2. Zibetti MVW, Sharafi A, Regatte RR. Optimization of spin-lock times in T1ρ mapping of knee cartilage: Cramér-Rao bounds versus matched sampling-fitting. Magn Reson Med. 2022 Mar;87(3):1418-1434. doi: 10.1002/mrm.29063. Epub 2021 Nov 4. PMID: 34738252; PMCID: PMC8822470
3. Sharafi A, Zibetti MVW, Chang G, Cloos MA, Regatte RR. Simultaneous bilateral T1 , T2 , and T1ρ relaxation mapping of the hip joint with magnetic resonance fingerprinting. NMR Biomed. 2022 May;35(5):e4651. doi: 10.1002/nbm.4651. Epub 2021 Nov 26. PMID: 34825750; PMCID: PMC9233946.
4. Stupic KF, Ainslie M, Boss MA, Charles C, Dienstfrey AM, Evelhoch JL, Finn P, Gimbutas Z, Gunter JL, Hill DLG, Jack CR, Jackson EF, Karaulanov T, Keenan KE, Liu G, Martin MN, Prasad PV, Rentz NS, Yuan C, Russek SE. A standard system phantom for magnetic resonance imaging. Magn Reson Med. 2021 Sep;86(3):1194-1211. doi: 10.1002/mrm.28779. Epub 2021 Apr 13. PMID: 33847012; PMCID: PMC8252537.
5. Sharafi A, Zibetti MVW, Chang G, Cloos M, Regatte RR. 3D magnetic resonance fingerprinting for rapid simultaneous T1, T2, and T1ρ volumetric mapping of human articular cartilage at 3 T. NMR Biomed. 2022 Dec;35(12):e4800. doi: 10.1002/nbm.4800. Epub 2022 Jul 30. PMID: 35815660; PMCID: PMC9669203.
6. Malik SJ, Teixeira RPAG, Hajnal JV. Extended phase graph formalism for systems with magnetization transfer and exchange. Magn Reson Med. 2018 Aug;80(2):767-779. doi: 10.1002/mrm.27040. Epub 2017 Dec 15. PMID: 29243295; PMCID: PMC5947218.
7. Surowiec RK, Lucas EP, Wilson KJ, Saroki AJ, Ho CP. Clinically Relevant Subregions of Articular Cartilage of the Hip for Analysis and Reporting Quantitative Magnetic Resonance Imaging: A Technical Note. Cartilage. 2014 Jan;5(1):11-5. doi: 10.1177/1947603513514082. PMID: 26069681; PMCID: PMC4297092.
Figures