3545
Evaluating the Diagnostic Efficacy of Cardiac MRI Quantitative Imaging Parameters in Hypertensive Heart Disease During Compensation1Ningxia Hui Autonomous Region People's Hospital, Yinchuan, China, 2Philips Healthcare, Beijing, China
Synopsis
Keywords: Myocardium, Cardiovascular
Motivation: Early detection of hypertensive heart disease (HHD) in the compensatory stage is clinically challenging, necessitating novel evaluative parameters for cardiac function alterations due to HHD.
Goal(s): This research aimed to ascertain the diagnostic value of multiparametric cardiac magnetic resonance (CMR) imaging in this phase.
Approach: We compared cardiac functional parameters, T1 mapping, extracellular volume fraction (ECV), and myocardial strain metrics obtained via CMR among compensatory HHD, decompensated HHD, and a normotensive control group.
Results: Findings reveal that both circumferential and longitudinal strains in the compensatory HHD cohort were significantly reduced compared to the control group (P<0.05).
Impact: Employing quantitative CMR parameters facilitates the assessment of myocardial functional impairments in hypertensive heart disease, potentially unmasking subclinical cardiac dysfunction and providing prognostic value for disease progression.
Introduction
Hypertensive heart disease (HHD) typically emerges several years to over a decade following the onset of hypertension and is categorized based on cardiac functional changes into the compensatory stage (EF≥50%) and the decompensated stage (EF<50%). Decompensated HHD is characterized by left ventricular enlargement and reduced contractility, ultimately leading to left heart failure. In contrast, compensatory HHD is marked by myocardial hypertrophy, with conventional cardiac function remaining essentially indistinguishable from that of healthy individuals. Cardiac magnetic resonance (CMR) is considered the "gold standard"[1] for assessing left ventricular morphology and function. The advancement of CMR quantitative techniques[2] has enabled the early assessment of cardiac functional impairment. This study is designed to investigate the diagnostic efficacy of T1 mapping, ECV, and myocardial strain techniques for HHD in the compensatory stage by comparing healthy controls and individuals with decompensated HHD.Method
This retrospective analysis included CMR images of 10 patients with compensatory HHD, 13 with decompensated HHD, and 11 normotensive individuals. All patients were scanned using a 16-channel torso coil on a Philips 3T scanner (Ingenia CX, Best, the Netherlands), acquiring cine, T1 mapping, and LGE images. Cardiac function parameters such as LVEF, EDV, EDVi, ESVi, SVi, and EDMI were measured using a dedicated CMR post-processing workstation, with semi-automatic measurements of LV, Native T1, ECV mapping, and 3D myocardial strain across different segments. Data were tested for normality and presented as mean ± standard deviation (x̄ ± s) if normally distributed, with comparisons made using one-way ANOVA and LSD post-hoc tests; non-normally distributed measures were expressed as median (interquartile range) and analyzed using the Kruskal-Wallis test. A P-value of <0.05 was considered statistically significant.Results
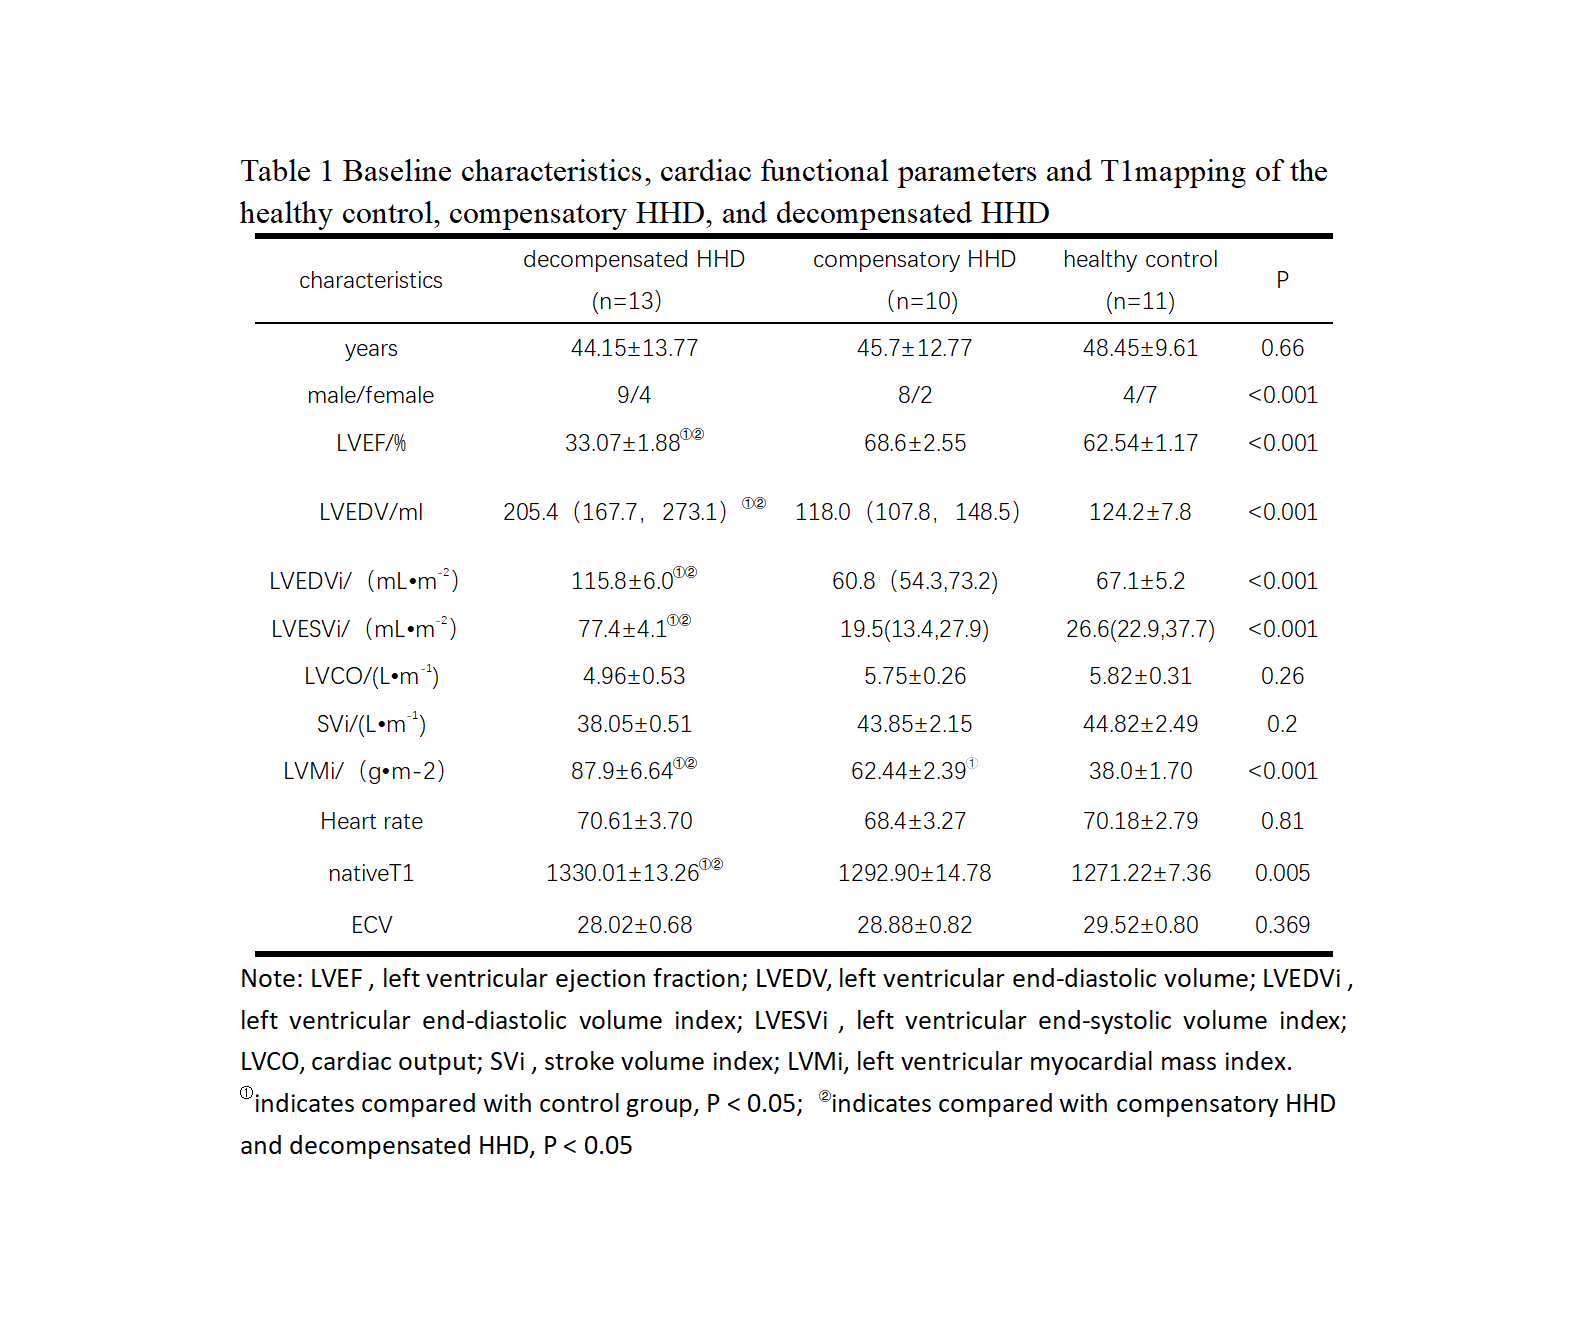
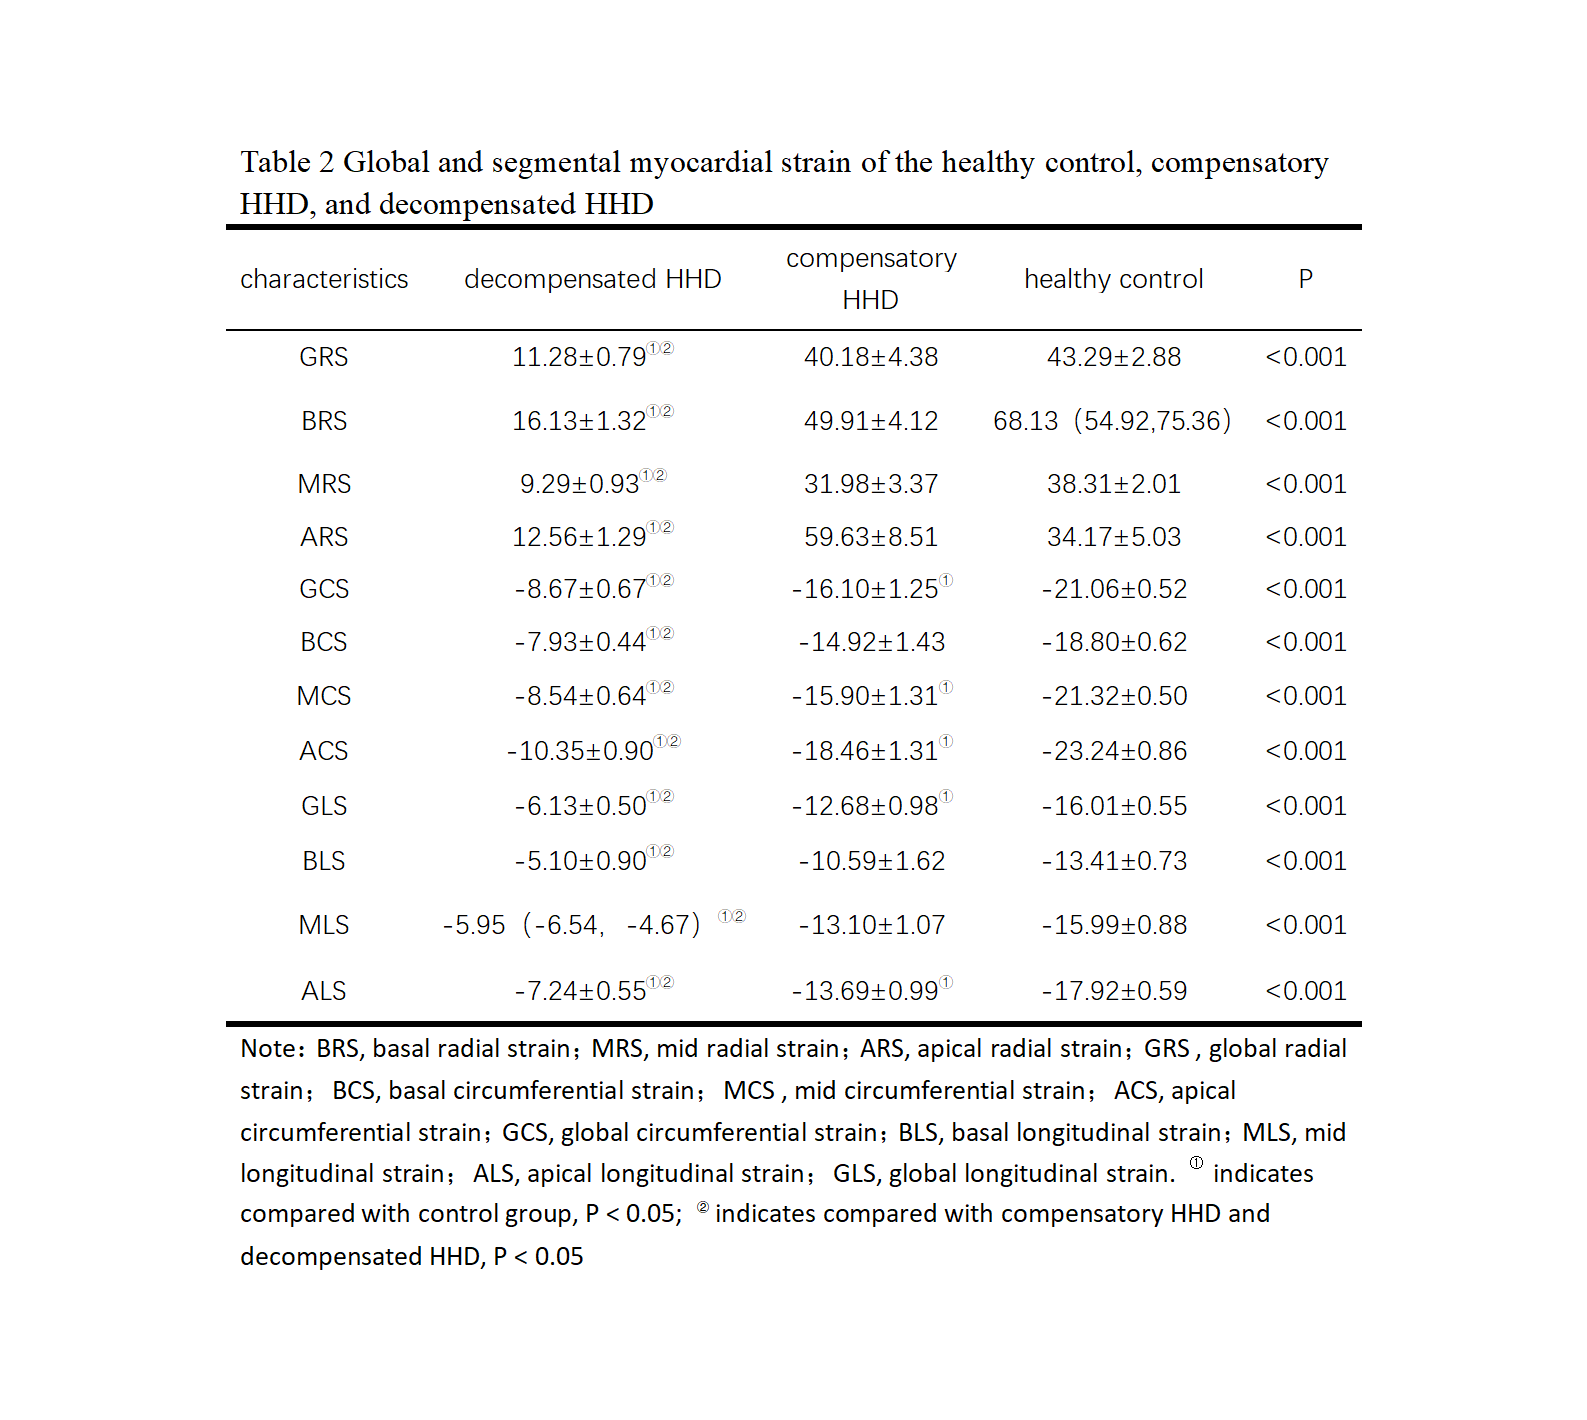
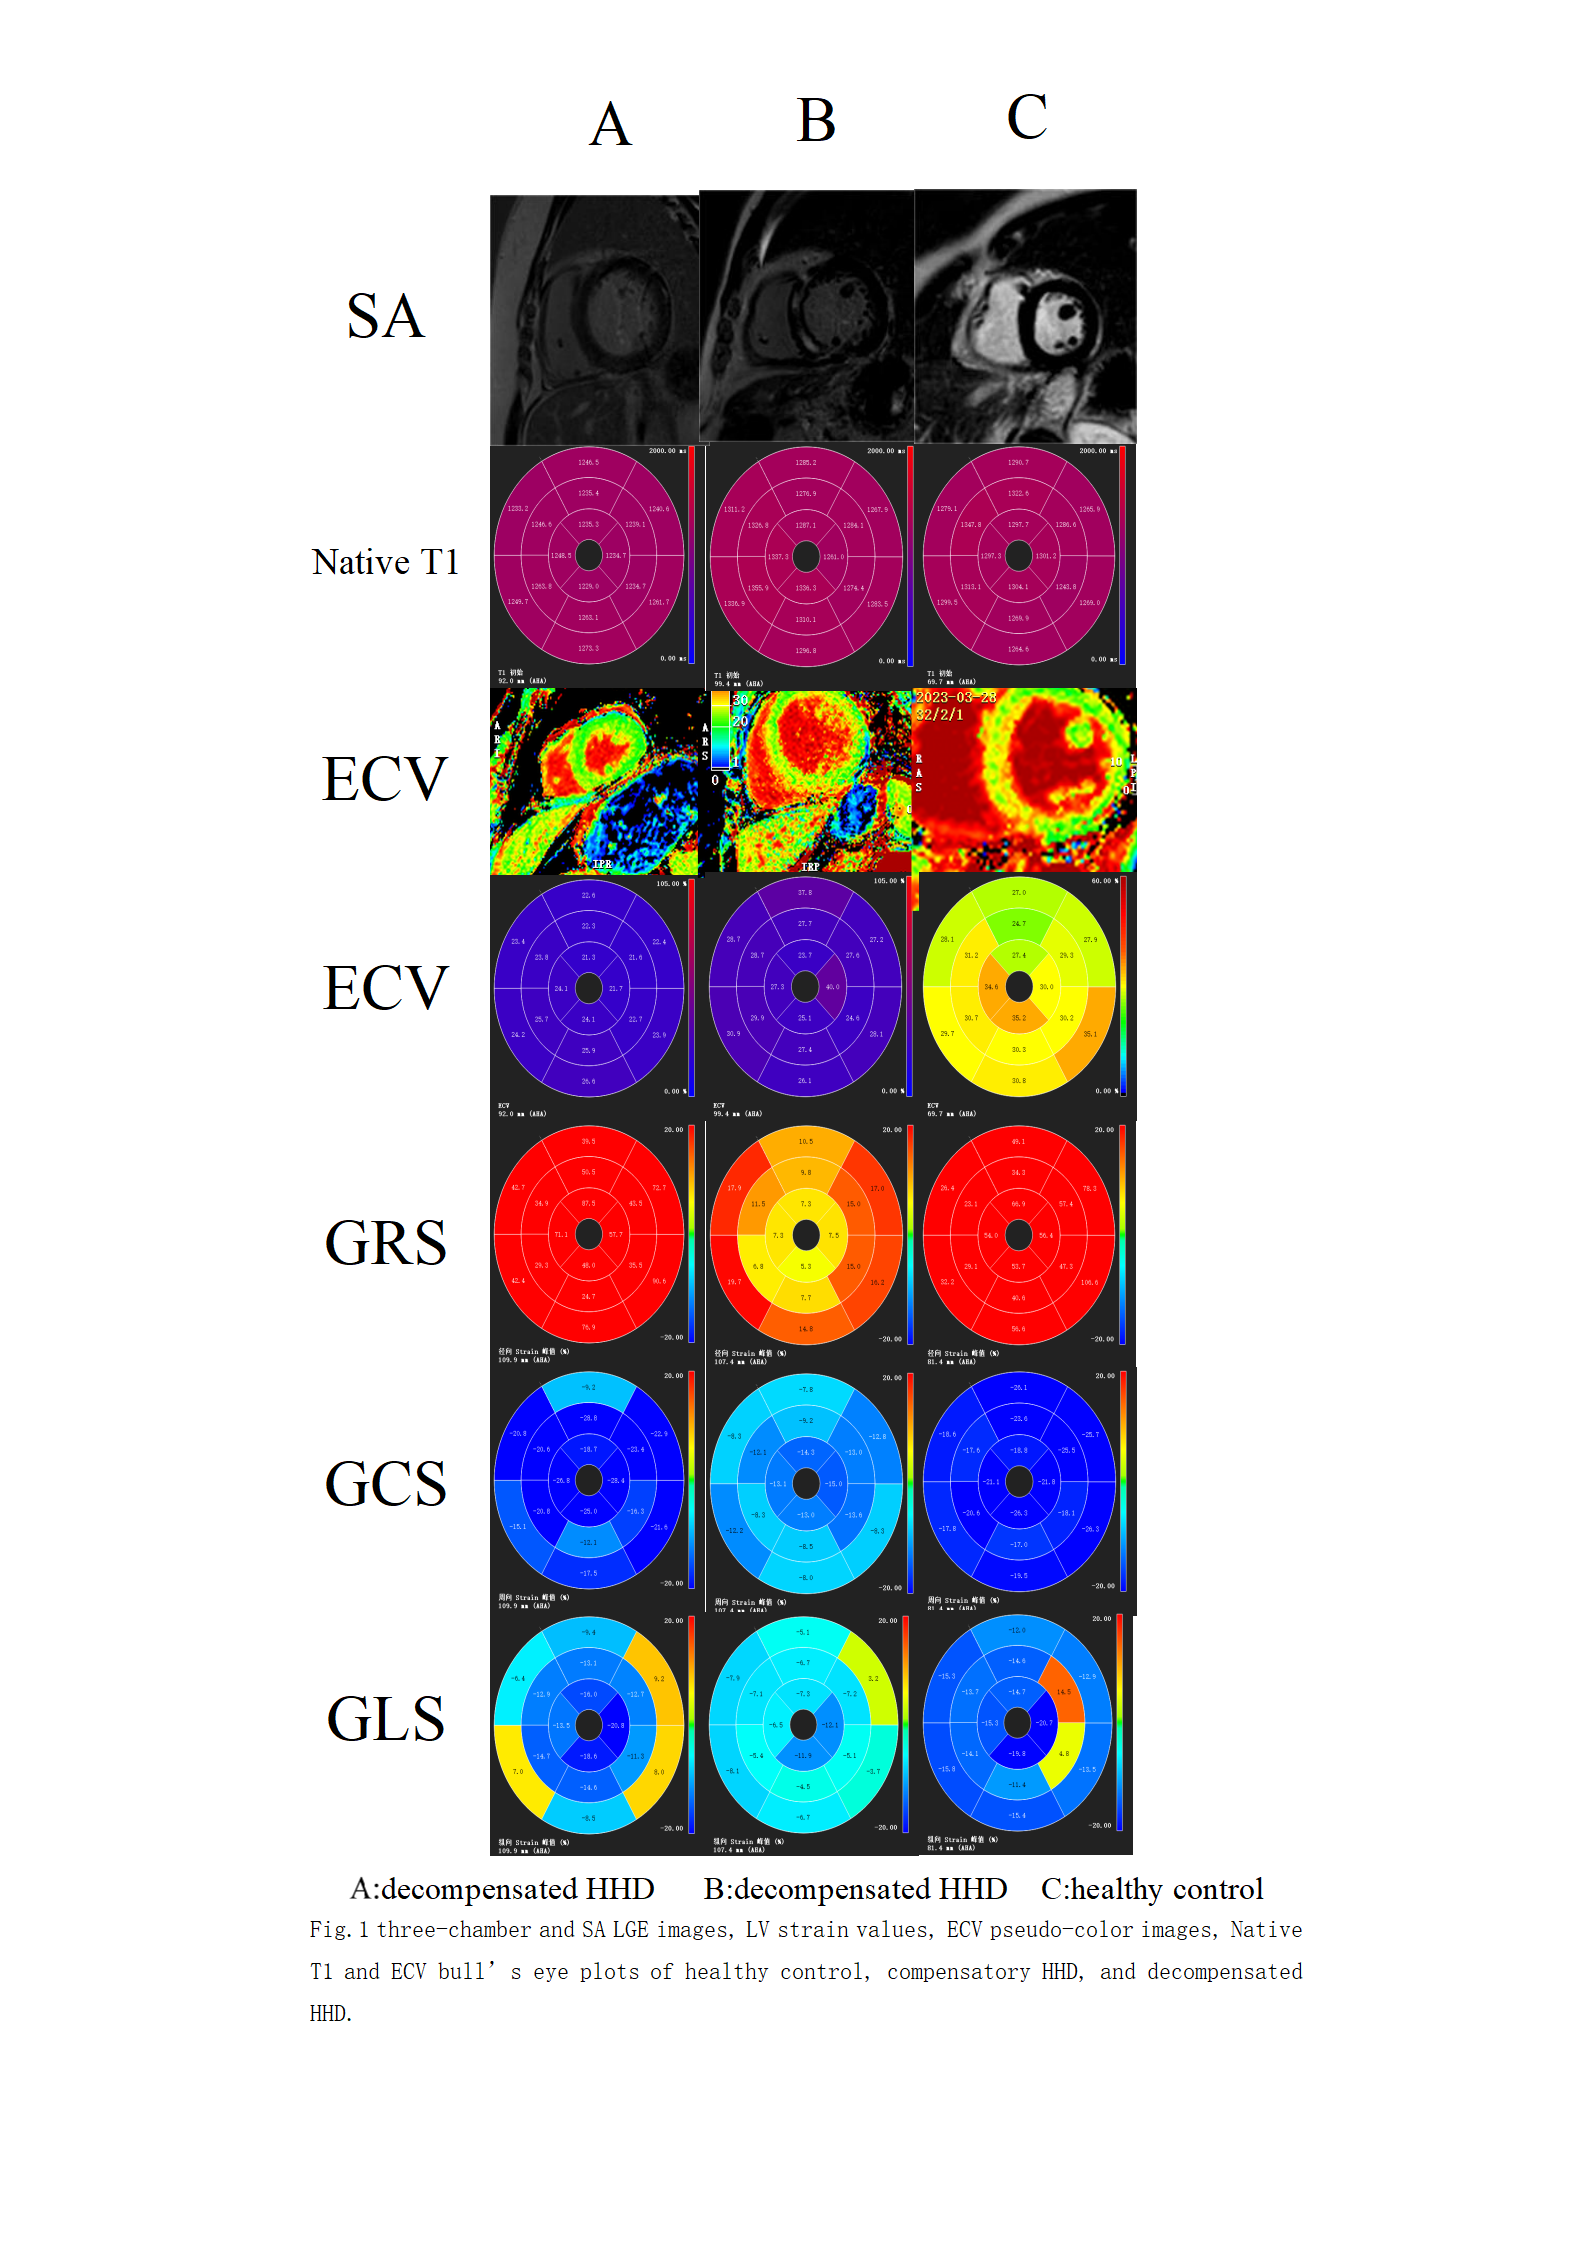
The baseline characteristics and cardiac functional parameters, including T1 Mapping for all three groups, are presented in Table 1. Pairwise comparisons showed that the decompensated group had significantly higher EDV, EDVI, ESVi, and EDMI than the compensatory and control groups (P<0.05). The compensatory group and control group did not differ statistically in EDV, EDVI, and ESVi, but did in EDMI. As Table 1 illustrates, there was a significant difference in native T1 among the groups; the decompensated group had higher native T1 values than the compensatory and control groups (P<0.05), with no difference between the compensatory and control groups. There was no statistical difference in ECV among the groups. The comparison of overall and segmental strain among the three groups was statistically significant, as shown in Table 2. The pairwise comparison revealed that all strain metrics in the decompensated group were lower than those in the compensatory and control groups (P<0.05); GCS, MCS, ACS, GLS, and ALS were lower in the compensatory group compared to the control group (P<0.05), with no other statistical differences.Discussion
This study found that the structural and functional cardiac parameters, such as LVEF, EDV, EDVI, ESVi, and EDMI, were all significantly greater in the decompensated group compared to the compensatory and control groups, with the compensatory group showing only EDMI greater than the control group. This reflects the early occurrence of myocardial hypertrophy in HHD without substantial changes in other cardiac structures. The lack of difference in native T1 and ECV with the control group indicates an absence of significant myocardial fibrosis during the compensatory phase of HHD. The results indicate that both overall and segmental myocardial strain are lower in the decompensated group compared to the compensatory and control groups, while the GCS, MCS, ACS, GLS, and ALS are lower in the compensatory group than in the control group, suggesting a greater sensitivity of circumferential and longitudinal strains in diagnosing HHD during the compensatory stage.Conclusion
Quantitative CMR parameters can serve as a tool for evaluating myocardial functional impairment in patients with hypertensive heart disease. Circumferential and longitudinal strains offer greater sensitivity in diagnosing HHD during the compensatory phase.Acknowledgements
NONEReferences
[1] Andre F, Steen H, Matheis P, et al. Age- and gender-related normal left ventricular deformation assessed by cardiovascular magnetic resonance feature tracking[J]. J Cardiovasc Magn Reson, 2015, 17: 25. DOI: 10.1186/ s12968-015-0123-3.
[2] Ismail TF, Frey S, Kaufmann BA, et al. Hypertensive Heart Disease-The Imaging Perspective. J Clin Med. 2023;12(9):3122. Published 2023 Apr 25. doi:10.3390/jcm12093122.
Figures