3544
Clinical Study of 4D-Flow MRI in Evaluating Abdominal Aortic Compliance in Patients with Chronic Kidney Disease1Department of Radiology, Third Affiliated Hospital of Soochow University, Changzhou, China, 2Philips Healthcare, Shanghai, China
Synopsis
Keywords: Flow, Kidney, Arterial stiffness
Motivation: Arterial stiffness is a key predictor of mortality in chronic kidney disease (CKD) patients.
Goal(s): Use 4D-Flow MRI to noninvasively evaluate the abdominal aortic compliance in CKD patients.
Approach: Thirteen healthy controls and seventy-three CKD patients were enrolled to evaluate the hemodynamic parameters including pulse wave velocity (PWV), peak velocity, and maximum wall shear stress (WSS) for healthy controls and different CKD groups.
Results: CKD patients tend to have an increased PWV and a decreased maximum WSS in the abdominal aorta, compared to healthy controls. Correlations between PWV/WSS and estimated glomerular filtration rate (eGFR) were found.
Impact: Our study shows that PWV tends to increase while WSS tends to decrease for CKD patients compared to healthy controls. Indicating that 4D Flow imaging can be used to assess changes in abdominal aortic compliance in CKD patients.
Introduction
The incidence and mortality rates of cardiovascular events in patients with chronic kidney disease (CKD) increase gradually with the decline of renal function, and arterial stiffness is a strong predictor of overall mortality and cardiovascular mortality in CKD patients [1-2]. 4D-Flow MRI is a commonly used technique for evaluating arterial hemodynamics [3-5], but it has not been applied to study the changes in abdominal aortic hemodynamics caused by CKD. The purpose of this study is to investigate the feasibility of using 4D-Flow MRI to evaluate abdominal aortic compliance in CKD patients.Material and Methods
This study included a total of 86 subjects, with 13 in the control group, 34 in the CKD stage 1-3 group (GFR ≥ 30 mL·min-1 ·1.73 m-2), and 39 in the CKD stage 4-5 group (GFR < 30mL·min-1 ·1.73 m-2). The age range of the subjects was 22 to 70 years, with a mean age of 43 years. All subjects underwent abdominal aorta 4D Flow MRI scans using the Philips Ingenia 3.0T system, including both coronal and sagittal views of the abdominal aorta. The post-processing software (CVI 42) was used to analyze and calculate hemodynamic parameters of the abdominal aorta, including pulse wave velocity (PWV), peak velocity, and maximum wall shear stress (WSS). Planes were placed at the proximal abdominal aorta (plane 1) and at the level of the higher side renal artery opening (plane 2).Non-parametric Kruskal-Wallis test was used to compare the differences in PWV and peak velocity among the three groups, while one-way ANOVA was used to compare the differences in maximum WSS among the three groups. Bonferroni test was employed for pairwise comparisons. Spearman rank correlation analysis was used to evaluate the correlation between hemodynamic parameters and eGFR.
Results
The PWV values for the control group, CKD stage 1-3 group, and CKD stage 4-5 group were 4.65 (4.07, 6.18) m/s, 5.69 (5.09, 6.73) m/s, and 6.25 (5.26, 8.08) m/s, respectively. The maximum WSS values for plane 1 were (0.50 ± 0.13) Pa, (0.36 ± 0.13) Pa, and (0.32 ± 0.10) Pa for the three groups, while for plane 2, the values were (0.45 ± 0.14) Pa, (0.35 ± 0.14) Pa, and (0.33 ± 0.10) Pa, respectively. The differences of peak velocity were not statistically significant in CKD patients compared to healthy controls (P>0.05). Please refer to Figure 2 for graphical representation.There was a negative correlation between PWV and eGFR (r = -0.298, P = 0.006), while there was a positive correlation between maximum WSS for plane 1 and plane 2 and eGFR (r = 0.394,P < 0.01;r = 0.293, P < 0.01).
Discussion
Compared to the control group, CKD patients showed increased PWV and decreased maximum WSS in the abdominal aorta. The negative correlation between PWV and eGFR, as well as the positive correlation between maximum WSS and eGFR, suggests increased stiffness and decreased compliance of the abdominal aorta in CKD patients.Conclusion
4D-Flow MRI can be used to assess changes in abdominal aortic compliance in CKD patients.Acknowledgements
No acknowledgement found.
References
1. Townsend RR (2019) Arterial Stiffness in CKD: A Review. American Journal of Kidney Diseases 73:240-247
2. Ene-Iordache B, Perico N, Bikbov B et al (2016) Chronic kidney disease and cardiovascular risk in six regions of the world (ISN-KDDC): a cross-sectional study. Lancet Global Health 4:e307-e319
3. Soulat G, McCarthy P, Markl M (2020) 4D Flow with MRI. Annual Review of Biomedical Engineering 22:103-126
4. Guala A, Teixido-Tura G, Dux-Santoy L et al (2019) Decreased rotational flow and circumferential wall shear stress as early markers of descending aorta dilation in Marfan syndrome: a 4D flow CMR study. Journal of Cardiovascular Magnetic Resonance 21:63
5. Garcia J, Barker AJ, Markl M (2019) The Role of Imaging of Flow Patterns by 4D Flow MRI in Aortic Stenosis. Jacc-Cardiovascular Imaging 12:252-266
Figures
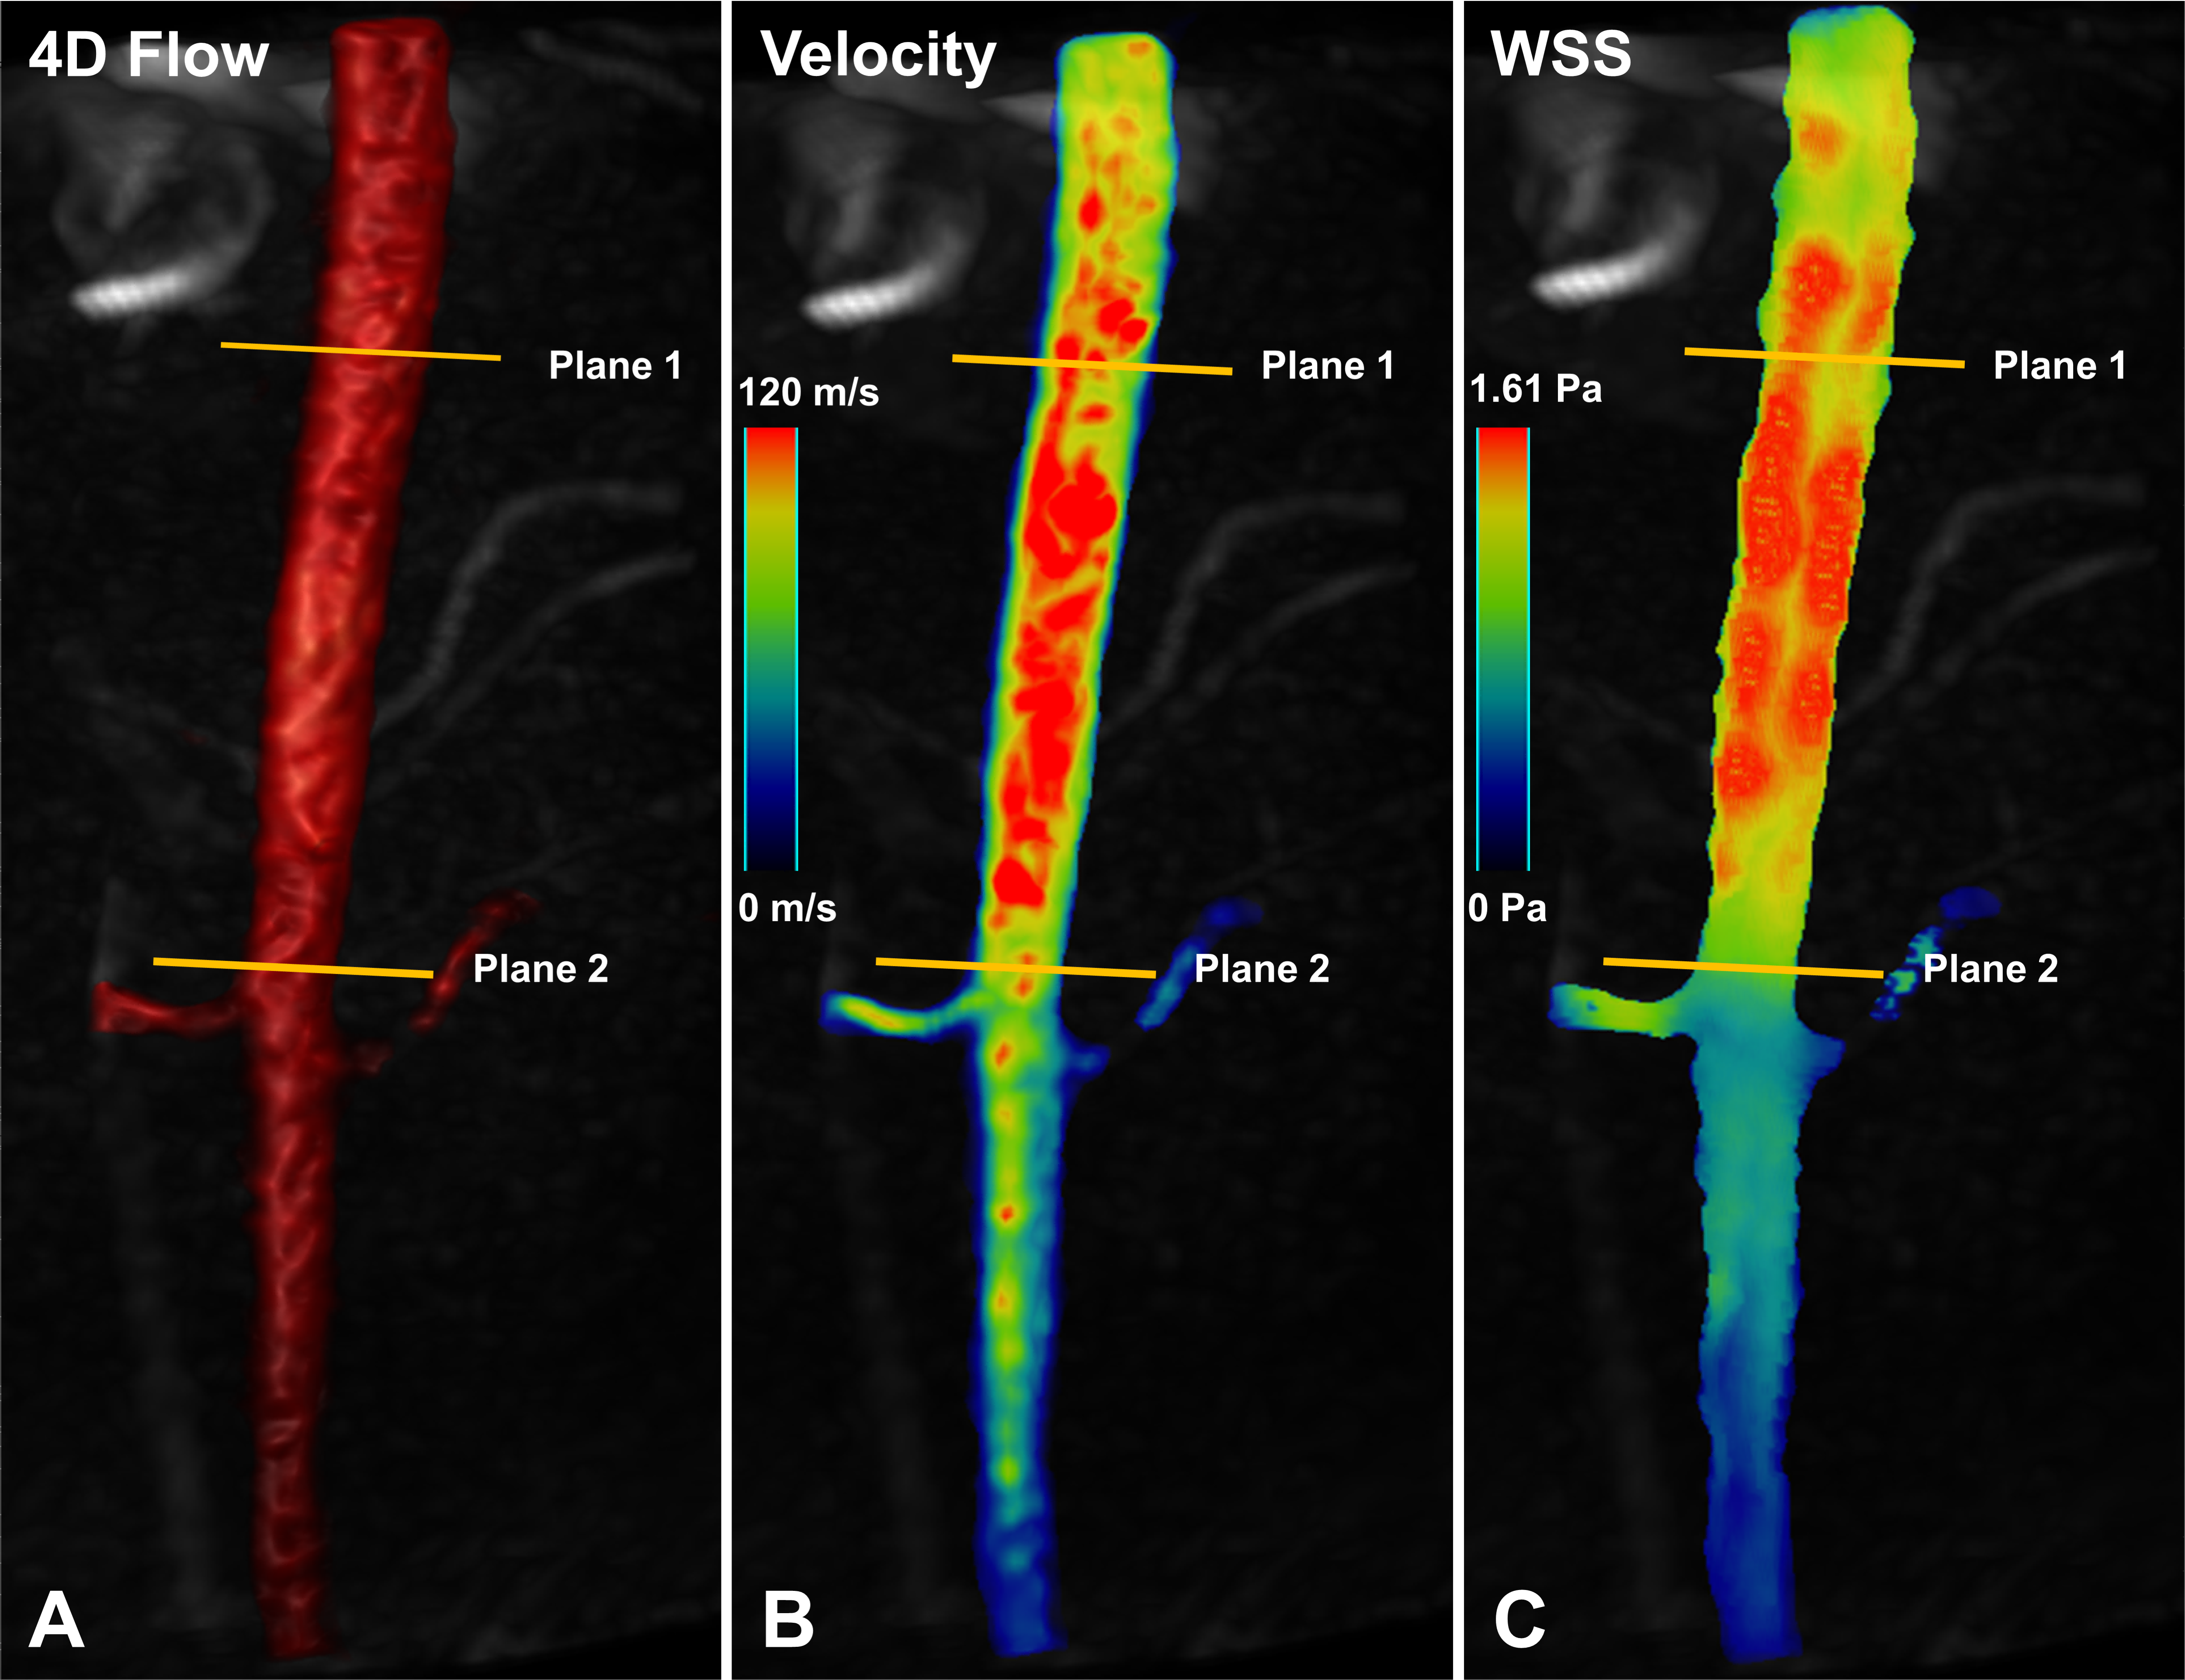
Figure 1 Three-dimensional volume rendering reconstruction image, peak velocity map, maximum wall shear stress (WSS) map of abdominal aorta in 4D-Flow MRI is shown in figure A-C. Planes were placed at the proximal abdominal aorta (plane 1) and at the level of the higher side renal artery opening (plane 2).
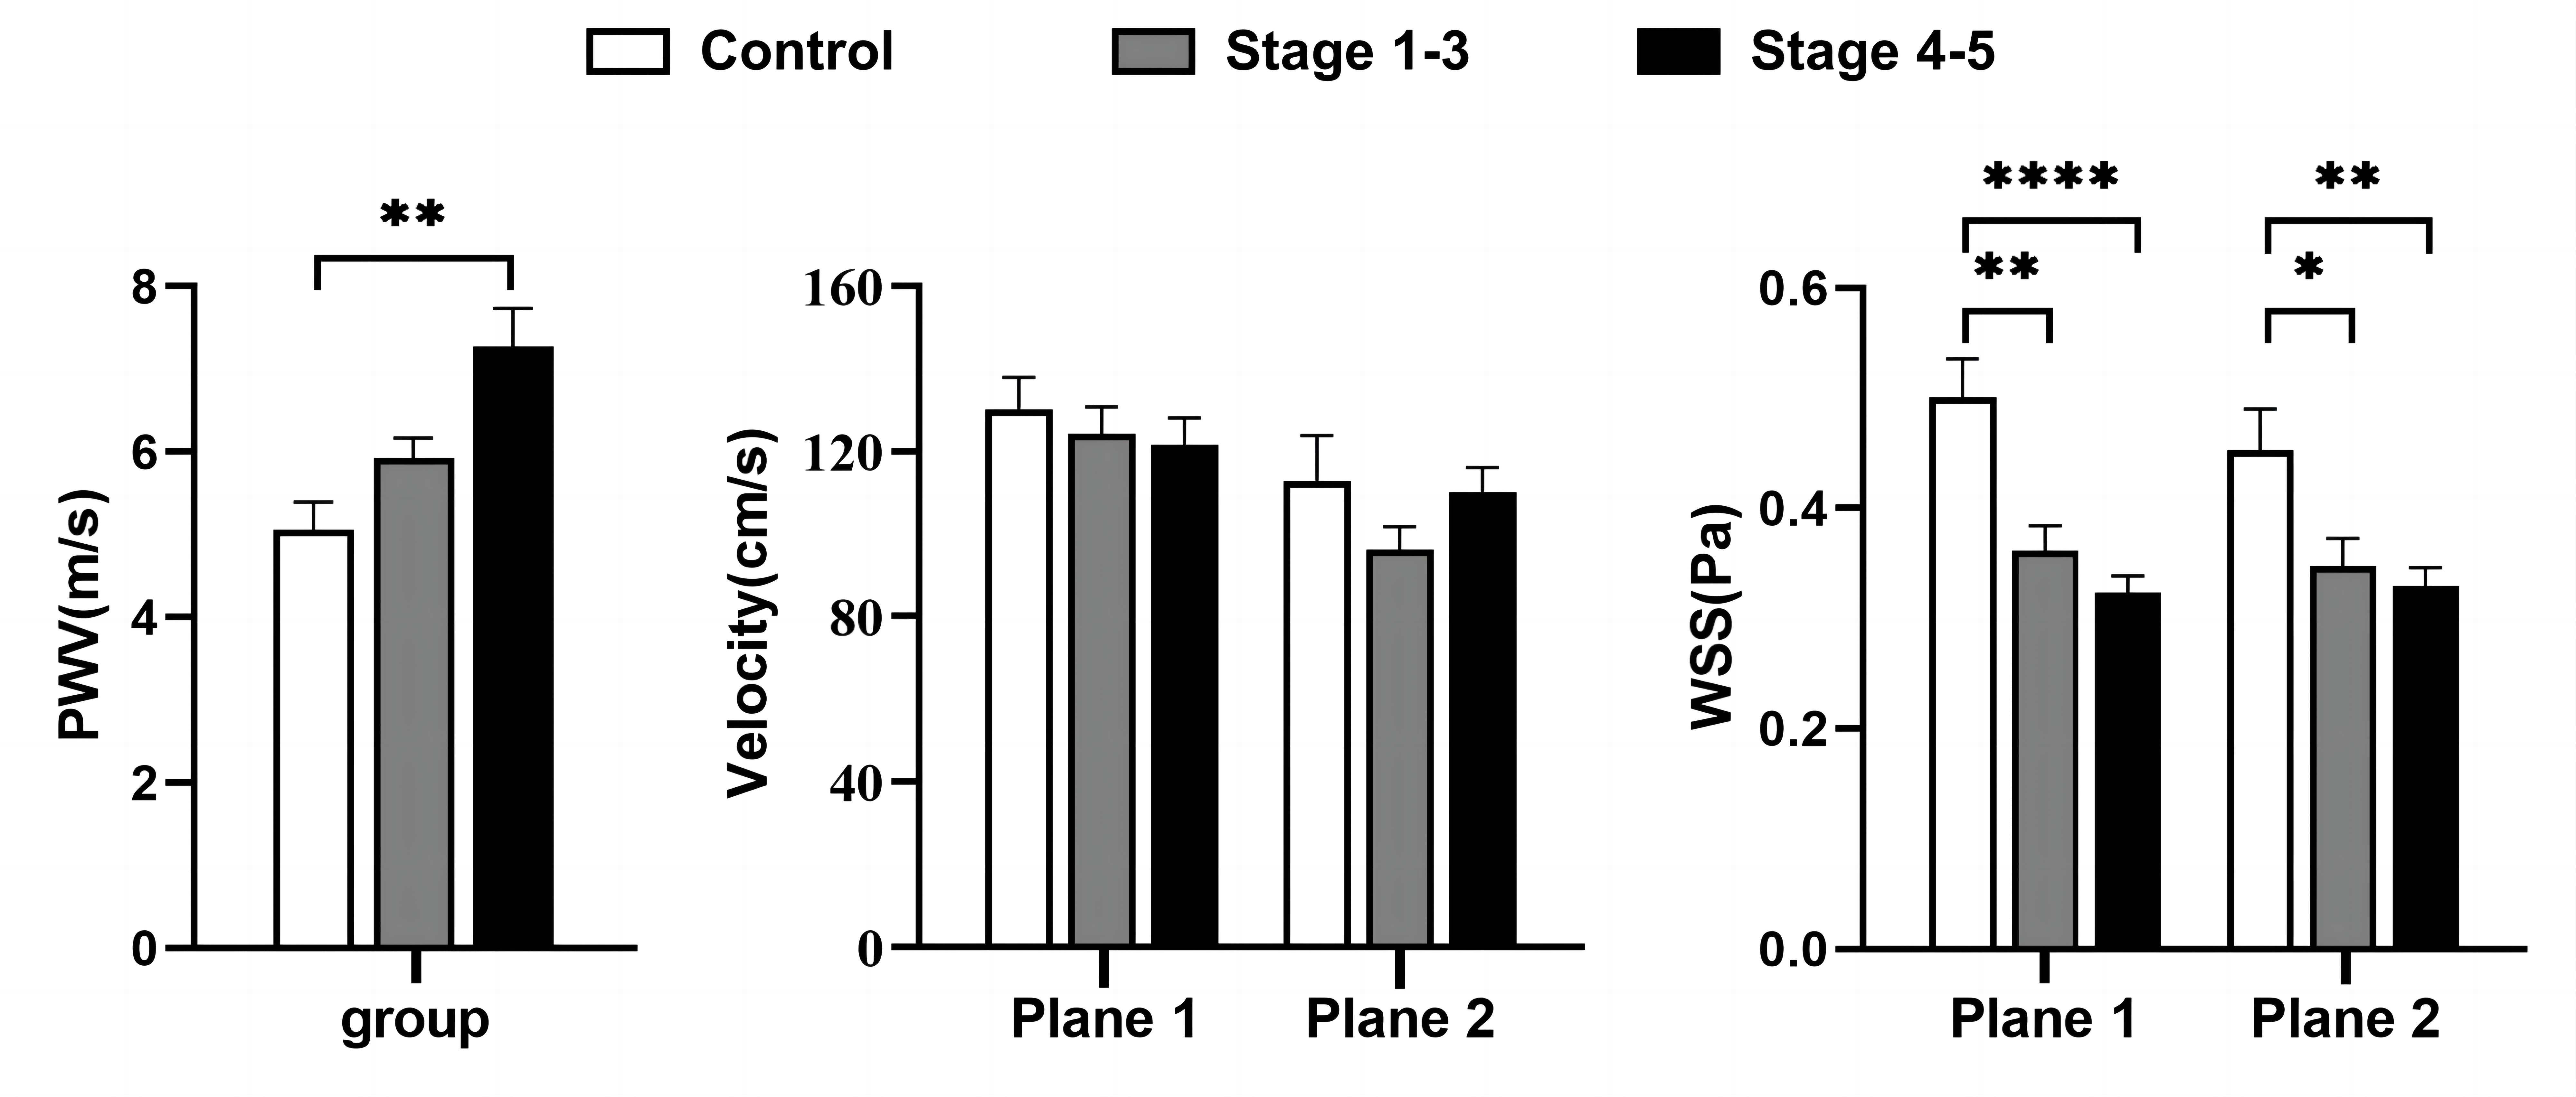
Figure 2 Abdominal aortic hemodynamic parameters (PWV, peak velocity, and maximum WSS) comparing healthy controls with CKD patients. PWV tends to increase while maximum WSS tends to decrease for CKD patients compared to healthy controls. * P <0.05, ** P <0.01, **** P <0.001.
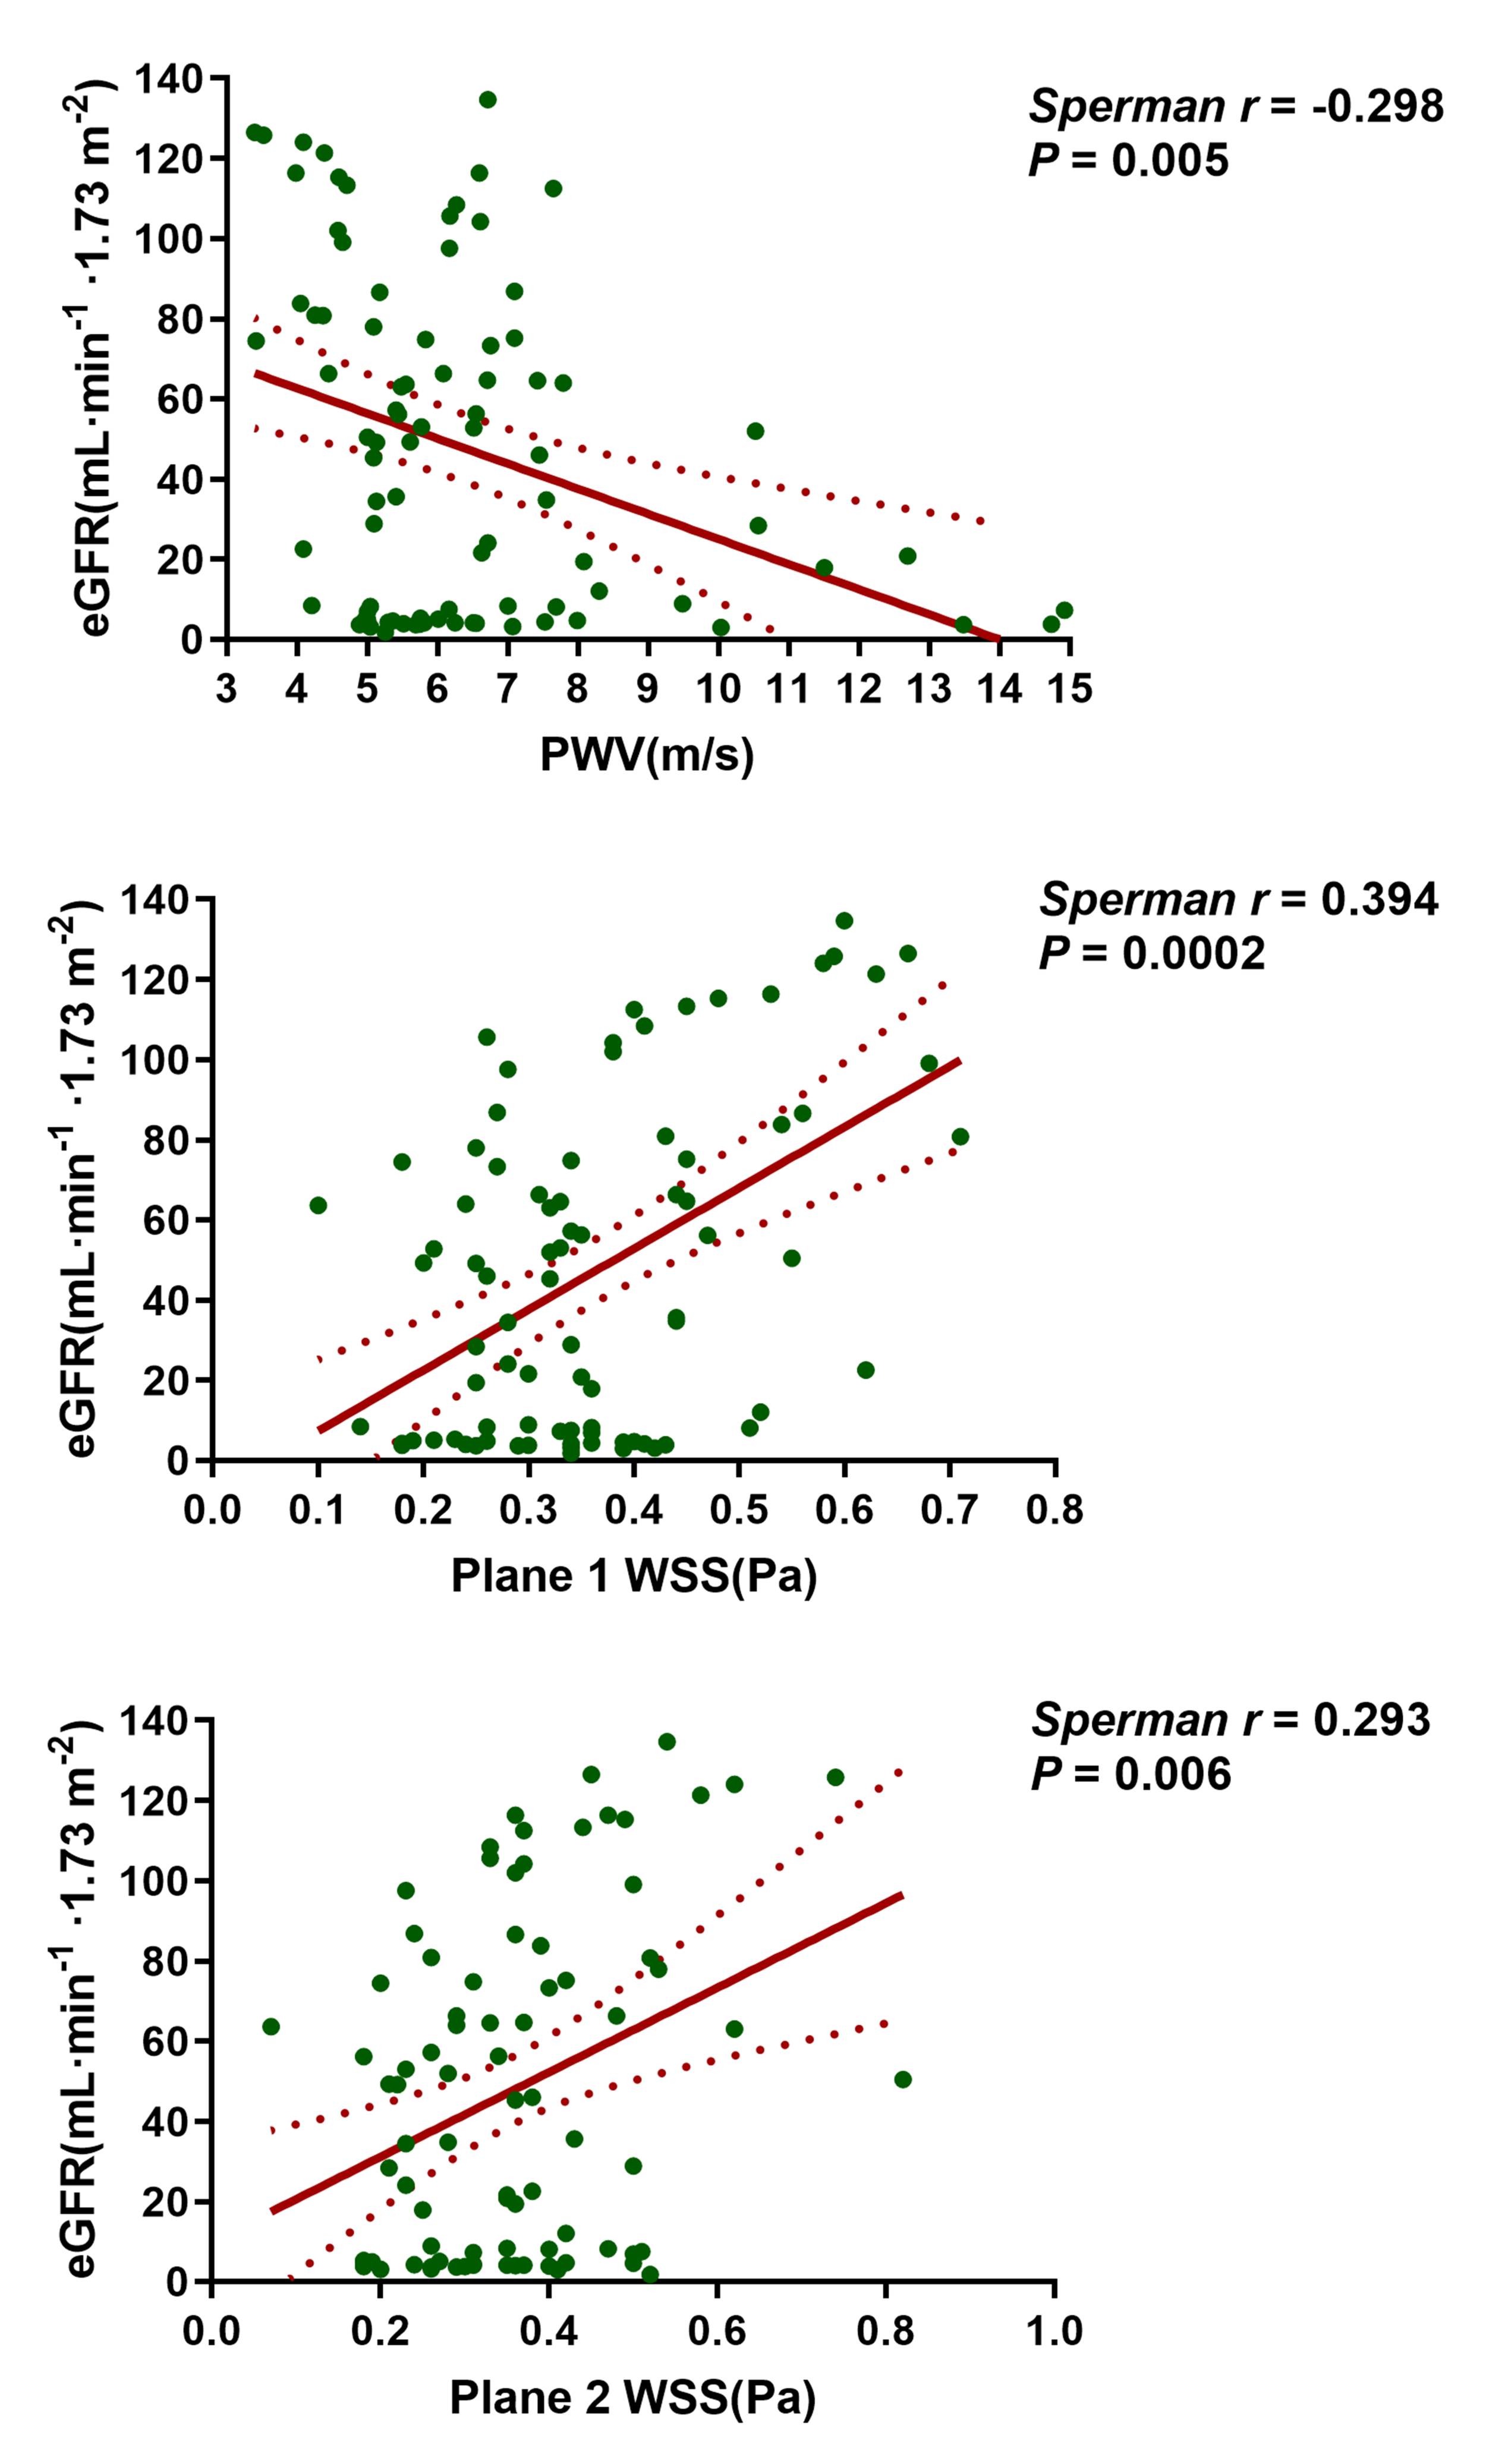
Figure 3 Correlation plots of hemodynamic parameters (PWV and maximum WSS) in abdominal aorta with estimated glomerular filtration rate (eGFR). Correlations between these hemodynamic parameters and eGFR were found.