3539
Assessment of early anthracycline-induced cardiotoxicity and liver injury with T2 and T2* mapping in rabbit models1The Affiliated Hospital of Southwest Medical University, luzhou, China, 2Department of Clinical Science,Philips Healthcare, chengdu, China
Synopsis
Keywords: Myocardium, fMRI
Motivation: Chemotherapy-related cardiotoxicity has garnered more attention, an early assessment of cardiac injury to delay or prevent the occurrence and development of irreversible cardiac injury is vitally important.
Goal(s): T2 mapping and T2* mapping are expected to be used for evaluating early anthracycline-induced cardiotoxicity (AIC) and anthracycline-induced liver injury (AILI).
Approach: We established a rabbit model of anthracycline-induced cardiotoxicity and dynamically observed the occurrence and progression of AIC and AILI using T2 and T2* mapping.
Results: Preliminary results show T2 and T2* mapping showed value one-stop assessment of AIC and AILI.
Impact: Anthracycline-induced cardiotoxicity could be detected by T2 mapping as earlier as the second week, mainly focusing on the 7th, 11th and 12th segments of left ventricle. Combined with T2* mapping, hepatoxicity and supplementary cardiotoxicity were assessed by one-stop scan.
Introduction
An early assessment of cardiac injury to delay or prevent the occurrence and development of irreversible cardiac injury is vitally important 1. T2 mapping has been proven a promising approach for exploring subclinical myocyte injury occurs with early AIC 2-4. Tomonori et al. 5 also suggested that ferroptosis is the primary form of regulated cell death in doxorubicin (DOX) cardiotoxicity. When the storage capacity of ferritin is exceeded, iron is deposited in myocardial tissue as particulate hemosiderin, which disrupts local magnetic field homogeneity, shortening T2* values with progressive ventricular dysfunction 6. Moreover, the liver is another major site for iron deposition, and AILI is becoming an increasingly serious and potential clinical complication 7. Thus, including patients with liver and heart chemotherapeutic toxicity is beneficial. Our goals were to identify the earliest CMR observation point obtained from the sensitive left ventricular myocardial segment, the CMR threshold parameters for detecting cardiotoxicity and liver damage, and to explore the association between AIC and AILI with T2 mapping and T2* mapping.Methods
The institutional review board of our hospital approved all experiments. 20 Rabbits (weight 2 - 3 kg) received weekly injections of doxorubicin and magnetic resonance imaging (MRI)every two weeks for ten weeks. Detailed MR parameters on Philips 1.5T Achieva were listed as below, T2 mapping: Repetition time (TR) = 1000ms, 9 echoes, echo spacing = 9.8 ms, echo time (TE) = 88.2 ms;T2* mapping: TR = 19 ms, 15 echoes, TE1 = 1.17ms, delta TE = 1.2 ms, TE15 = 19.17 ms.Cardiac function, T2 and T2* values were measured on each period (Figure 1). Histopathological examinations were performed after each MRI scan. The earliest sensitive time and the threshold of MRI parameters for detecting AIC and AILI based on these MRI parameters were obtained. Moreover, the relationship between myocardial and liver damage was assessed.Results
Early AIC could be detected by T2 mapping as early as the second week and focused on the 7th, 11th and 12th segments of left ventricle. T2* mapping could detect the change in iron content for early AIC at the middle interventricular septum and AILI as early as the sixth week(Figure 2). T2* mapping could be used as a complement to T2 mapping to evaluate cardiotoxicity and as an effective index to detect iron change in the early stages of chemotherapy. The T2* values of the middle interventricular septum showed a significant positive association with the T2* values of the liver, indicating that iron content in the liver and heart increased with an increase in the chemotherapeutic drugs.Discussion
In the rabbit model of anthracycline-induced cardiotoxicity with CMR evaluation, we demonstrated that the degree of injury was not synchronous in different segments of the myocardium, and the change in T2 value in the local myocardium occurred earlier than in the whole middle myocardium. In the second to fourth week, we found on pathology left lateral wall myocardial fiber thinning and even dissolution, consistent with the sites of T2 value reduction. These findings suggest that exposure to anthracyclines may lead to early stress-induced cardiomyocyte atrophy, reducing cell sizes and their water content and leading to a temporary decrease in T2 values. These findings have important clinical significance for selecting an appropriate time point for CMR screening of cardiotoxicity and focusing on unique segments of the left ventricle and the T2 threshold value for the diagnosis of cardiotoxicity. We found that the T2* values of the myocardium showed a statistically significant decrease in the sixth week , We speculated whether the increase of myocardial iron content led to the initiation of ferroptosis and further aggravated the progression of myocardial cell injury and death. Morever, we found that the T2* values of the liver decrease in the sixth week,but it did not reach the iron overload threshold However, myocardial T2* levels had fallen to the threshold for iron overload at the eighth week. This finding suggested that changes in iron levels in the heart may occur earlier and more severely than in the liver, meaning that chemotherapeutic drugs are preferentially deposited into cardiomyocytes. Thus, attention should be paid to the changes in iron content in these two organs induced by chemotherapy, and a one-stop scan of the liver and heart is clinically desirable.Conclusion
Anthracycline-induced cardiotoxicity could be detected by T2 mapping as earlier as the second week, mainly focusing on the 7th, 11th and 12th segments of left ventricle. Combined with T2* mapping, hepatoxicity and supplementary cardiotoxicity were assessed by one-stop scan.Acknowledgements
NoReferences
1.Ferreira D, Souza T, Quinaglia T, Neilan TG, Coelho-Filho OR Assessment of cardiotoxicity of cancer chemotherapy: The value of cardiac MR imaging. Magn Reson Imaging Clin N Am 2019;27(3):533-544.
2.Galán-Arriola C, Lobo M, Vílchez-Tschischke JP et al Serial magnetic resonance imaging to identify early stages of anthracycline-induced cardiotoxicity. J Am Coll Cardiol 2019;73(7):779-791.
3.Park HS, Hong YJ, Han K et al Ultrahigh-field cardiovascular magnetic resonance T1 and T2 mapping for the assessment of anthracycline-induced cardiotoxicity in rat models: validation against histopathologic changes. J Cardiovasc Magn Reson 2021;23(1):76.
4.Tahir E, Azar M, Shihada S et al Myocardial injury detected by T1 and T2 mapping on CMR predicts subsequent cancer therapy-related cardiac dysfunction in patients with breast cancer treated by epirubicin-based chemotherapy or left-sided RT. Eur Radiol 2022;32(3):1853-1865.
5.Tadokoro T, Ikeda M, Ide T et al Mitochondria-dependent ferroptosis plays a pivotal role in doxorubicin cardiotoxicity. JCI Insight 2020; 5(9):e132747.
6.Anderson LJ, Holden S, Davis B et al Cardiovascular T2-star (T2*) magnetic resonance for the early diagnosis of myocardial iron overload. Eur Heart J 2001;22(23):2171-2179.
7.Bai H, Kong F, Feng K et al Prussian blue nanozymes prevent anthracycline-induced liver injury by attenuating oxidative stress and regulating inflammation. ACS Appl Mater Interfaces 2021;13(36):42382-42395.
Figures
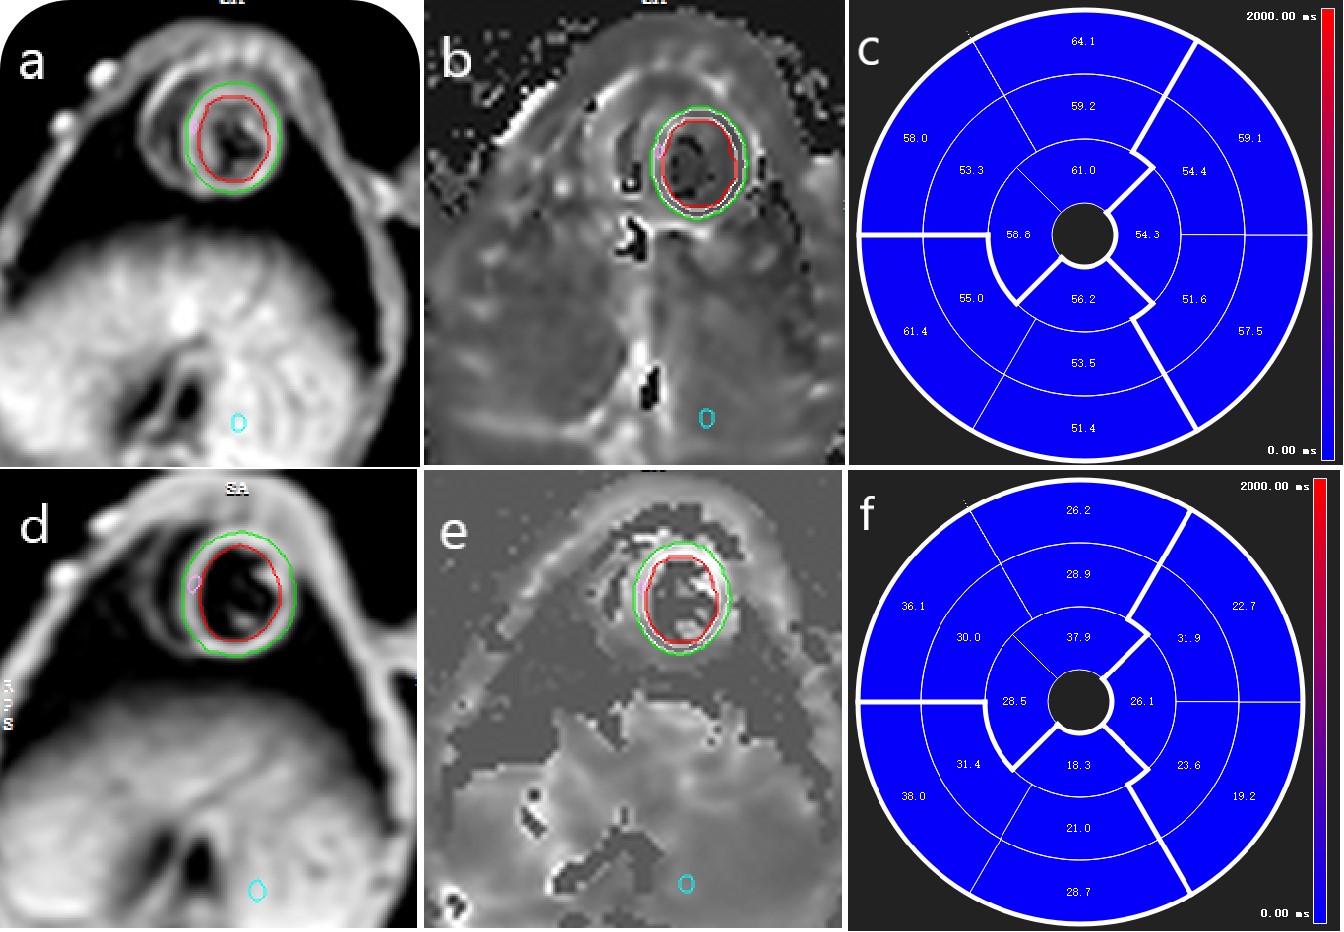
Figure 1 Measurement diagrams of T2 and T2* mapping
Endocardial (red circle) and epicardial borders (green circle) of the left ventricular wall were delineated semi-automatically for myocardial T2 mapping (a) and T2*mapping (d). A region of interest (ROI, pink circle) was drawn in the left ventricular septum at the mid-ventricle level (a, d).The ROI(blue circle) was drawn in specific liver lesions at the same level (a, d). Then, copy the same regions as described above onto the generated T2 (b) and T2* (e) mapping maps. The corresponding Bull's eye were automatically obtained.
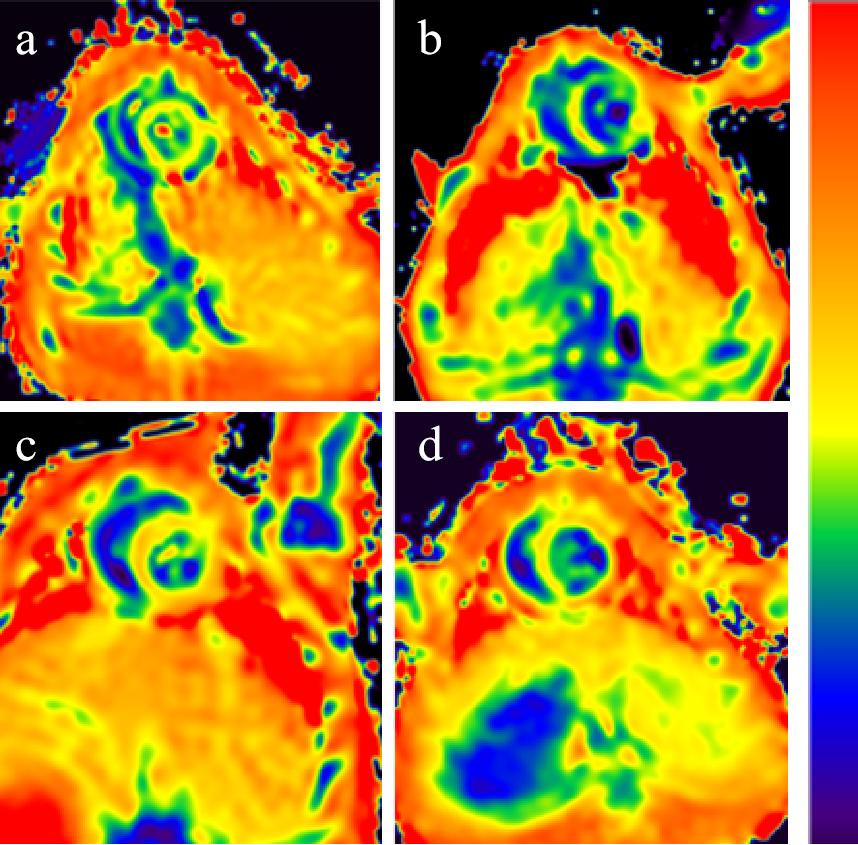
Figure 2 Examples of T2 and T2* maps in Controls and Models.
Uniform yellow normal myocardium shown on the T2 map (baseline rabbit) (a). Four-week model, yellow 7th, 10th,11th and 12th segments of left ventricular wall changed to yellow-green (T2 values decreased) (b). Uniform orange-yellow normal myocardium shown on the T2* map (baseline rabbit) (c). Six-week, the T2* values of the middle interventricular septum and liver decreased, the color changed from orange-yellow to yellow (d).