3536
Imaging the 3D Structure of Sinoatrial Node Using Rotating Frame Relaxation Maps in the Swine Heart1Research Unit of Health Sciences and Technology, University of Oulu, Oulu, Finland, 2Department of Radiology, Oulu University Hospital, Oulu, Finland
Synopsis
Keywords: Myocardium, Myocardium, Relaxometry,Novel Contrast Mechanisms,Ex-Vivo Applications
Motivation: Rotating frame relaxation mapping can detect fibrotic tissue and may offer contrast agent-free method for imaging the sinoatrial node (SAN).
Goal(s): To identify SAN from the surrounding myocardium using RAFF2 and T1ρ maps.
Approach: RAFF2, T1ρ, T1 and T2 maps, and MT imaging were performed on ex vivo swine hearths at 7T and 3T. SAN location was validated with Masson’s trichrome histology sections.
Results: Relaxation time differences between SAN and myocardium were found in all imaging methods. TRAFF2 and T1ρ demonstrated higher contrast than other methods. SAN can be distinguished as area with elevated relaxation times in TRAFF2 maps.
Impact: Detection and visualization of 3D SAN structure can be done using RAFF2 and T1ρ relaxation time maps without contrast agents.
Introduction
The sinoatrial node (SAN) is known as the pacemaker of the heart, and it has a specialized ellipsoidal fibrotic structure. Late gadolinium enhanced cardiovascular magnetic resonance (LGE-CMR) has been previously applied to visualize SAN structure in vivo 1. The connective tissue within the SAN may provide the opportunities to visualize the SAN. Relaxation along fictious field (RAFF) and T1 in rotating frame (T1ρ) have been applied to measure myocardial fibrosis in human and mouse models earlier 2,3,4,5. The aim of this study was to investigate the feasibility of rotating frame relaxation time mappings to identify the SAN structure in ex vivo swine heart without contrast agents.Methods
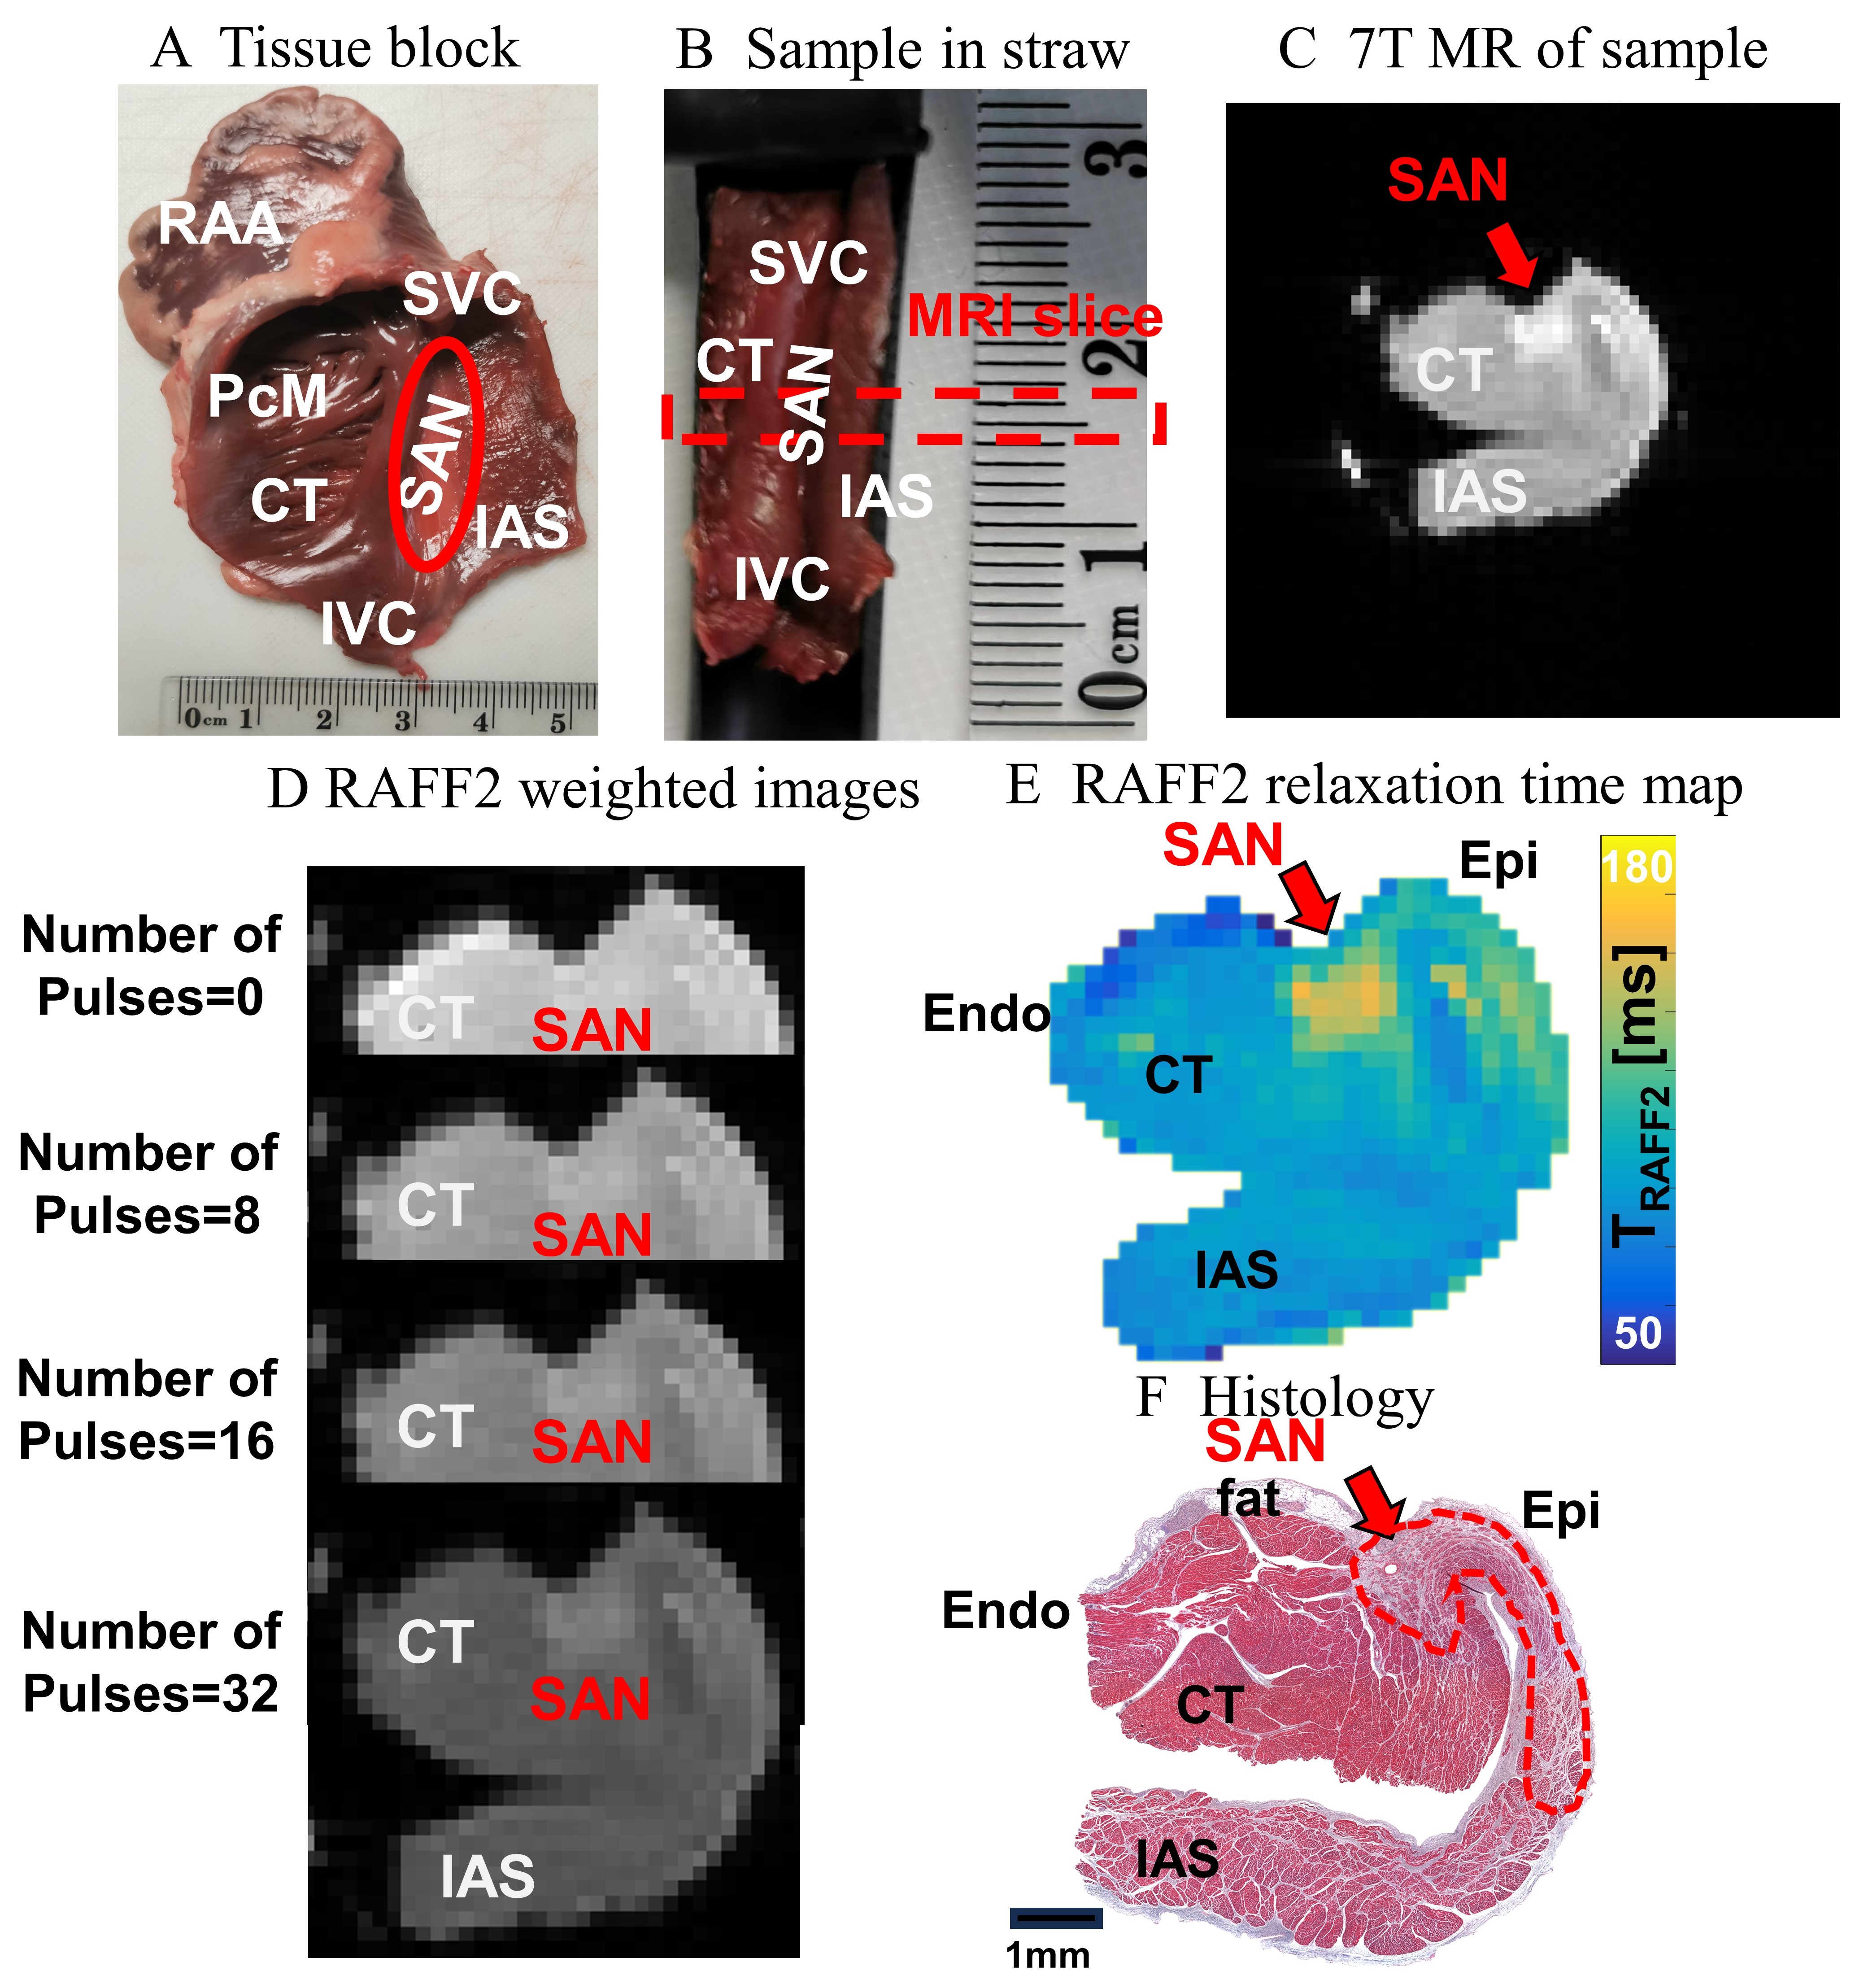
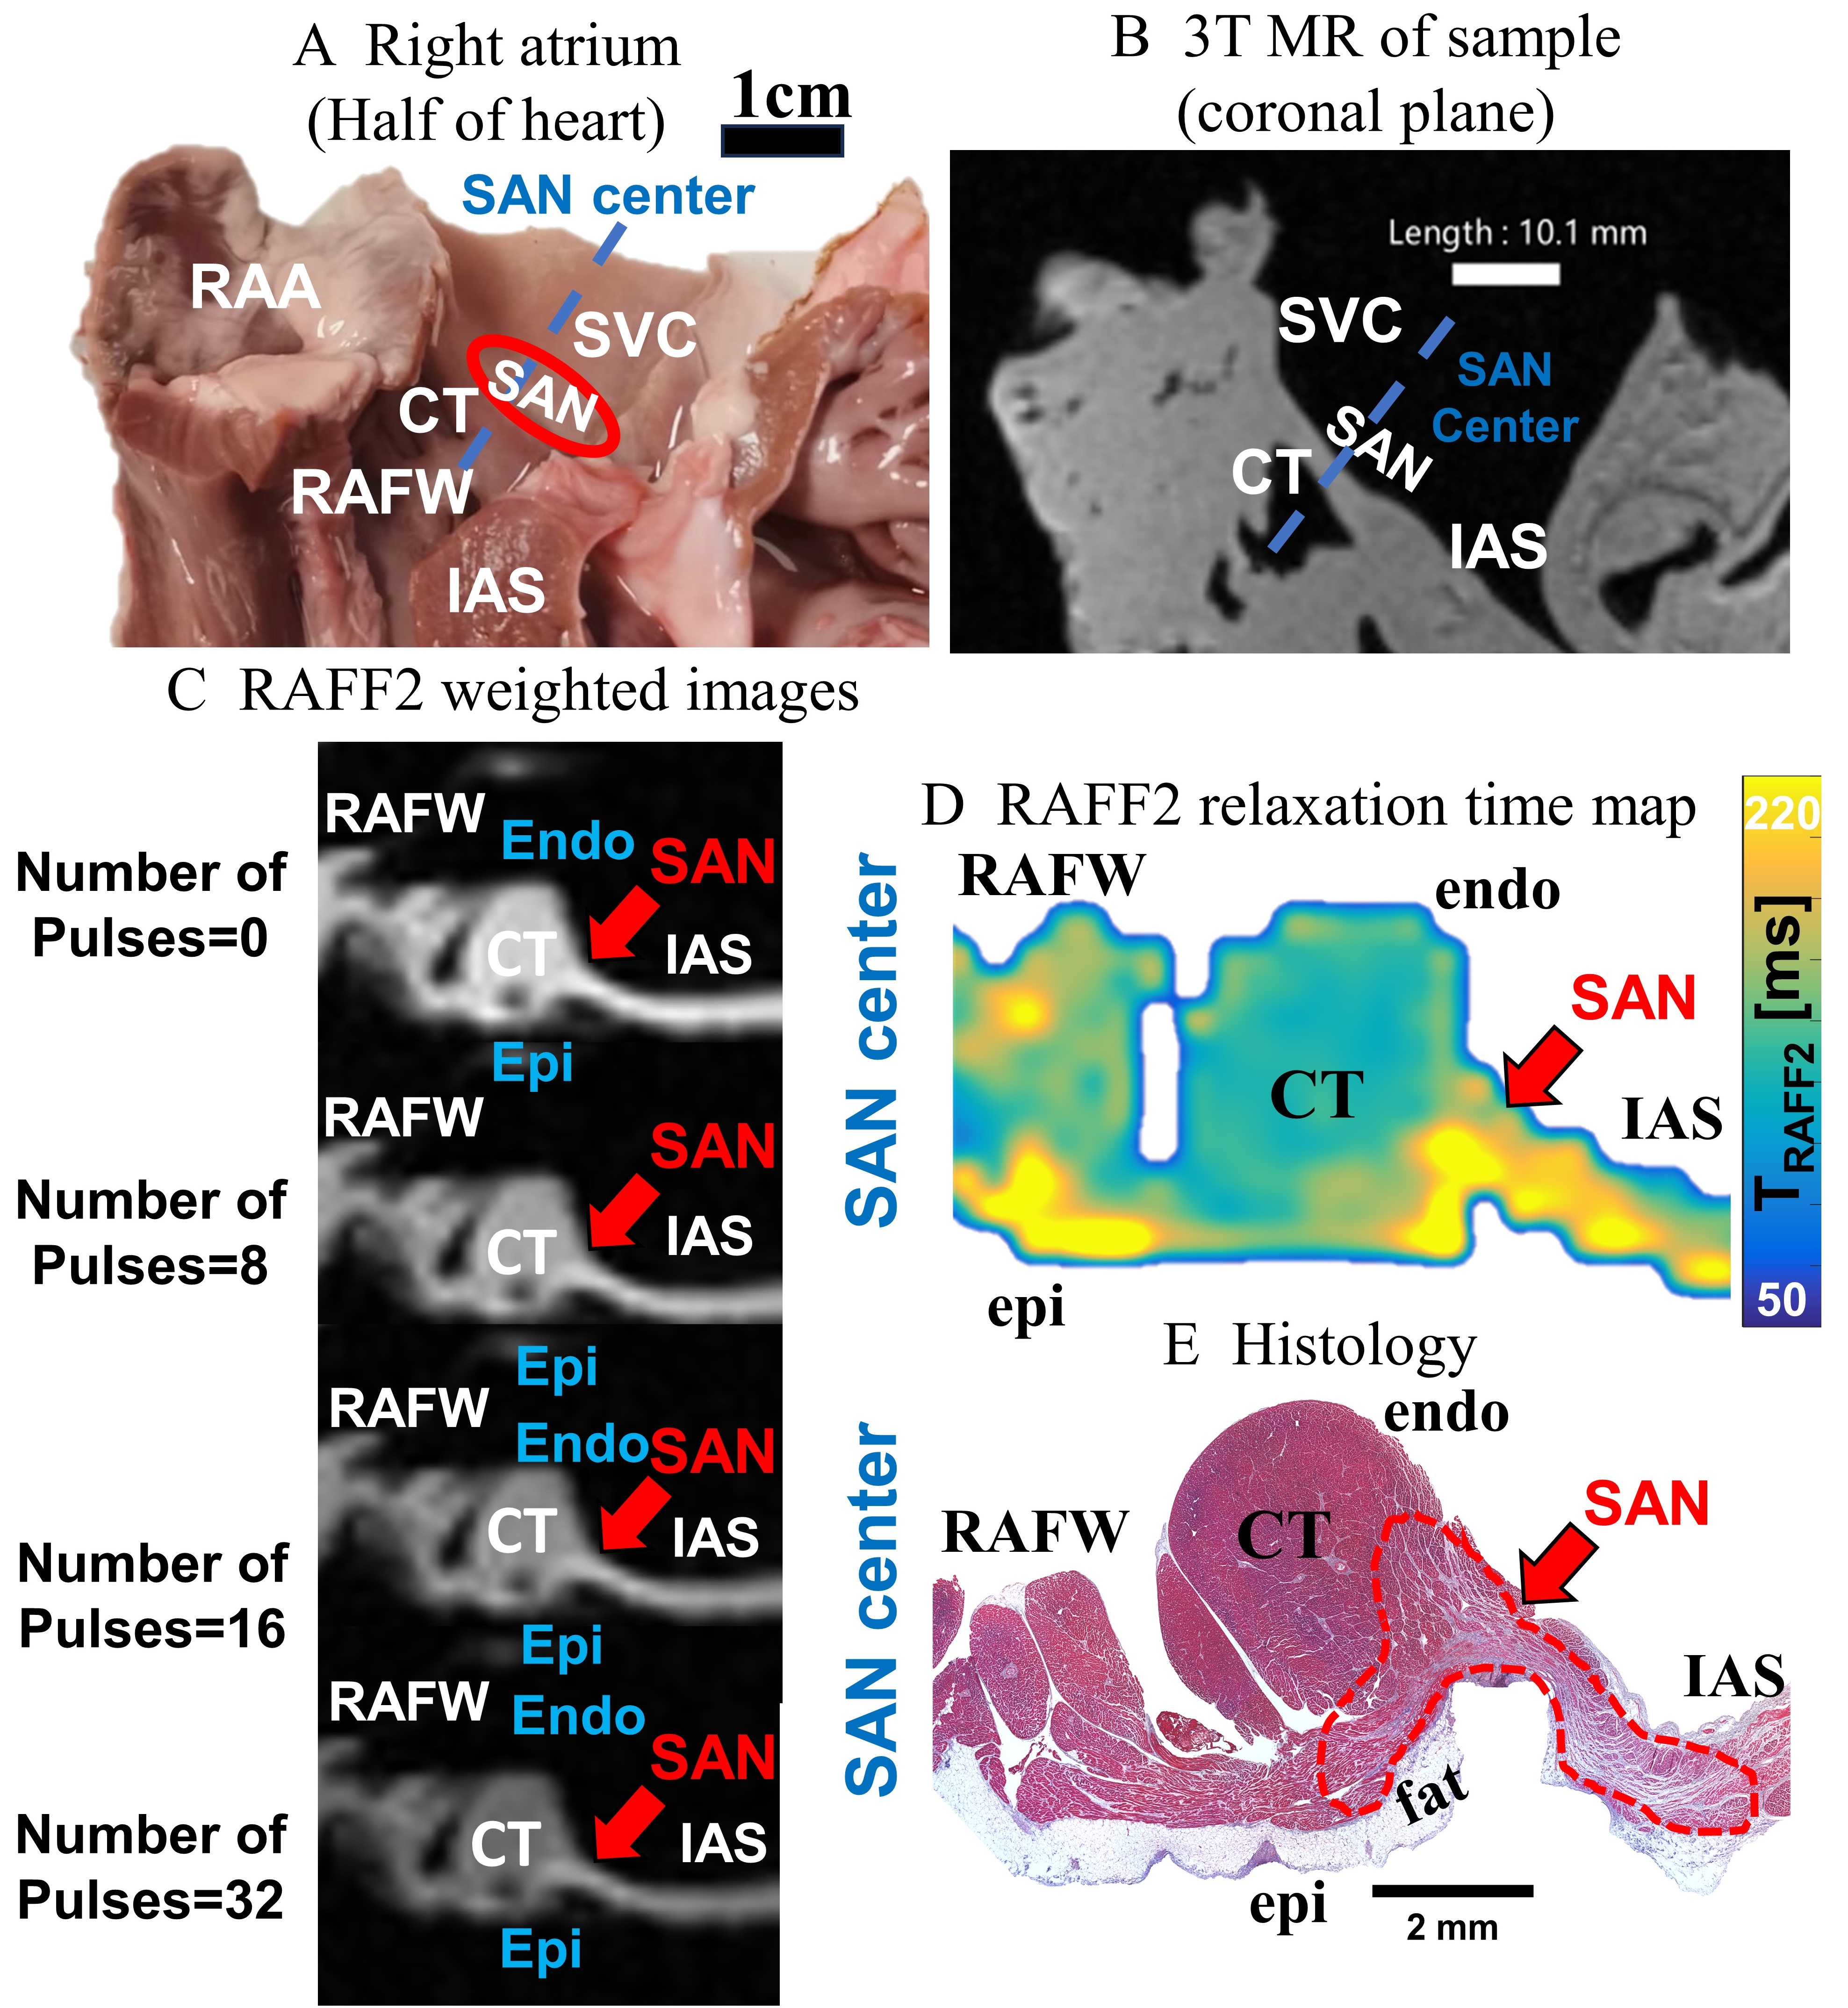
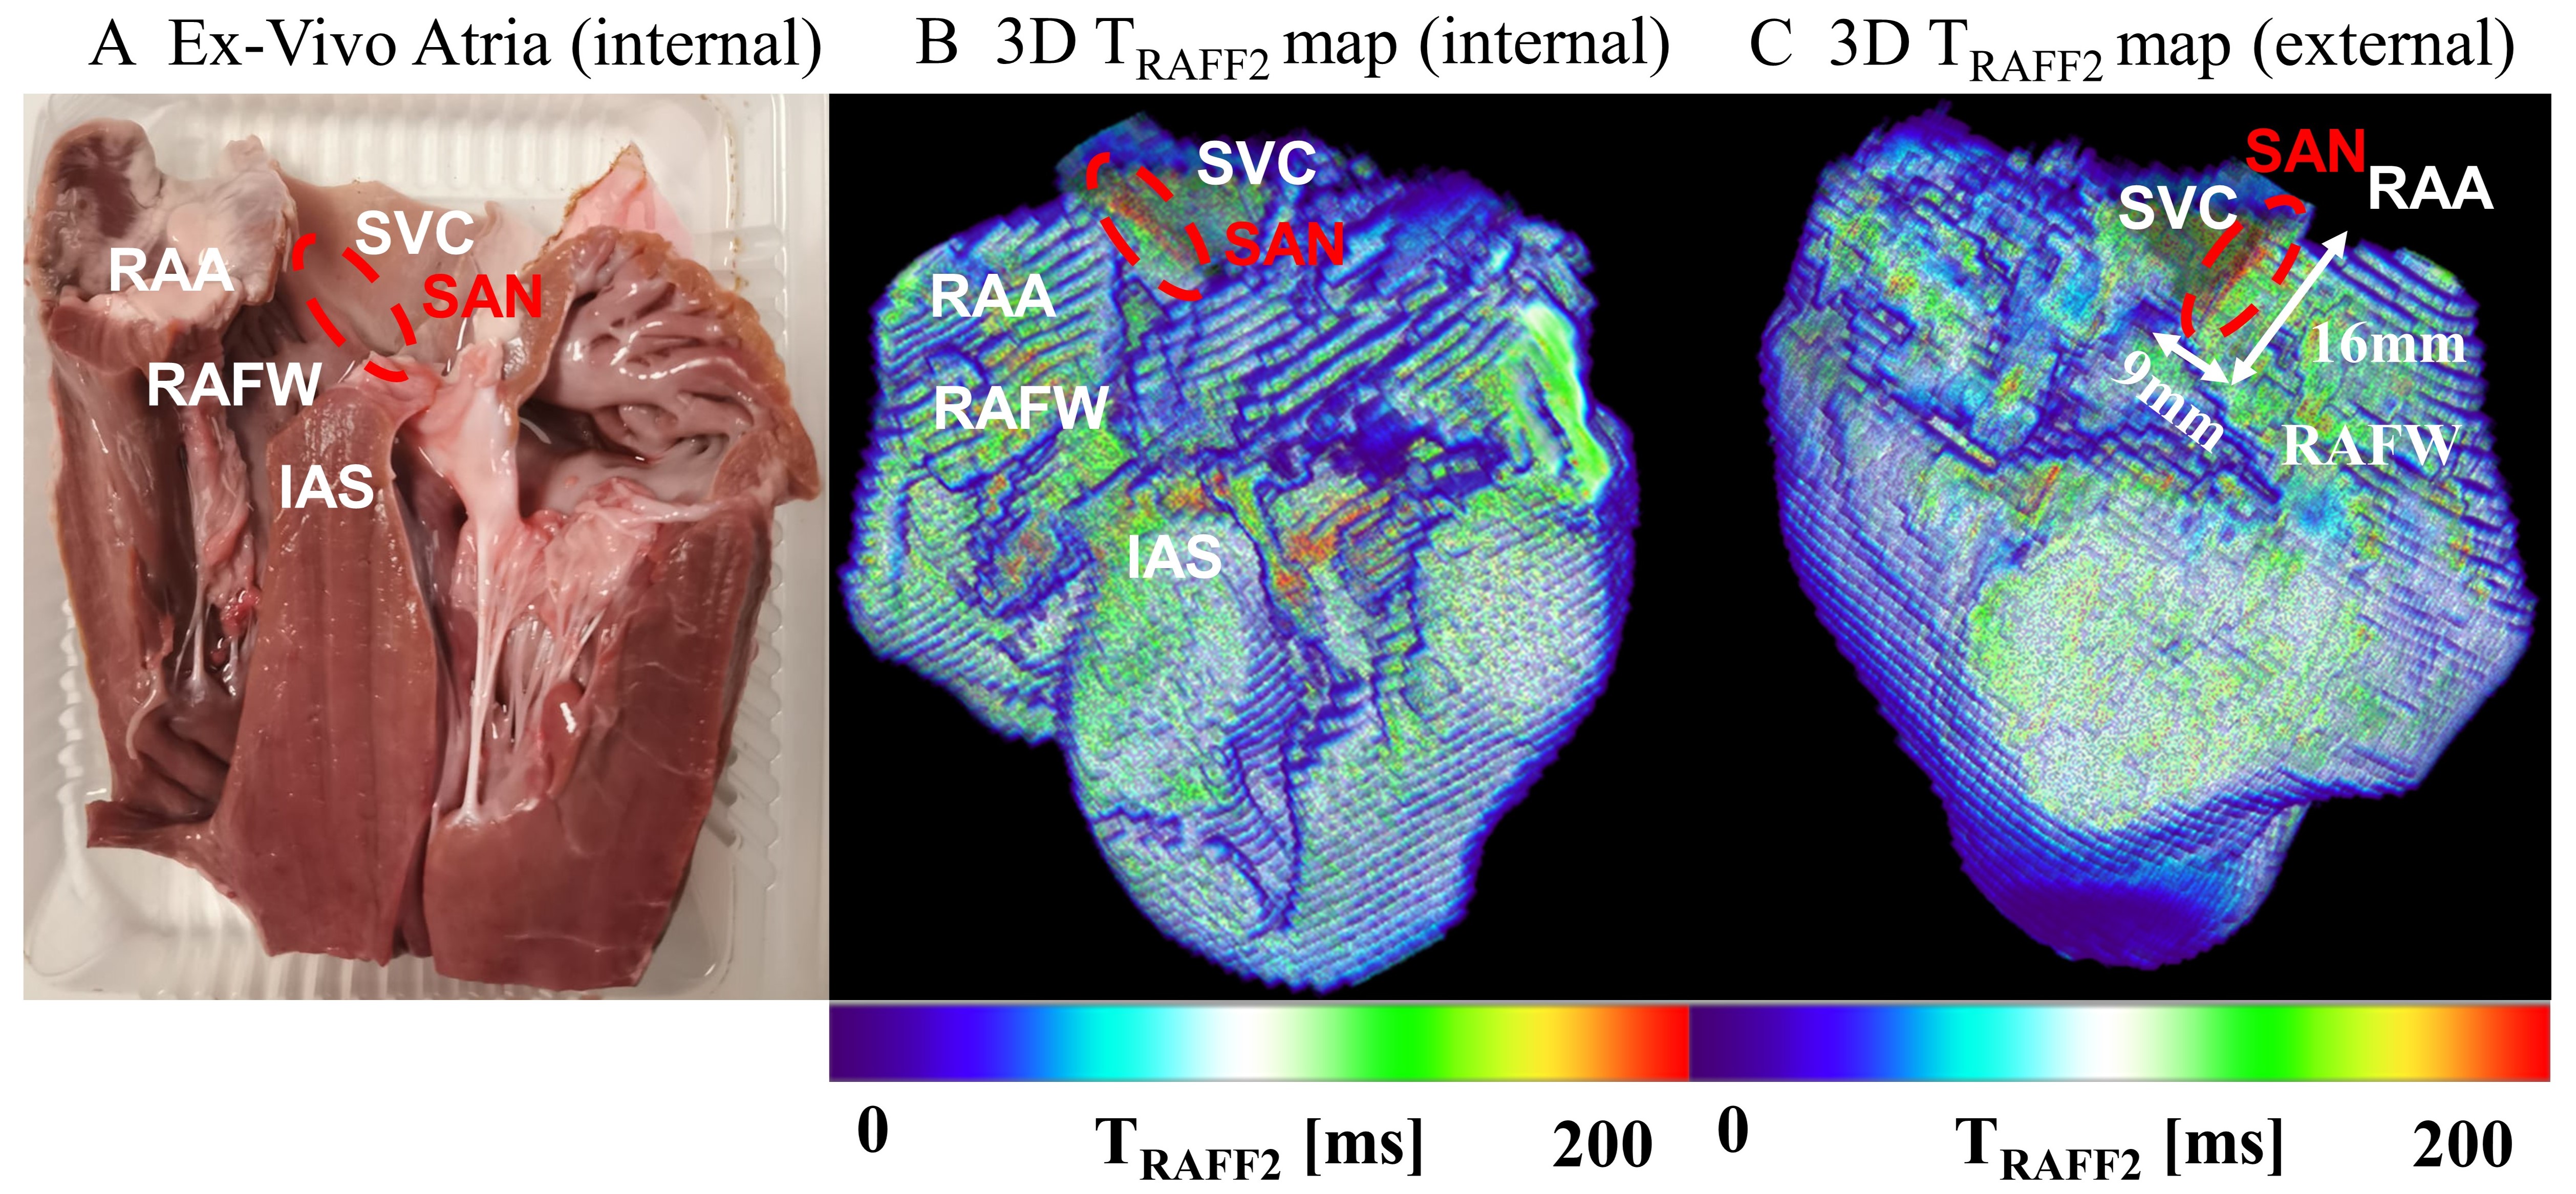
Tissue blocks (n=7) including SAN were prepared from ex-vivo swine hearts (n=7) and scanned on a 7T preclinical MRI (Bruker Ⅲ Avance 300) using a 10mm volume probe. A 3mm slice was selected close to the magnetic isocenter (Figure 1A-C). An additional seven heart halves were scanned on a 3T clinical MRI system (Siemens Vida) using a knee coil. Each specimen was fixed in a plastic container filled with perfluoropolyether and was placed in the center of the coil for the measurement (Figure 2A-C). The imaging protocol included the following measurements: RAFF2 (number of pulses 0,8,16 and 32) 3,4, T1ρ (four spin lock times between 0-60ms), T2 (four echo times (TEs) between 10-40ms), T1 (inversion times (TIs) between 100-1200ms and 200-3900ms at 7T and 3T, respectively), and magnetization transfer (MT) measured with offsets of 500Hz, 1000Hz, 1500Hz, 3000Hz and 20000Hz. Matrix size and field of view (FOV) were 64×64 and 15×15 mm2 at 7T, and 220×320 and 111×90 mm2 at 3T, respectively. The nominal powers for RAFF2, T1ρ and MT were 1250 Hz at 7T and 500Hz at 3T, respectively.After imaging, 5μm histology sections were prepared and stained using Masson’s Trichrome (Figure 1F and 2E). Regions of interests (ROIs) were chosen in the SAN and remote myocardium areas based on the appearance of the histological section. The contrast was defined by relative relaxation time difference (RRTD), calculated as $$$2[T(SAN)-T(myocardium)]/[T(SAN)+T(myocardium)]$$$, where T is the average relaxation time over the ROIs. MT ratio (MTR) was calculated as MTR=100×(S0-SMT)/S0, where S0 and is the signal at 20000Hz offset and SMT is the signal at other offsets 6. The contrast in the MTR was defined as magnetization transfer contrast (MTC), which was calculated using MTC=MTR (myocardium)-MTR(SAN). Differences in relaxation times between SAN and myocardium, and differences in contrast values between RAFF2 and other methods were compared using Student t-test with Benjamini-Hochberg correction. RAFF2 relaxation time maps obtained from 3T MR measurements were smoothed, volume rendered, and visualized in 3D using ImageJ plugin, Volume Viewer (National Institutes of Health, Figure 5).
Results
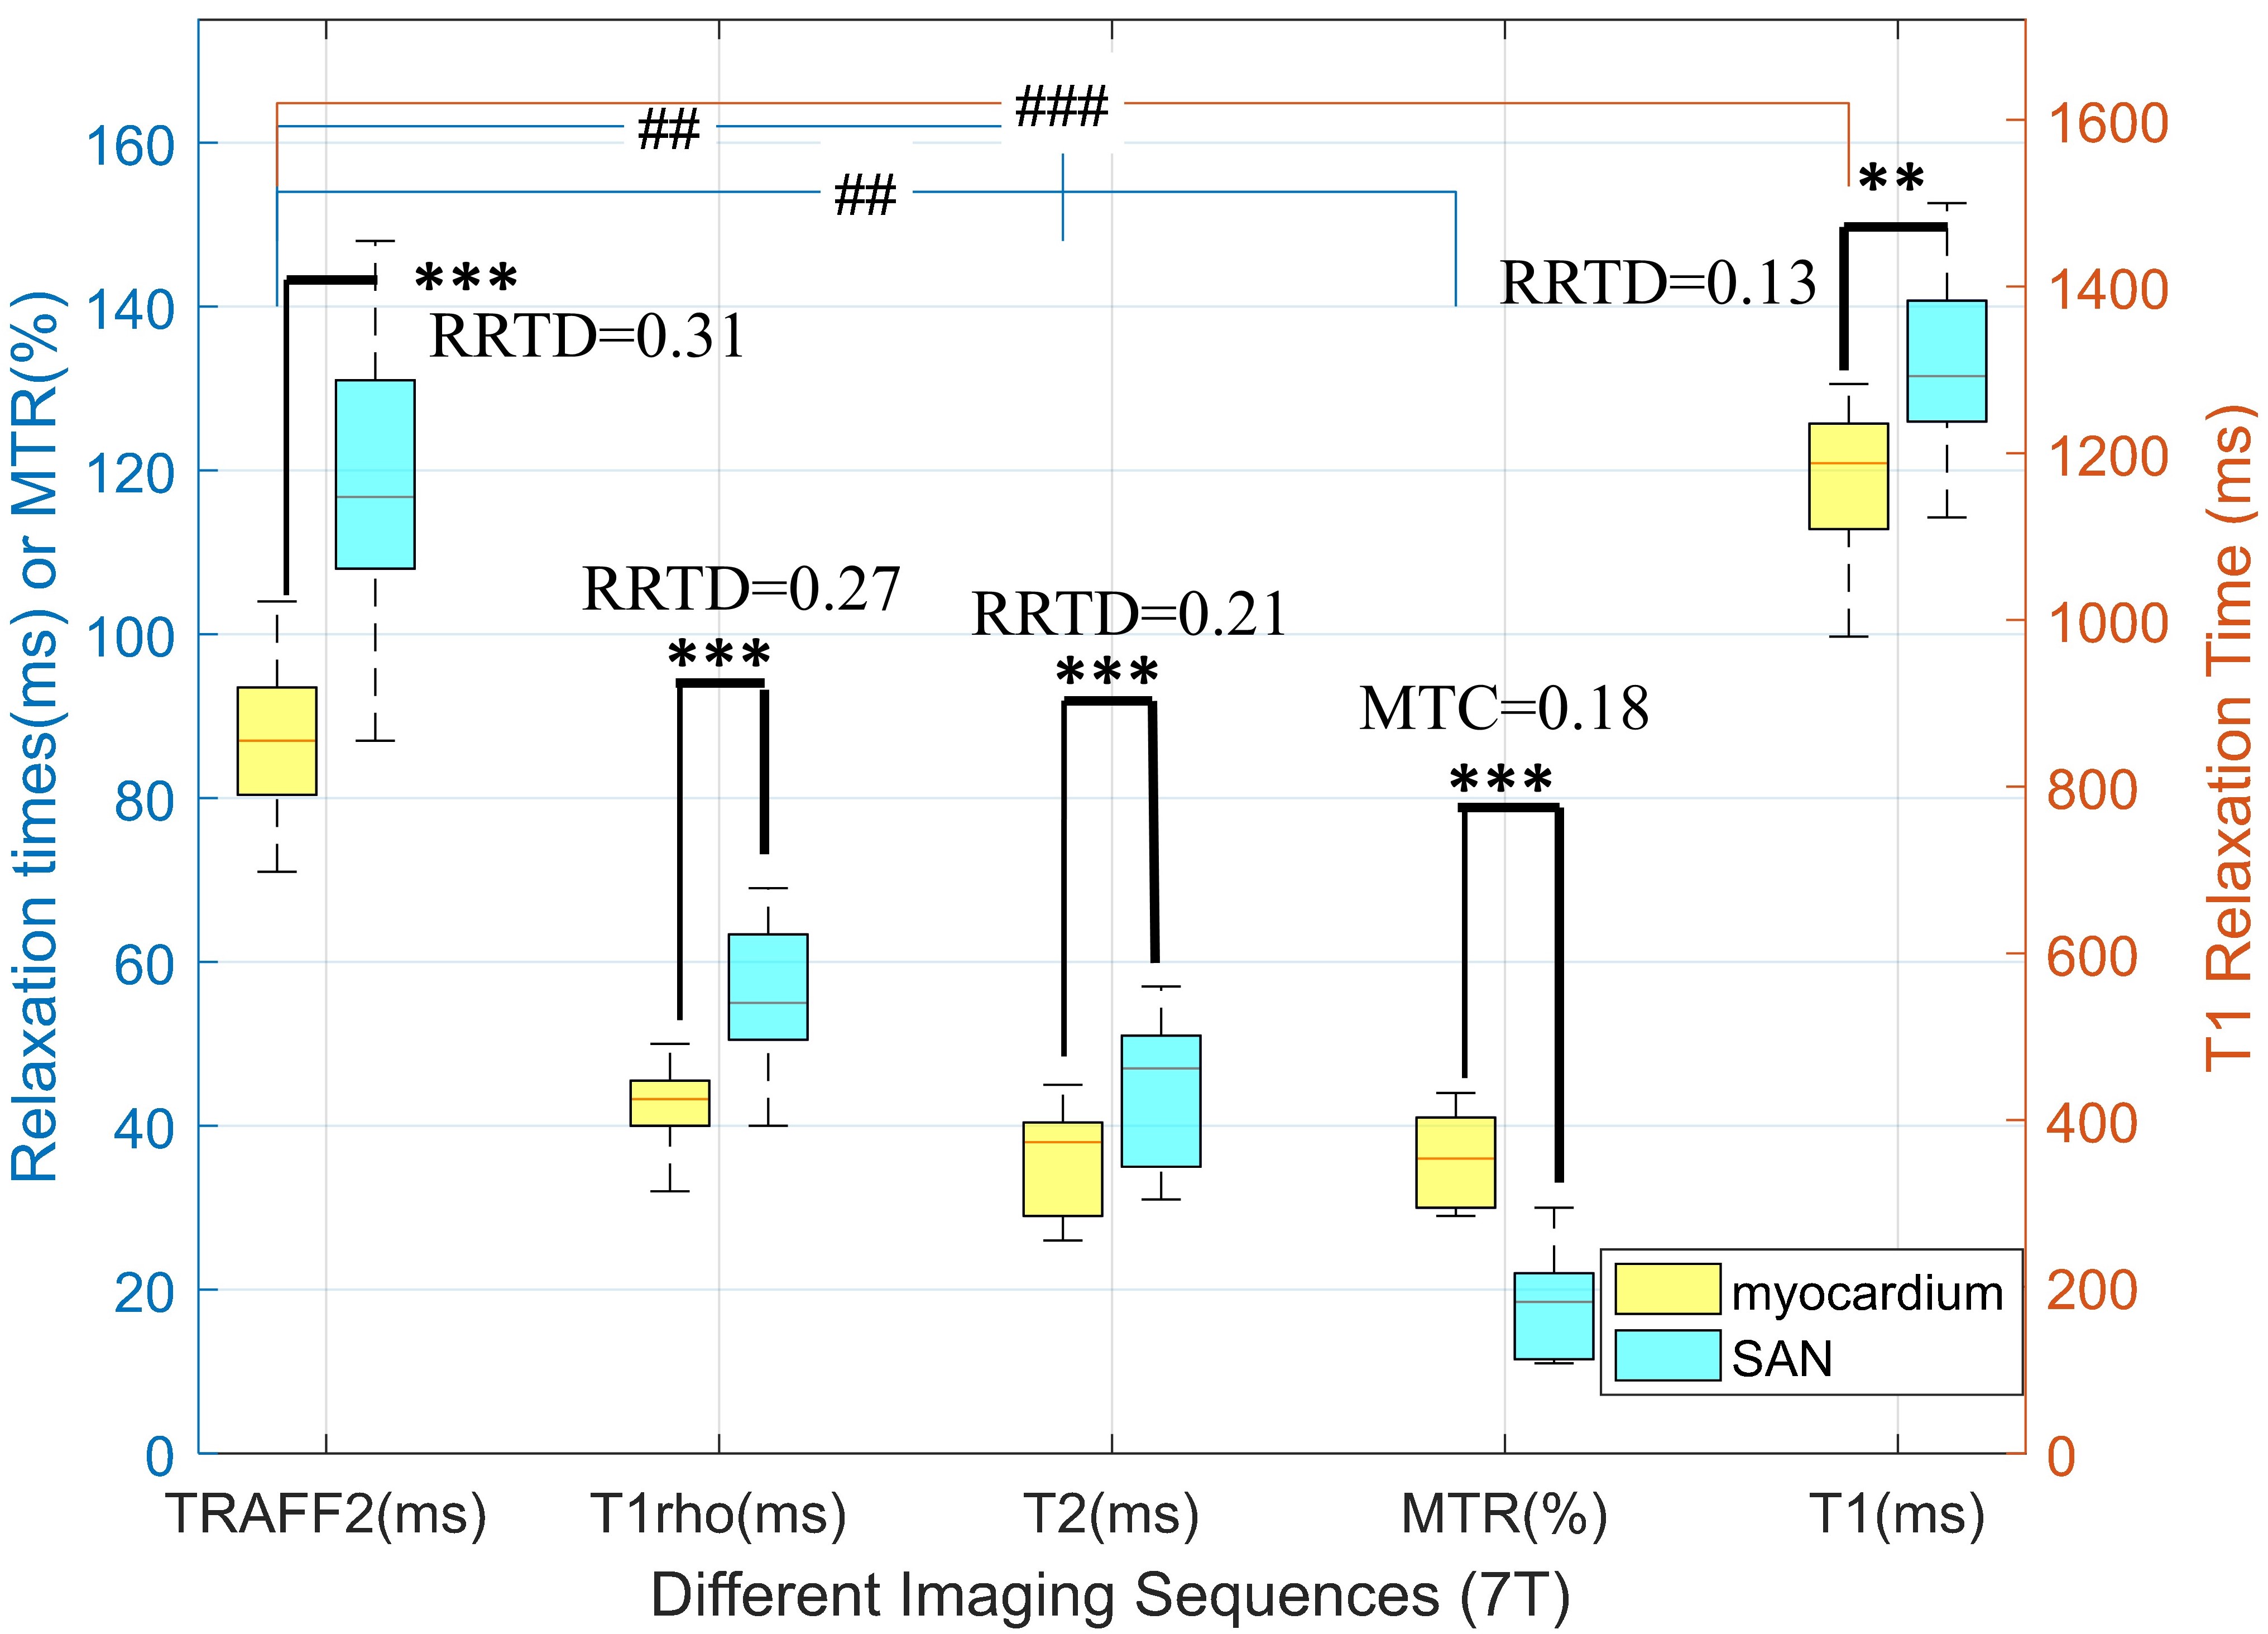
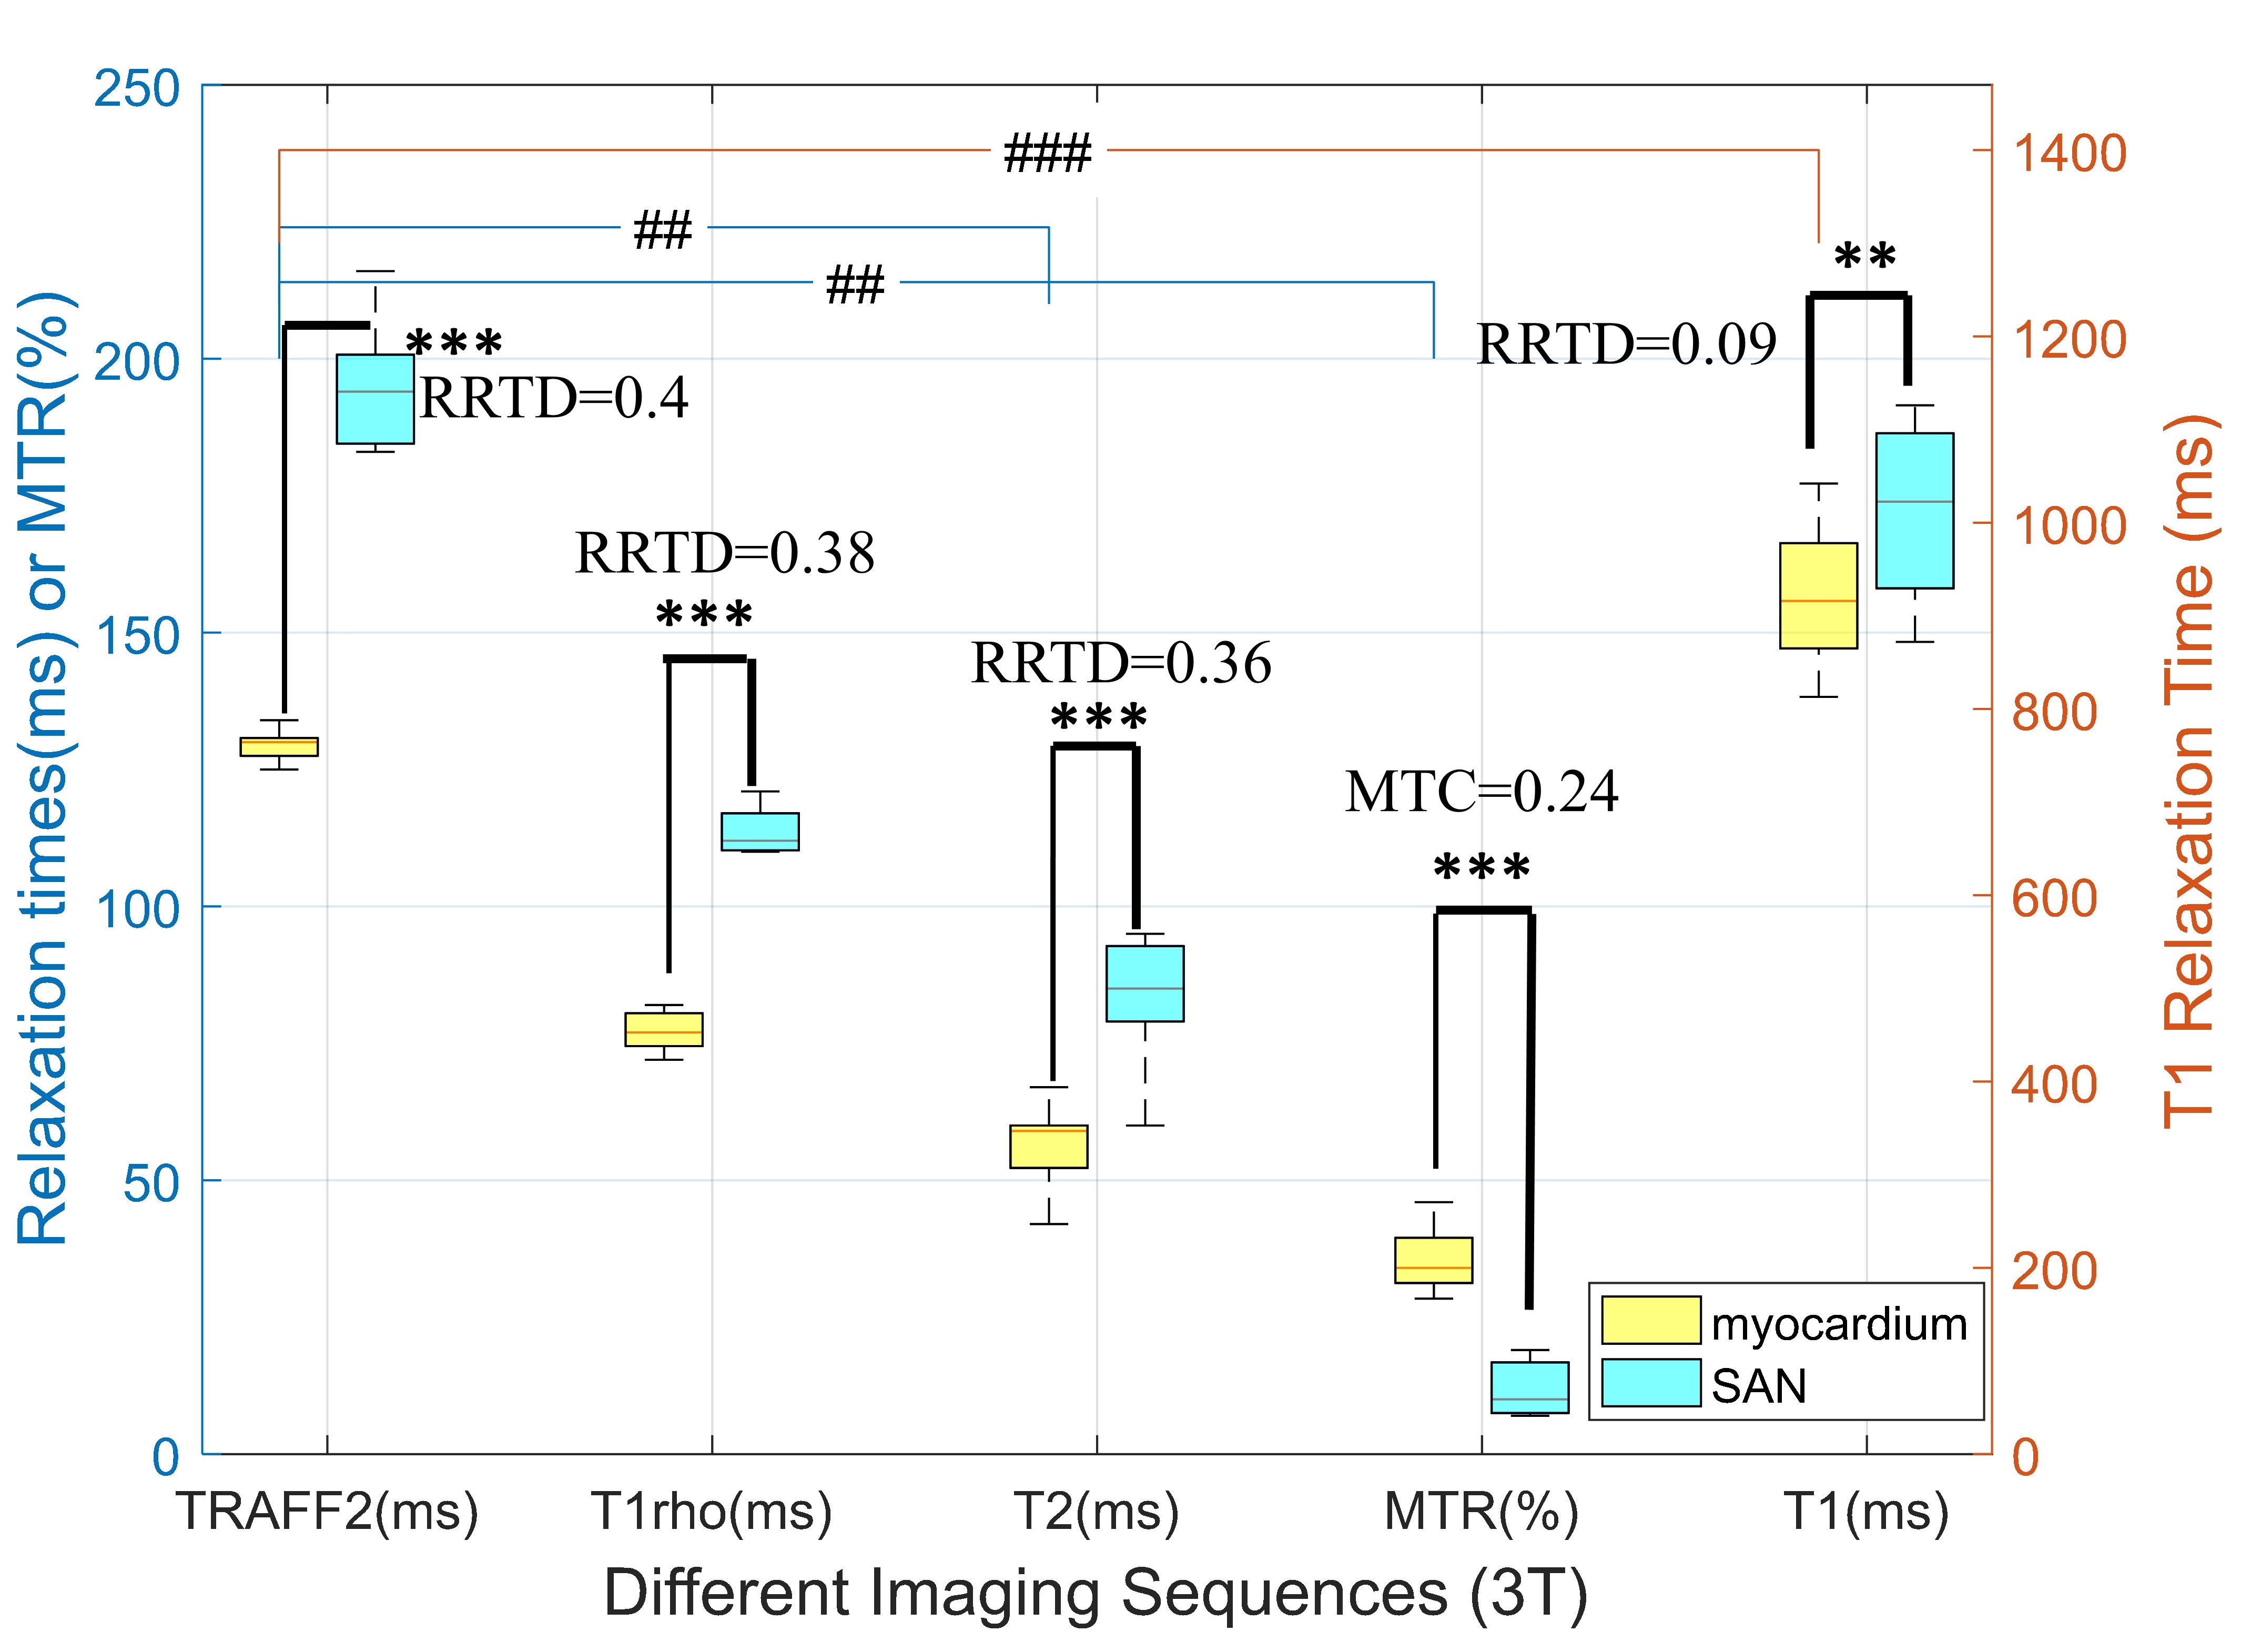
The SAN region appears bright in RAFF2 weighted images, indicating clear contrast between SAN and surrounding tissue (Figure 1D and 2C). Increased relaxation time in the SAN compared to myocardium area was observed in the RAFF2 relaxation time map (Figure 1E and 2D). Significant differences in the relaxation times between SAN and myocardium area were found with all imaging sequences (**P<0.01, ***P<0.001, Figure 3 and 4). RRTDs in TRAFF2 and T1ρ were significantly higher than RRTDs in T2 (##P<0.01) and T1(##P<0.001), as well as MTR (##P<0.01). From the 3D reconstruction relaxation time map, the SAN structure can be delineated with higher relaxation time compared to the surrounding atrial tissue in ex vivo hearts (Figure 5).Discussions
In this study, we found that TRAFF2 and T1ρ maps have significantly higher contrast in the relaxation time between SAN and myocardium compared to T2 and T1 relaxation maps, as well as MTR in ex vivo swine heart. Previous studies in mouse and human hearts have shown elevated relaxation time in RAFF2 and T1ρ associated with regions containing higher fibrosis content, such as myocardial infarcts, compared to remote myocardium areas. As SAN of human and swine hearts have high content of fibrotic tissue and collagen 7, the longer TRAFF2 and T1ρ found in collagen rich SAN area compared to surrounding myocardium are likely attributable to a larger extracellular space rather than increased proton exchange within the SAN. This interpretation is further supported by previous LGE measurements showing gadolinium accumulation within the SAN structure likely due to its larger extracellular space than surrounding atrial tissue 1,7.Conclusion
The SAN was quantitatively identified on rotating frame relaxation time maps (RAFF2 and T1ρ) as areas of higher relaxation times compared to myocardium. Both TRAFF2 and T1ρ maps are feasible non-invasive contrast-agent free imaging methods for visualizing the SAN in ex vivo swine heart.Acknowledgements
This research was funded by Academy of Finland.References
1 Csepe T A, Zhao J, Sul L V, et al. Novel application of 3D contrast-enhanced CMR to define fibrotic structure of the human sinoatrial node in vivo[J]. European Heart Journal-Cardiovascular Imaging, 2017, 18(8): 862-869.
2 Ylä-Herttuala E, Laidinen S, Laakso H, &Liimatainen T. Quantification of myocardial infarct area based on TRAFFn relaxation time maps - comparison with cardiovascular magnetic resonance late gadolinium enhancement, T1rho and T2 in vivo. J Cardiovasc Magn Reson. 2018; 20:34.
3 Liimatainen T, Sorce D J, O'Connell R, et al. MRI contrast from relaxation along a fictitious field (RAFF). Magnetic resonance in medicine, 2010, 64: 983-994.
4 Liimatainen T, Hakkarainen H, Mangia S, et al. MRI contrasts in high rank rotating frames. Magnetic resonance in medicine, 2015, 73: 254-262.
5 Mirmojarabian A, Liukkonen E, Casula V, et al. Relaxation along fictitious field (RAFF) provides an appropriate alternative method for imaging chronic myocardial infarct without exogenous contrast media[J]. Interventional Cardiology, 2021, 13: 381.
6 Magat J, Fouillet A, Constantin M, et al. 3D magnetization transfer (MT) for the visualization of cardiac free-running Purkinje fibers: an ex vivo proof of concept[J]. Magnetic Resonance Materials in Physics, Biology and Medicine, 2021: 1-14.
7 Shiraishi I, Takamatsu T, Minamikawa T, et al. Quantitative histological analysis of the human sinoatrial node during growth and aging[J]. Circulation, 1992, 85(6): 2176-2184.
Figures