3531
Assessing different CKD stages by cardiac magnetic resonance native T2 mapping and NT-pro BNP, a polit study1the First Affiliated Hospital of Dalian Medical University, Dalian, China
Synopsis
Keywords: Myocardium, Kidney, chronic kidney disease, Cardiac magnetic resonance, T2 mapping, biomarkers, NT-pro BNP
Motivation: We can use the positive correlation between natural T2 value and NT-pro BNP to achieve early clinical detection, diagnosis and treatment of myocardial abnormalities caused by chronic kidney disease, thereby improving the prognosis of patients with CKD.
Goal(s): Our aim was to analyze the relationship between native T2 value and NT-pro BNP over stage progression.
Approach: CMR is performed on a 3.0-T scanner. Cardiac data were assessed using CVI.42. Pearson, Spearman coefficients and ANOVA analysis were used to analyze the data.
Results: There was a statistically significant difference in autologous T2 value between different CKD groups. and NT-pro BNP. Subgroups stratified by eGFR showed a significantly differential correlation between NT-pro BNP and native T2 value.
Impact: We can use the positive correlation between natural T2 value and NT-pro BNP to achieve early clinical detection, diagnosis and treatment of myocardial abnormalities caused by chronic kidney disease, thereby improving the prognosis of patients with CKD.
Introduction
Patients with chronic kidney disease (CKD) have very high risk of cardiovascular disease (CVD), thus high CVD morbidity and mortality seriously affects their prognosis [1]. The evaluation of cardiac structure and function in CKD patients by CMR is moving towards a more precise direction. Significantly elevated N-terminal pro-brain natriuretic peptide (NT-pro BNP), the serological indicator commonly used in clinical practice to evaluate the severity of heart failure [2], is frequently found in CKD and associated with both cardiovascular remodeling and outcome [3-5]. T2 mapping technology is an imaging method developed based on the T2W sequence to quantitatively measure T2 value, which is usually used to diagnose cardiac inflammation and myocardial edema. T2 mapping is a specific marker of increased myocardial water content. Since the structure and function of cardiac has been proven to be affected by myocardial fluid overload [6]. Therefore, the aim of the present study was to examine the relationship between native T2 value and NT-pro BNP with stage progression, as well as their correlation.Methods
In this study, 48 CKD patients(12 in CKD3, 11 in CKD4, and 25 in CKD5)from the First Affiliated Hospital of Dalian Medical University were recruited from June 2022 to December 2022, and CMR was performed on a 3.0-T scanner. Sequences were acquired during end-expiratory breath-holds with electrocardiographic (ECG) or pulse triggering. Native T2 mapping was performed using a T2-FLASH sequence at end-expiration in a plane covering the largest diameter of the cardiac mass. Cine sequences were obtained with the following acquisition parameters: TR= 1000 ms; TE = 9.3 ms; slice thickness = 10 mm; FOV=300mm; Cardiac data including native T2 value were evaluated using CVI.42 software (version5.14, Circle Cardiovascular Imaging Inc.). Image analysis was performed by an experienced radiologist blinded to patient identity, clinical outcomes, original scans, and subsequent imaging. All statistical analyses were performed using SPSS software(version 26.0). We adopted the Pearson, spearman coefficient and analysis of variance (ANOVA analysis) to analyze the data to be studied. Normally distributed continuous variables as the mean ± standard deviation and other data as median (interquartile range [IQR]). A two-sided p-value < 0.05 was regarded as statistically significant.Results
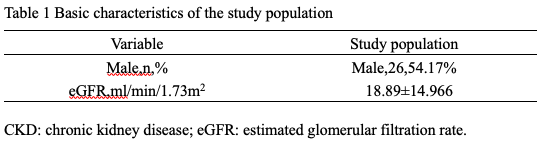
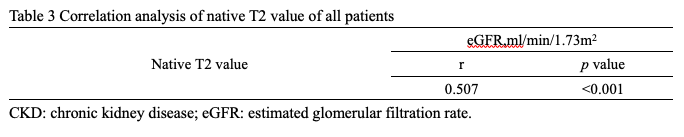
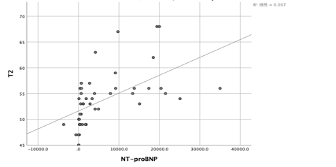
48 patients with CKD are included for CMR and the clinical characteristics of the patients are given in Table 1. There was significant difference in native T2 value between the CKD3, CKD4, and CKD5 groups (p <0.001) (Table 2). As well as NT-pro BNP (Table 2). And Table 3 shows the correlation analysis of the native T2 value of all patients. Spearman correlation analysis showed a significant positive correlation between native T2 values and eGFR (r = 0.527, p <0.001). Subgroups stratified by eGFR showed differentially significant associations between NT-pro BNP and native T2 value (Figure.1).Discussion
Chronic kidney disease (CKD) is a condition in which kidney damage or decreased kidney function persists for more than three months. In this study, we demonstrate independent association between cardiac biomarkers with imaging marker of myocardial edema. Together, these results indicate a link between myocardial structure and function with an increase of myocardial fluid in CKD. Two independent approaches of detecting myocardial abnormalities were employed, by serology and imaging, which are both well established in terms of accuracy and prognostic significance. And we found that serological biomarker NT-pro BNP and imaging marker of structural remodeling have close correlation with native T2 value. Ultimately, these findings show that myodial edema plays an important role in pathophysiology of myocardial injury in CKD [7].Conclusion
Cardiac disease caused by CKD has also been a hot topic in CKD research in recent years. Accurate and quantitative evaluation of cardiac structure and function is of great clinical significance for the diagnosis, treatment, and prognosis of nephrotic heart disease. With advanced CKD, the increased native T2 value and NT-pro BNP seem to be predictive factors of cardiovascular system damage in CKD patients. Superbly, we can use the positive correlation between native T2 value and NT-pro BNP to achieve early clinical detection, diagnosis, and treatment of myocardial abnormalities caused by chronic kidney disease, thereby improving the prognosis of CKD patients. Our study shows the meaning of cardiac magnetic resonance T2 mapping to assess myocardial data in CKD patients is significant. At the same time, the progression of CKD shows a possible correlation with the native T2 value. And T2 mapping technique contributes to unique value in diagnosing myocardial tissue lesions.Acknowledgements
There is no conflict of interest in this study.References
[1] Düsing P, Zietzer A, Goody PR, et al. Vascular pathologies in chronic kidney disease: pathophysiological mechanisms and novel therapeutic approaches. J Mol Med (Berl). 2021 Mar;99(3):335-348.
[2] Adrish M, Nannaka VB, Cano EJ, et al. Significance of NT-pro-BNP in acute exacerbation of COPD patients without underlying left ventricular dysfunction. Int J Chron Obstruct Pulmon Dis. 2017 Apr;12:1183-1189.
[3] Jacobs LH, Van De Kerkhof J, Mingels AM, et al. Haemodialysis patients longitudinally assessed by highly sensitive cardiac troponin T and commercial cardiac troponin T and cardiac troponin I assays. Ann Clin Biochem. 2009;46:283–90.
[4] Parikh RH, Seliger SL, deFilippi CR. Use and interpretation of high sensitivity cardiac troponins in patients with chronic kidney disease with and without acute myocardial infarction. Clin Biochem. 2015;48:247–53.
[5] Thygesen K, Alpert JS, Jaffe AS, et al.Fourth universal definition of myocardial infarction (2018). Eur Heart J.2019;40:237–69.
[6] Puntmann VO, Valbuena S, Hinojar R, et al. Society for Cardiovascular Magnetic Resonance (SCMR) expert consensus for CMR imaging endpoints in clinical research: part I - analytical validation and clinical qualification. J Cardiovasc Magn Reson. 2018 Sep;20(1):67.
[7]Edwards NC, Moody WE, Yuan M, et al. Diffuse interstitial fibrosis and myocardial dysfunction in early chronic kidney disease. Am J Cardiol. 2015;115:1311–7.
Figures