3520
Assessment of RAGE-DIAPH1 interaction agonist induced changes to cardiac and muscle metabolites in a murine model of Type-1 Diabetes1Bernard and Irene Schwartz Center for Biomedical Imaging, Department of Radiology, New York University Grossman School of Medicine, New York, NY, United States, 2Center for Advanced Imaging Innovation and Research (CAI2R), Department of Radiology, New York University Grossman School of Medicine, New York, NY, United States, 3Department of Endocrinology, New York University Grossman School of Medicine, New York, NY, United States
Synopsis
Keywords: Endocrine, Diabetes
Motivation: Diabetes Mellitus causes systemic changes in lipids of multiple organs. Previous studies have shown that receptor for advanced glycation end products (RAGE) and its tail binding partner diaphanous 1 (Diaph1) are key mediators of metabolic changes in T1D mice.
Goal(s): To use 1H-MRS and CSE-MRI to investigate the metabolic effects of the RAGE-DIAPH1 interaction antagonist, RAGE229, in T1D murine hearts and hind limb.
Approach: 18 mice were divided into 3 cohorts (Rage229/+db, RegDiet/+db, RegDiet/-db) and scanned using 1H-MRS and CSE-MRI.
Results: Inhibition of RAGE-DIAPH1 interaction by RAGE229 leads to significant reduction in triglyceride levels in hearts and hind limb of T1D mice.
Impact: The results of this study set the stage for further testing of RAGE229 as potential therapeutic adjuncts in alleviating metabolic dysfunction in T1D.
INTRODUCTION
Previous studies have linked the receptor for advanced glycation end-products (RAGE) and its tail binding partner diaphanous 1 (DIAPH1) as key mediators of metabolic, signaling and functional changes in diabetic mice[1-3]. Recently, a small molecule RAGE-DIAPH1 interaction antagonist, RAGE229, administered in diet was shown to reduce diabetic complications in mice4. In this study, the goal was to investigate the effects of the RAGE229 diet and induced Type-1 diabetes mellitus (T1DM) in organ specific changes (heart and hind limb) in metabolites using proton magnetic resonance spectroscopy (1H-MRS) and chemical-shift encoded (CSE) MRI.METHODS
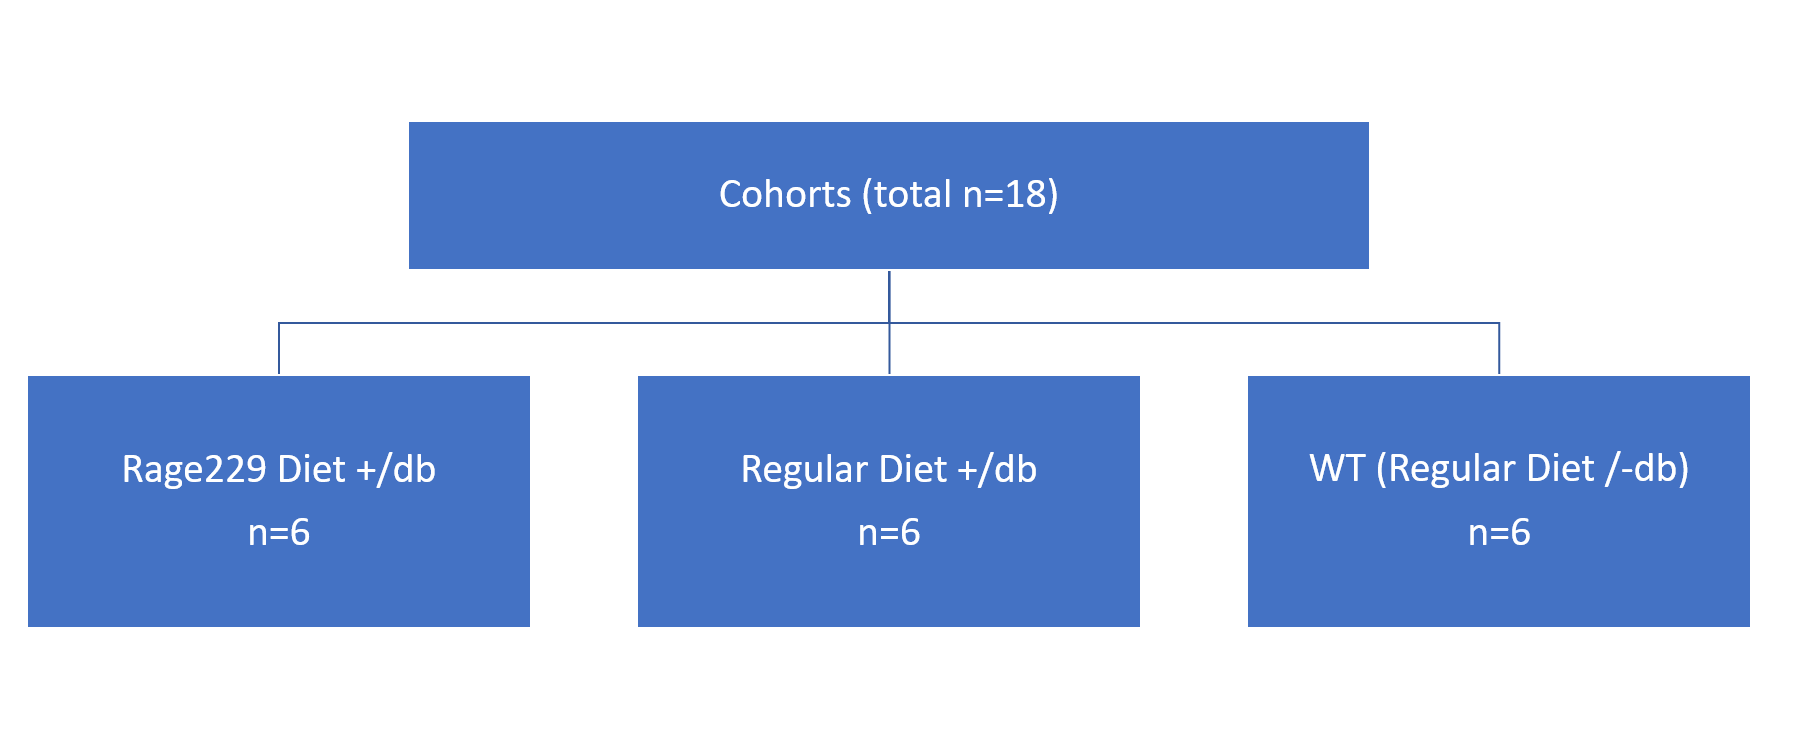
The animal experiments were conducted according to the procedures approved by the Institutional Animal Care and Ethical Committee (IACUC) of our institution. Three cohorts of mice were used consisting of male wild type (WT) C57BL/6 mice (Jackson Laboratory, ME): i) T1DM induced mice on a RAGE229 diet (Rage229/+db), ii) Type 1 diabetes (T1D) induced mice on a regular diet (RegDiet/+db), and control cohort with regular diet, and no T1D (RegDiet/-db). Regular diet consisted of standard lab pellets (Rodent Diet #5001, Lab Diet, St. Louis, MO), and the RAGE229 diet (10 mg/kg in a volume of 1 ml/kg). T1DM was induced by destruction of the pancreatic cells by injection of streptozotocin (55mg/kg for 5 days) at the age of 6 weeks as published earlier[2,4]. The blood glucose was monitored for all mice, with the diabetic mice used in this study having a blood glucose greater than 250 mg/dl. Figure 1 shows details of the study design and cohorts used.All MRI/MRS scans were performed on a 7T micro-MRI (Bruker Bio-Spin, USA) equipped with 750mT/m gradients, with a vendor supplied transmit-receive volume coil. For the MR-imaging, isoflurane anesthesia was maintained at 1.5-2% delivered in 1:1 oxygen to air mixture via a nose cone, with 25-30/minute respiration rate. MRS experiments used a PRESS sequence with TR=2000ms, TE=16ms, bandwidth=4000Hz, 256 averages with and without water suppression using the variable pulse power and optimized relaxation delays (VAPOR) module, total scan time was about 8 min. The voxel placed in the heart was 1x2x2 mm3, and placed along the interventricular myocardial septum (IVS). In the hind-limb, the voxel size used was 3x3x3 mm3. CSE-MRI used a non-commercial 3D multi-echo gradient recalled echo (GRE) sequence covering the torso of the mouse. The technique uses optimized echo spacing with a 3-point Dixon water-fat suppression technique with the following parameters: TR=10ms, TEs=2.6ms 2.93ms, and 3.26ms, FA=10°, FOV=30x30x30 cm3 image matrix=128x128x64, in-plane resolution=2.3mm2, scan time=4min.
The MRS data was post-processed and quantified in the time domain using jMRUI software [5]. Spectra were phase and frequency corrected and apodised using a Lorentzian line shape with a damping factor of 5Hz. Quantification of the spectra was done using the AMARES algorithm [6]. A vial of water placed outside the mouse was used as an external water reference[7]. For CSE-MRI image post-processing, the raw data at multiple TE’s were reconstructed using the IDEAL algorithm[8]. Separate water and fat images were reconstructed, and water and fat fraction maps were also computed. A non-parametric Kruskal-Wallis test was used to compare the cohorts, with a significance level set to 0.05.
RESULTS
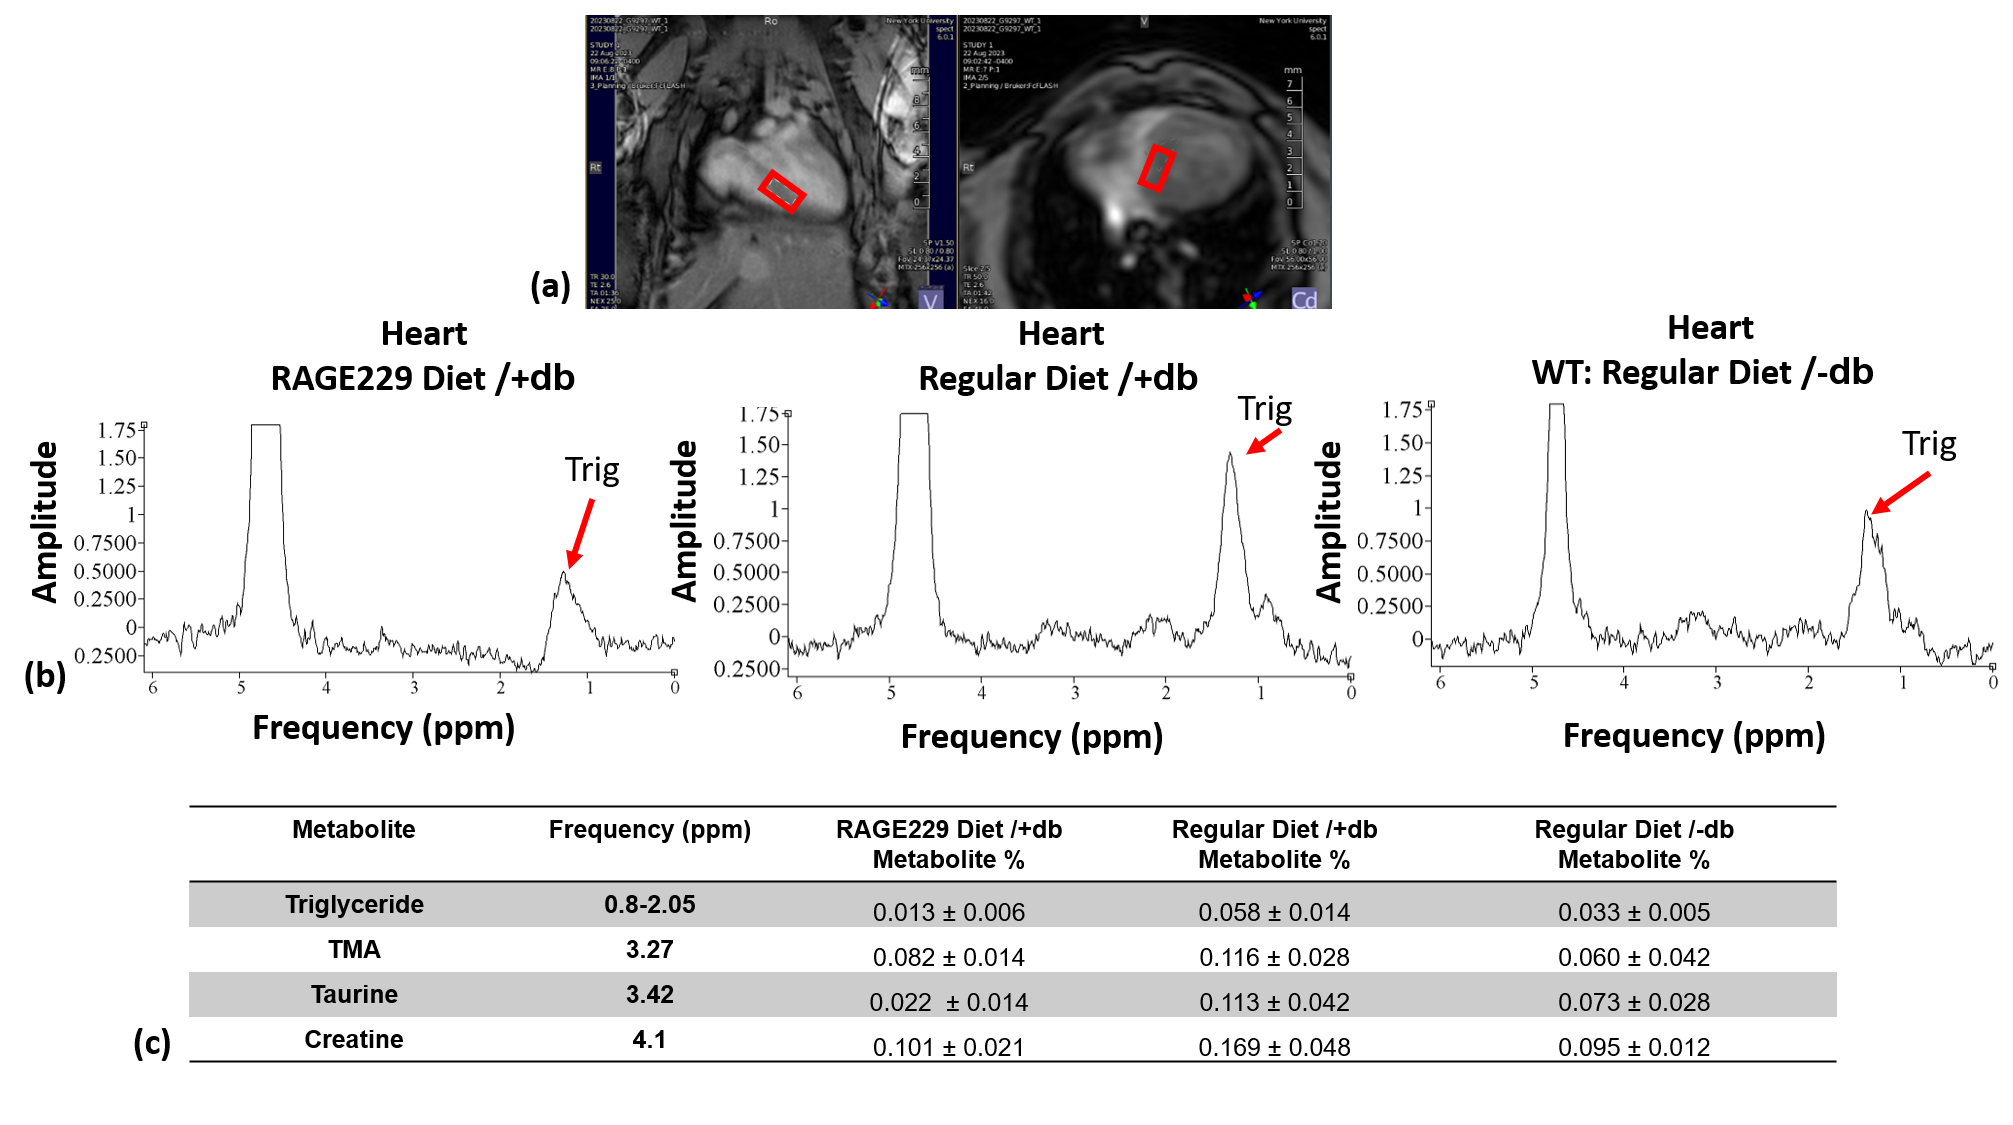
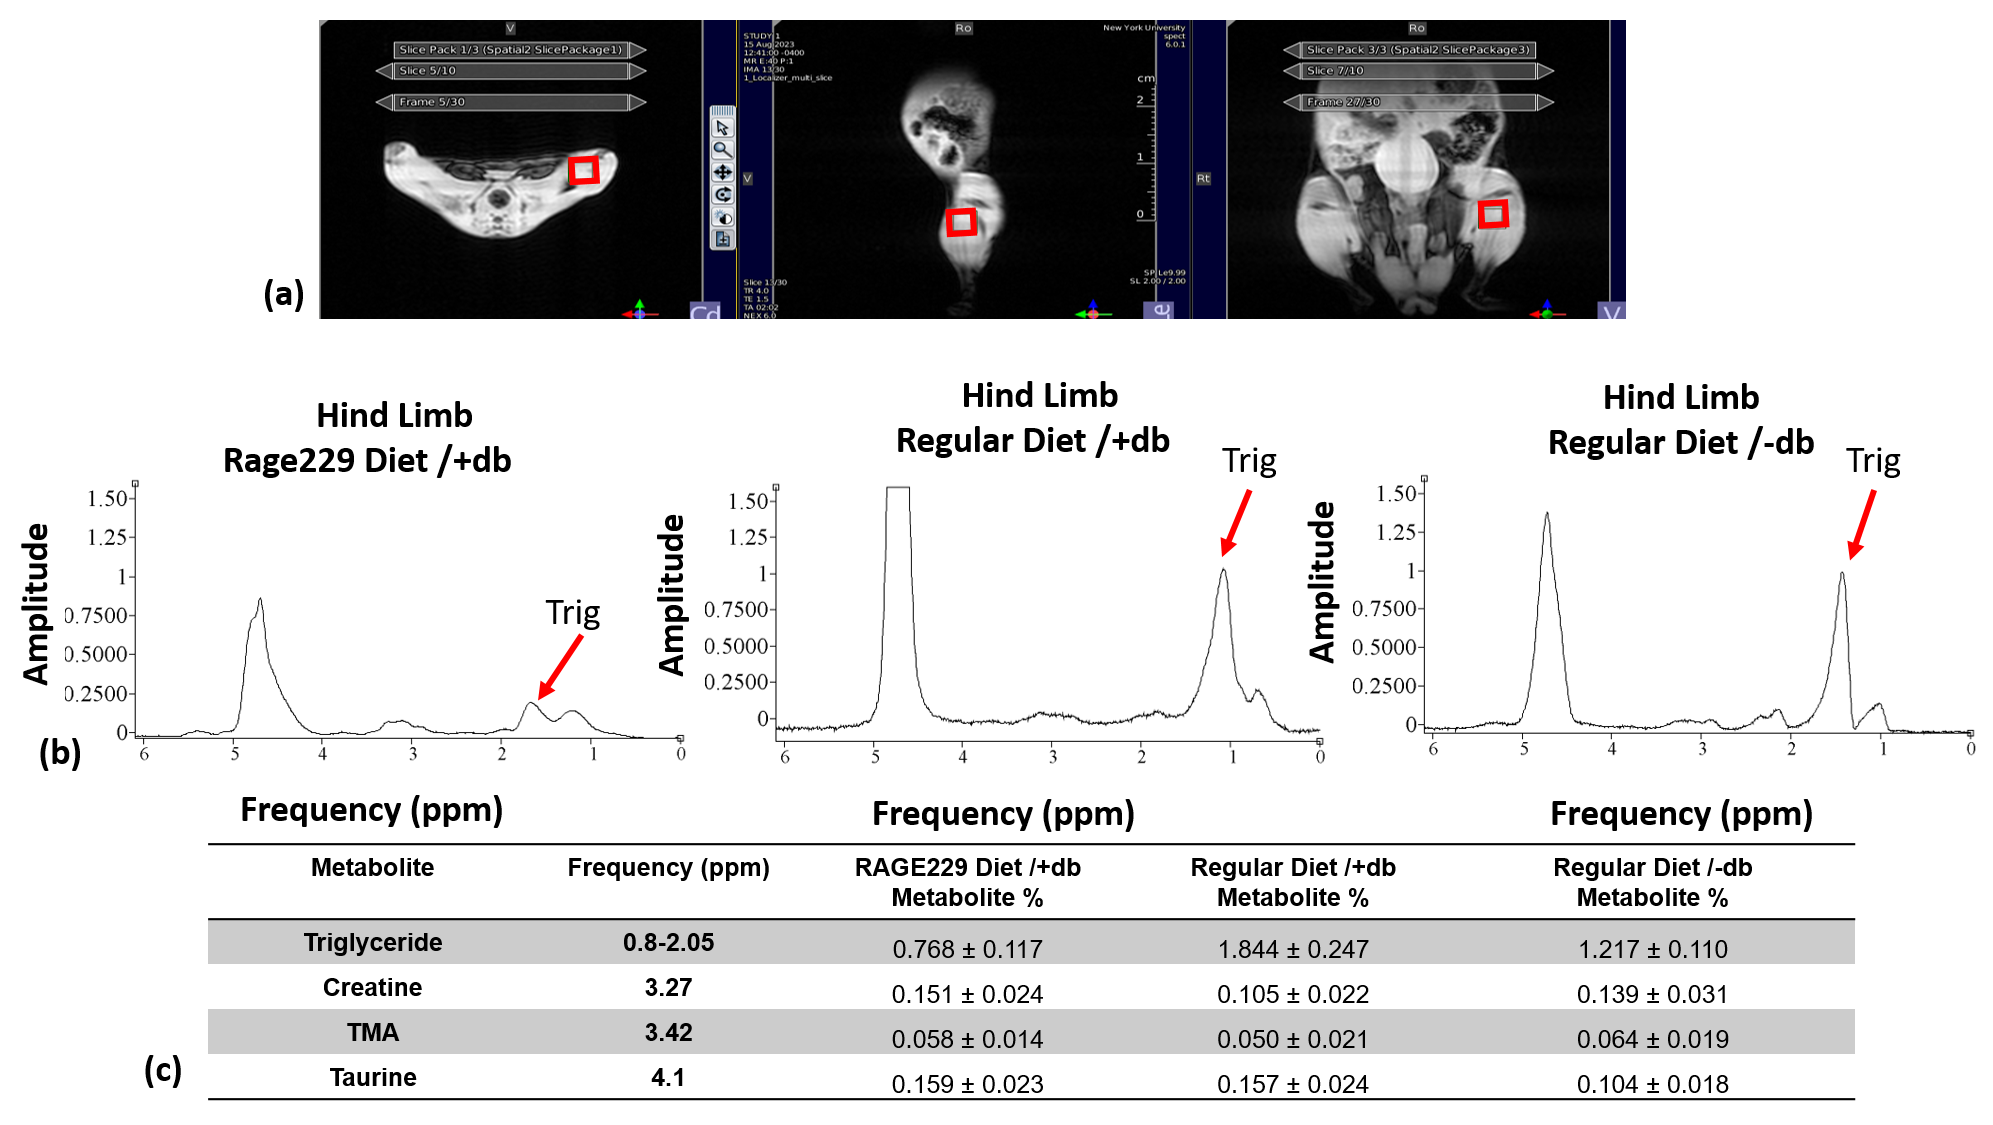
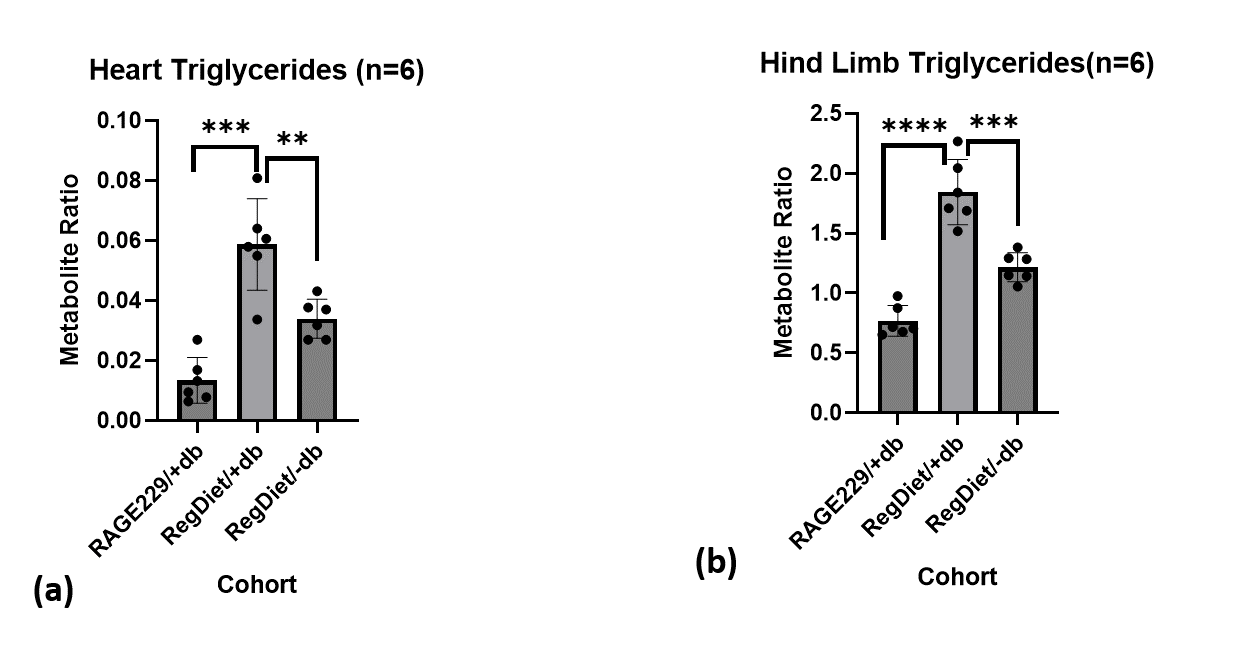
Figure 2 shows the 1H-MRS results from the heart. Representative heart spectra from the three cohorts for Rage229/+db, RegDiet/+db, and RegDiet/-db are shown. All the spectra are normalized to an external water reference. The table in Figure 2 shows the percent metabolite for each cohort. Figure 3 shows the results for the hind-limb.Figure 4(a) shows the heart triglycerides in the three cohorts. There are significant differences in the combined triglycerides between Rage229/+db vs RegDiet/+db (P<0.01) and between the diabetic and non-diabetic cohort, RegDiet/+db vs RegDiet/-db (P<0.01). Similar results with significant differences (P<0.01) are observed between cohorts in the hind limb spectra.
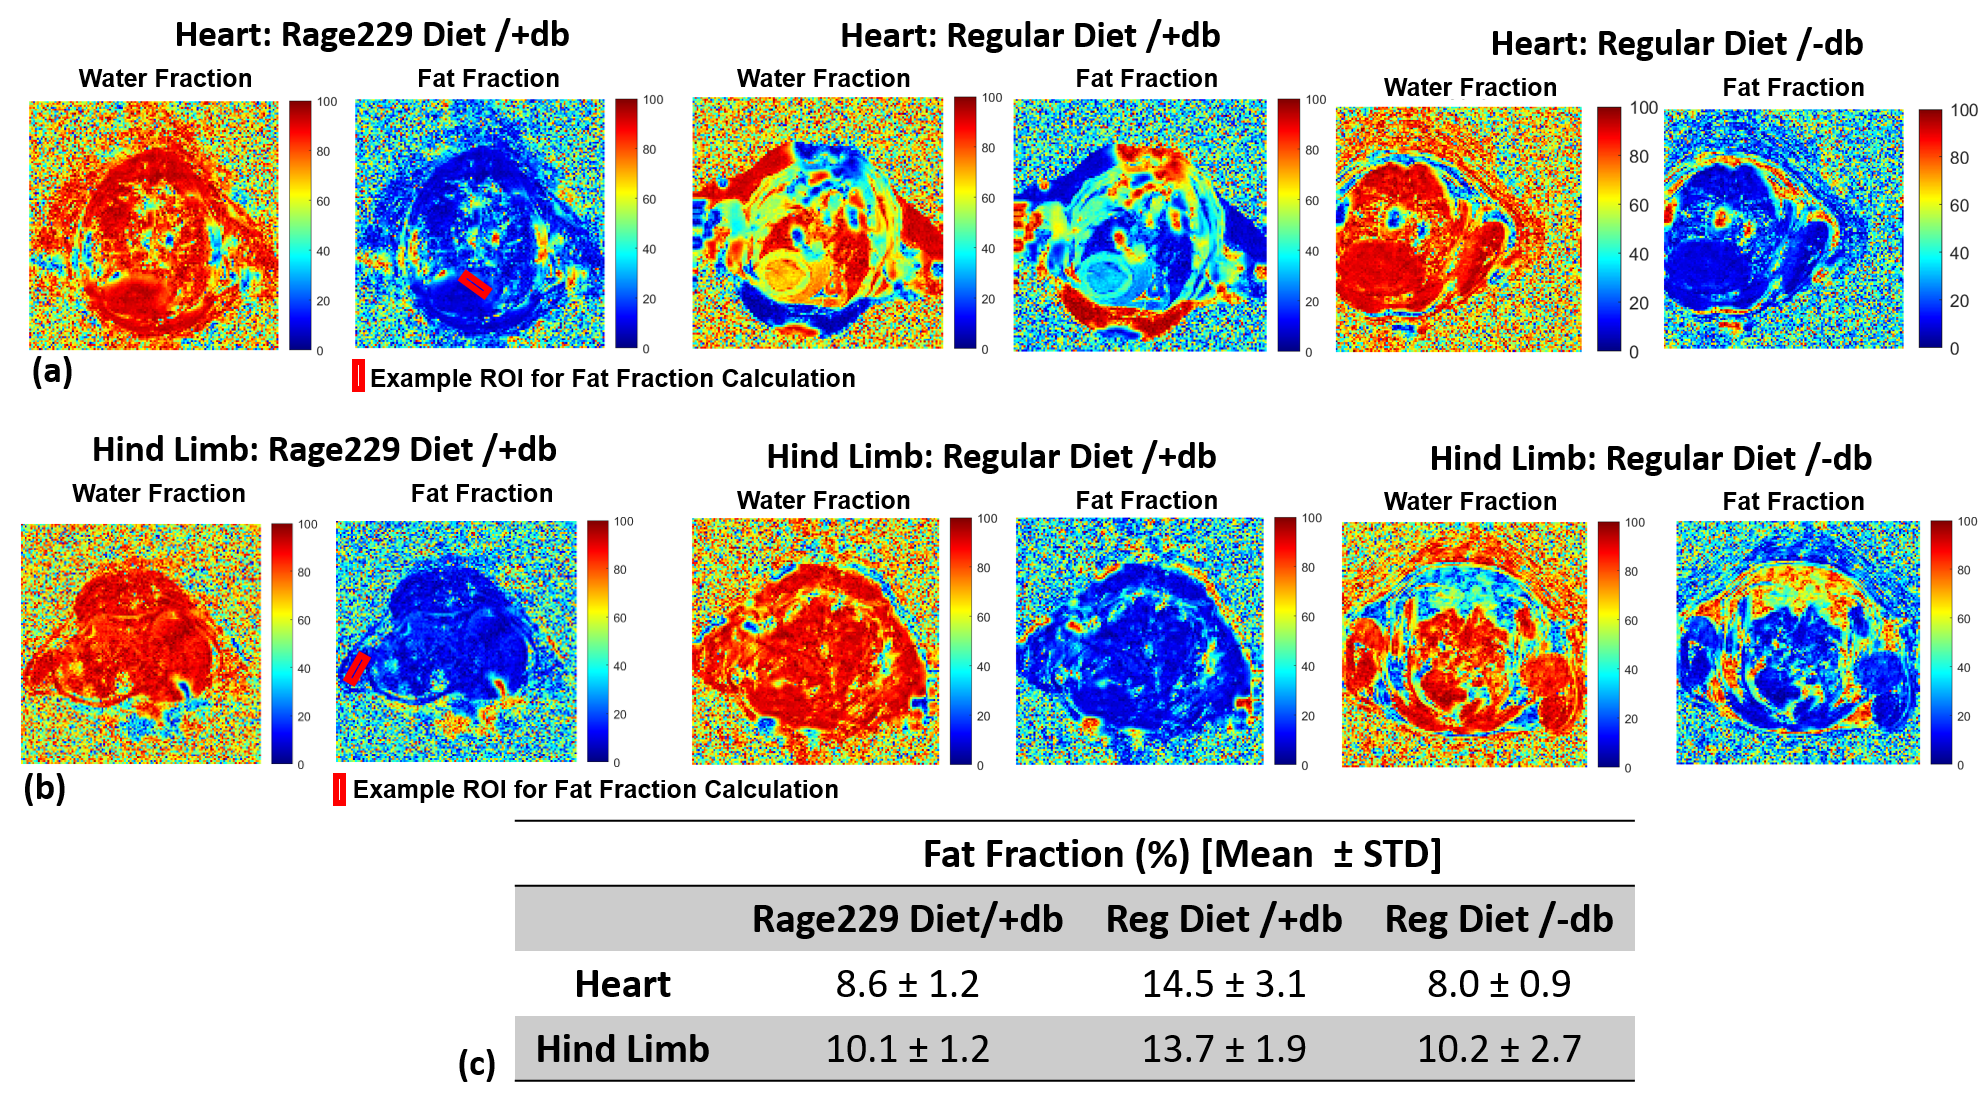
Figure 5 shows the results from the CSE-MRI. In the myocardium of the heart, there are significant decrease in the fat fraction in the Rage229/+db vs RegDiet/+db (P<0.01) and between RegDiet/+db vs RegDiet/-db (P<0.01). In the hind limb, the differences between cohorts were considerable but did not reach significance.
DISCUSSION
This study shows that the differences in metabolite concentration resulting from blockade of RAGE-DIAPH1 interaction can be investigated using 1H-MRS and CSE imaging. The data suggests that the Rage229 diet inhibits the RAGE-DIAPH1 significant reductions in heart and hind limb triglyceride levels in T1D mice. These findings set the stage for further testing of RAGE229 as potential therapeutic adjuncts in alleviating metabolic dysfunction in T1D.Acknowledgements
This study was supported by NIH grants PO1 HL146367, RO1 DK109675, R01-AR076328-01A1, and R01-AR076985-01A1, and was performed under the rubric of the Center for Advanced Imaging Innovation and Research (CAI2R, www.cai2r.net), an NIBIB National Center for Biomedical Imaging and Bioengineering (NIH P41 EB017183).References
1. O'Shea KM, Ananthakrishnan R, Li Q, et al. The Formin, DIAPH1, is a Key Modulator of Myocardial Ischemia/Reperfusion Injury. EBioMedicine. Dec 2017;26:165-174. doi:10.1016/j.ebiom.2017.11.012
2. Manigrasso MB, Pan J, Rai V, et al. Small Molecule Inhibition of Ligand-Stimulated RAGE-DIAPH1 Signal Transduction. Sci Rep. Mar 3 2016;6:22450. doi:10.1038/srep22450
3. Toure F, Fritz G, Li Q, et al. Formin mDia1 mediates vascular remodeling via integration of oxidative and signal transduction pathways. Circ Res. May 11 2012;110(10):1279-93. doi:10.1161/CIRCRESAHA.111.262519
4. Carr KD, Weiner SP, Vasquez C, Schmidt AM. Involvement of the Receptor for Advanced Glycation End Products (RAGE) in high fat-high sugar diet-induced anhedonia in rats. Physiol Behav. Nov 1 2023;271:114337. doi:10.1016/j.physbeh.2023.114337
5. Stefan D, Di Cesare F, Andrasescu A, et al. Quantitation of magnetic resonance spectroscopy signals: the jMRUI software package. Meas Sci Technol. Oct 2009;20(10)doi:Artn 104035 10.1088/0957-0233/20/10/104035
6. Graveron-Demilly D. Quantification in magnetic resonance spectroscopy based on semi-parametric approaches. MAGMA. Apr 2014;27(2):113-30. doi:10.1007/s10334-013-0393-4
7. Near J, Harris AD, Juchem C, et al. Preprocessing, analysis and quantification in single-voxel magnetic resonance spectroscopy: experts' consensus recommendations. NMR Biomed. May 2021;34(5):e4257. doi:10.1002/nbm.4257
8. Reeder
SB, McKenzie CA, Pineda AR, et al. Water-fat separation with IDEAL
gradient-echo imaging. J Magn Reson
Imaging. Mar 2007;25(3):644-52. doi:10.1002/jmri.20831
Figures