3514
Assessment of prostate tissue response to brachy- and external beam radiotherapy using 1H MRS1Department of Medical Physics, Uppsala University Hospital, Uppsala, Sweden, 2Philips Nordic, Stockholm, Sweden, 3Department of Surgical Sciences, Uppsala University Hospital, Uppsala, Sweden, 4Department of Oncology, Uppsala University Hospital, Uppsala, Sweden
Synopsis
Keywords: Prostate, Cancer, prostate cancer, brachytherapy, radiotherapy, MR spectroscopy
Motivation: Monitoring time-dependent effects of prostate brachy- and radiotherapy.
Goal(s): Assessment of prostate metabolic activity during and three months after the completion of brachy- and/or external beam radiotherapy.
Approach: Single-voxel 1H-MRS with a surface receiver coil.
Results: It is demonstrated that the proposed 1H-MRS approach is a useful tool for monitoring metabolic changes in prostate tissues treated with brachy- and/or external beam radiotherapy. We found reduction of citrate intensity close to the noise level to be the most reliable measure for identification of metabolic atrophy and response to therapy.
Impact: Single-voxel 1H-MRS with a surface receiver coil is an effective method for monitoring the response of prostate tissues to brachy- and/or external beam radiotherapy. Good response to prostate radiotherapy might be characterized by low citrate intensity.
Introduction
External beam radiotherapy (EBRT), brachytherapy (BT), and a combination of BT with EBRT are among common treatments for localized prostate cancer (PCa)1. Published studies reveal variations in treatment approaches, both in total radiation dose delivered to the prostate and in efficiency of the treatment2,3. The assessment of prostate response to radiotherapy (RT) is an active area of research4. The purpose of this work was assessment of prostate metabolic activity using single-voxel MRS with a surface receiver coil during and three months after the completion of BT and/or EBRT.Methods
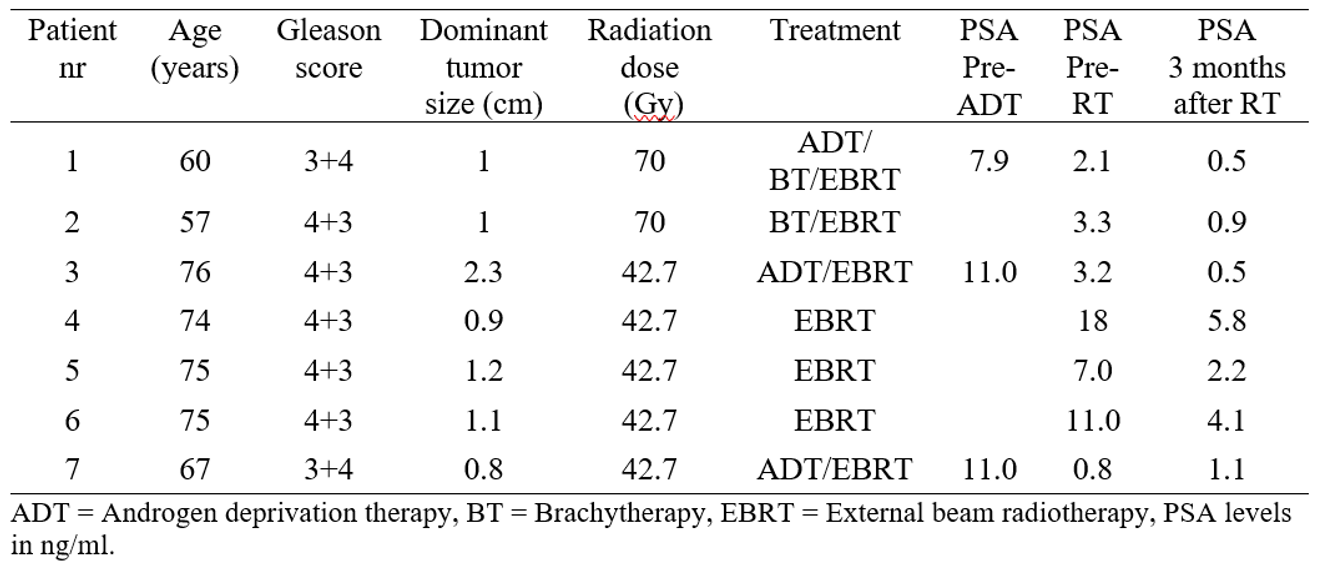
Seven patients with biopsy-proven localized intermediate-risk prostate cancer (PCa) participated in this study (Table 1). Two patients (1 and 2) received combined BT and EBRT and five were treated by EBRT only. Three patients (1, 3, 7) received short-course neo-adjuvant androgen-deprivation therapy (ADT) before the start of therapy. None of the other patients (2, 4, 5, 6) had received any other treatment for PCa prior to therapy. MR examinations were performed on a 3T clinical scanner (Elition, Philips Healthcare, Best, the Netherlands). MRI/MRS acquisitions were performed one week before treatment, after first BT, twice during EBRT, and 3 months after RT. A 32-channel surface receiver coil was used for imaging and spectroscopy. Single-voxel 1H-MRS was performed with the PRESS sequence (TR/TE 1500/140 ms, spectral bandwidth 2000 Hz, 1024 time domain points, phase cycling 16). Sixteen non-water suppressed acquisitions were followed by 384 water-suppressed scans. Water suppression was performed by pre-pulses and by band-selective inversion with gradient dephasing (BASING) pulses5. Fat suppression was achieved by a frequency-selective inversion recovery pre-pulse. The largest possible voxel was placed inside the prostate. The total MRI/MRS examination time was approximately 30 minutes. Choline (Cho), polyamines (PA), creatine (Cr), and citrate (Cit) spectral lines were fitted by LCModel6.Results and discussion
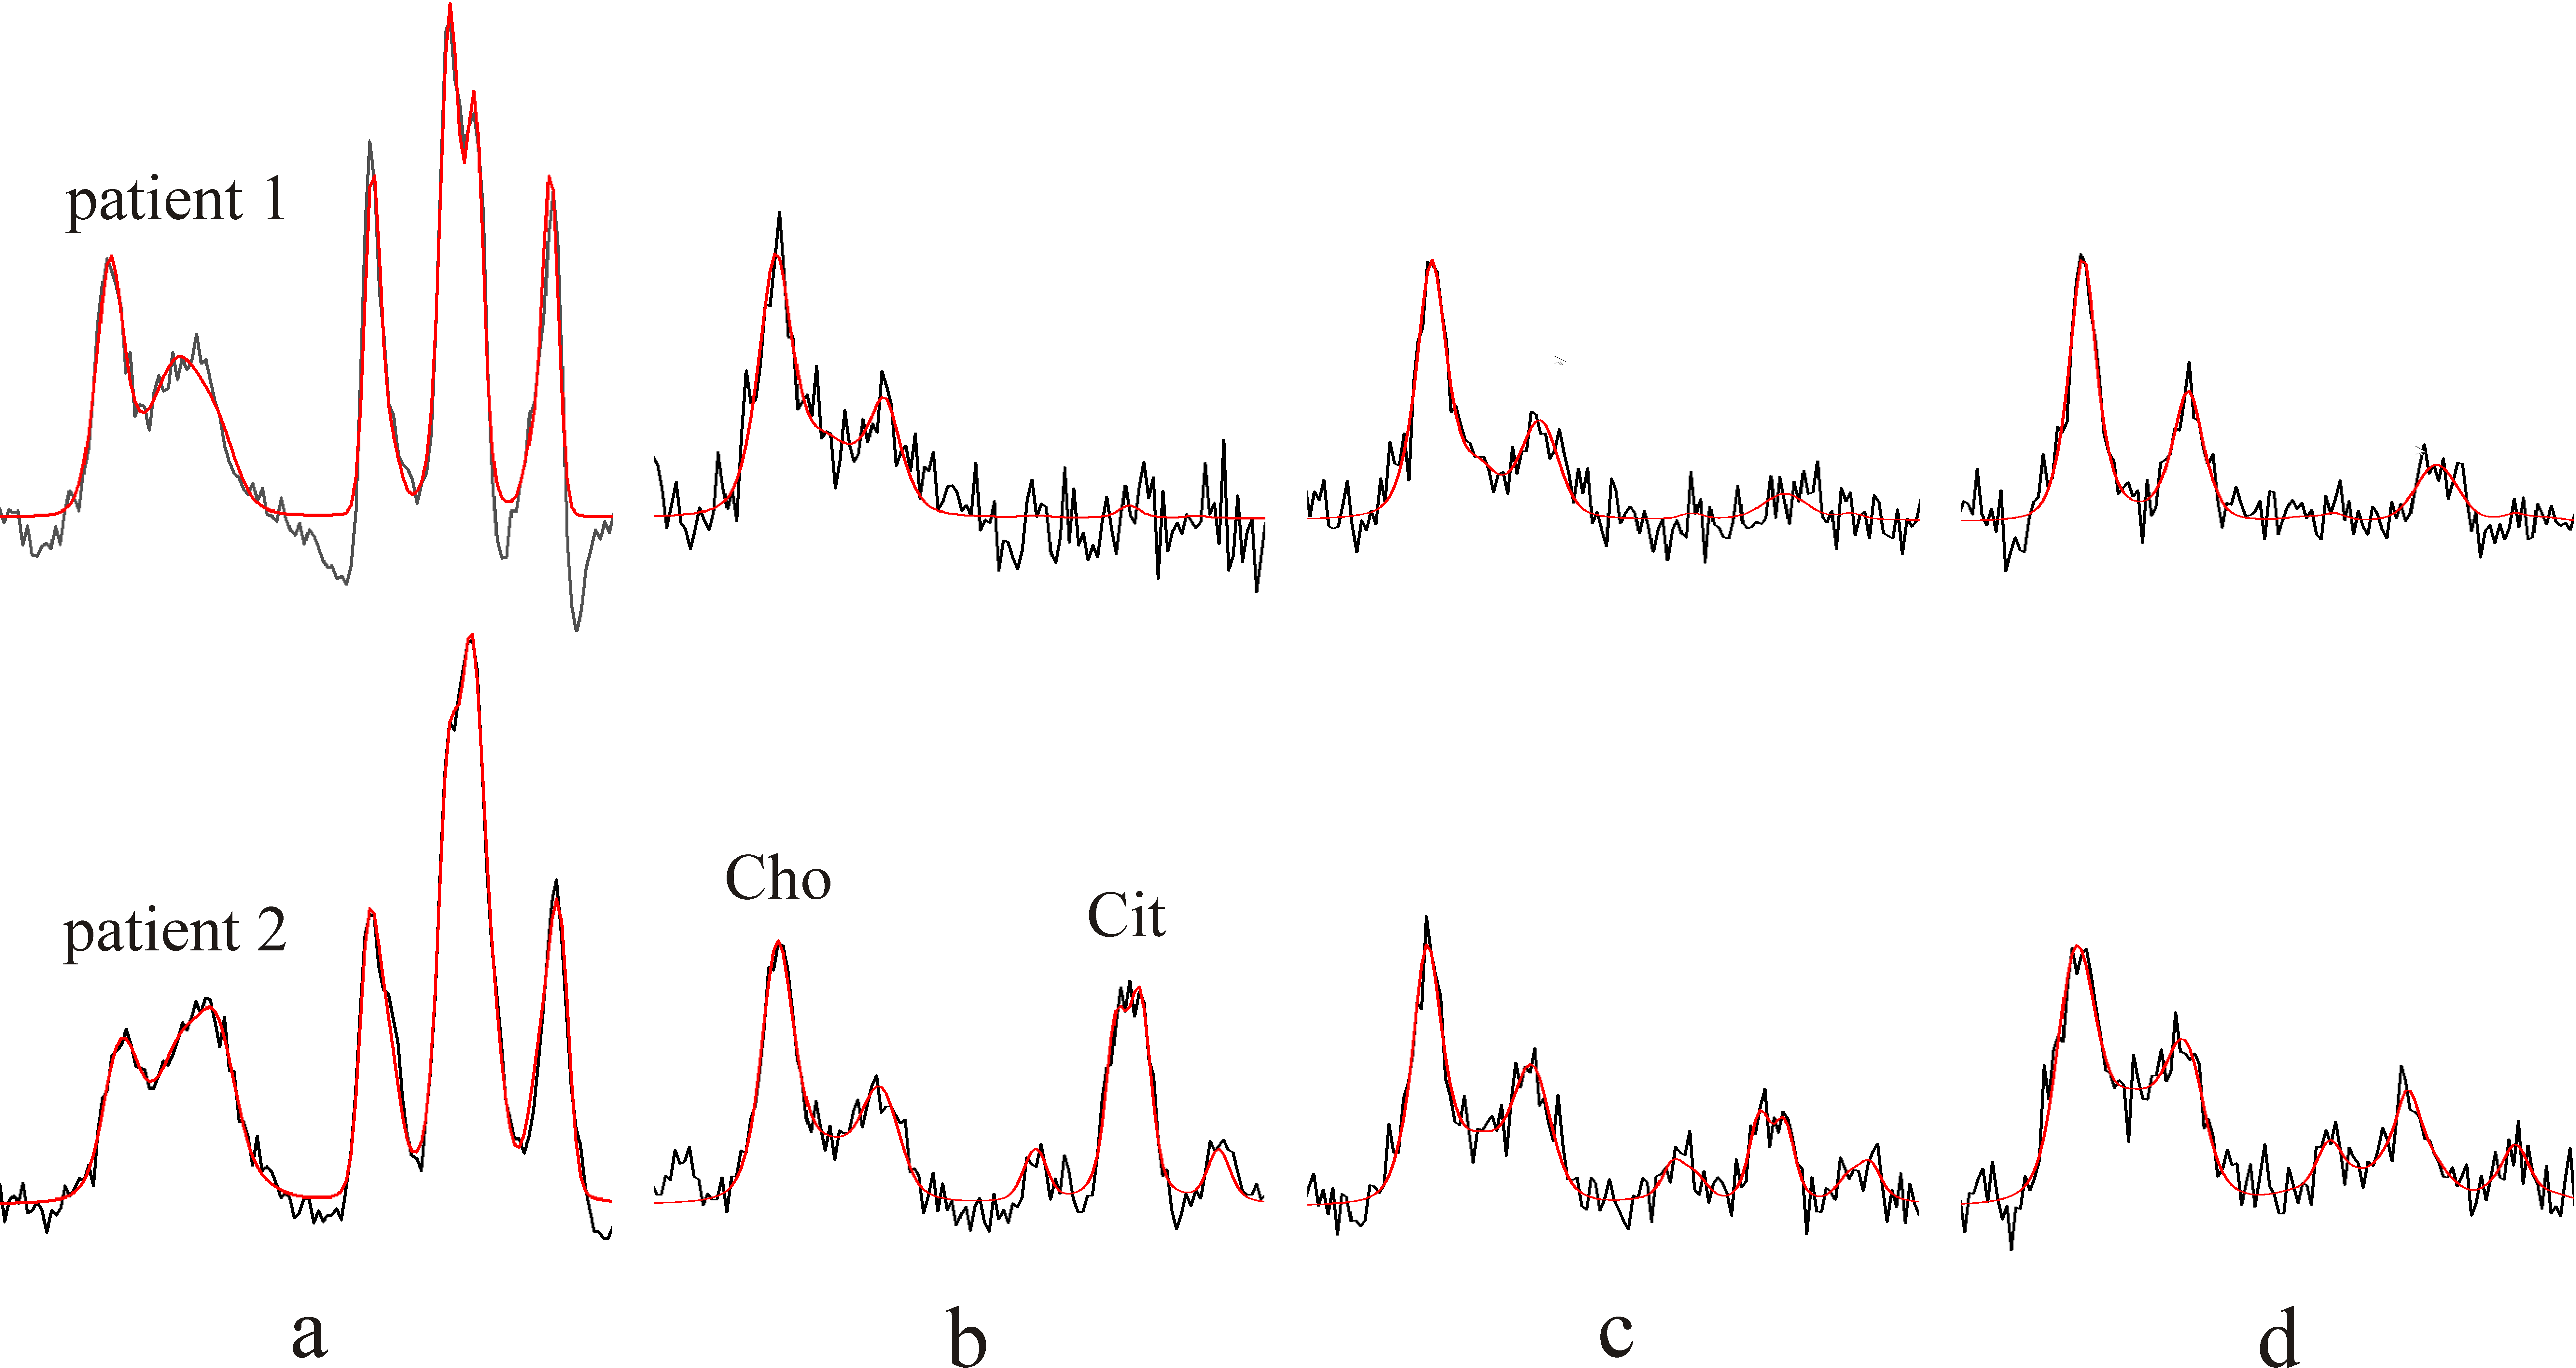

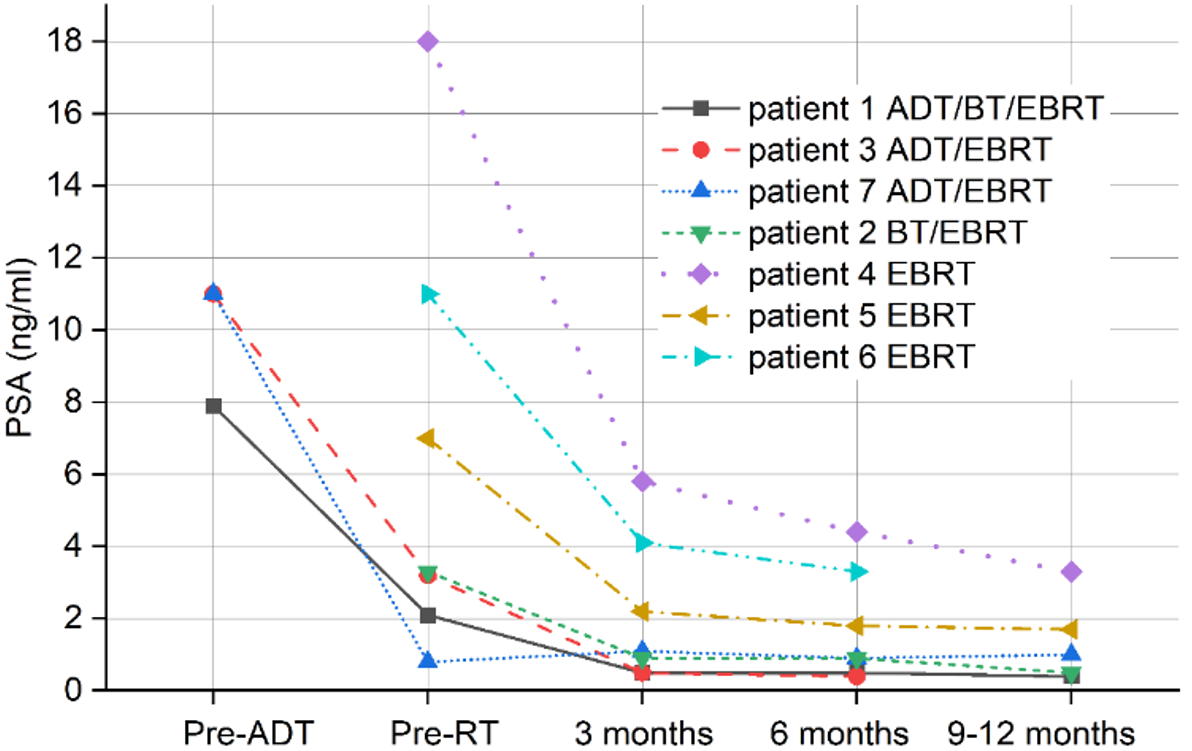
Prostate metabolic activity was assessed using single-voxel MRS with a surface receiver coil rather than 3D MRSI. An endorectal coil is required in 3D MRSI but it is contraindicated in patients during RT, after RT and in patients with colo-rectal conditions. The mean voxel size and water linewidth after shimming were 18.1±5.5 cm3, and 16.5±3.9 Hz, respectively. SNR of the spectra was in the range 4-15. The spectra of patients 1 and 2 treated with BT and EBRT are shown in Fig. 1. Spectra of patients treated only with EBRT are shown in Fig. 2. The intensities of PA and Cit are noticeably decreased after the second BT (Fig. 1c). Spectral intensity of Cit dropped almost to the noise level three months after the end of EBRT (Fig. 1d) and PSA levels decreased (Fig. 3, Table 1) indicating very good biochemical response of prostate to the treatment. Spectra of patients treated only by EBRT (Fig. 2) reveal gradual decrease of PA and Cit intensities. Cit decreased considerably three months after the end of EBRT (Fig. 2d). This together with declining PSA levels (Fig. 3) reveal an apparent biochemical response to therapy. The exception was patient 4 (Fig. 2d) with a relatively high Cit intensity three months after the end of EBRT. This demonstrates the worst metabolic response to EBRT. Mean Cho/(PA+Cr) spectral intensity ratio of all patients before therapy was 0.59±0.36 increasing to 1.17±0.5 three months after the end of therapy. Mean Cit/(Cho+PA+Cr) ratio of all patients with the exception of patient 4 was 0.32±0.13 three months after the end of therapy. The excluded patient 4 had a ratio of 0.79. This strengthens our belief that a good response to therapy might be expressed by the spectral intensity ratio Cit/(Cho+PA+Cr) < 0.32±0.13. Previous studies reported RT-induced decrease of Cho intensity in addition to the much faster reduction of PA and Cit spectral lines7,8. To verify the decrease of Cho intensity, we used SNR of the Cho spectral line as a measure of the Cho content. For each patient, only minimal differences were found between Cho SNR after the first irradiation fractions (Figs. 1b, 2b) and SNR three months after the end of therapy (Figs. 1d, 2d). In other words, RT induced changes in Cho concetration were small (if any). One can therefore conclude that the reduction of Cit intensity close to the noise level seems to be the most reliable measure for identification of metabolic atrophy and response to therapy.Conclusion
Single-voxel spectroscopy is a useful tool for monitoring metabolic changes in prostate treated with BT and/or EBRT. Our results suggest that a good biochemical response to RT of intermediate-risk PCa, might be characterized by low Cit intensity. Spectroscopic data of metabolic activity may provide important predictive information following RT.Acknowledgements
This study was supported by foundation of Department of Oncology, University Hospital, Uppsala, Sweden.References
1. Gwede CK, Pow-Sang J, Seigne J, et al. Treatment decision-making strategies and influences in patients with localized prostate carcinoma. Cancer. 2005;104:1381-1390.
2. Valentini AL, Benedetta G, D’Agostino GR, et al. Locally advanced prostate cancer: Three-dimensional magnetic resonance spectroscopy to monitor prostate response to therapy. Int J Radiation Oncology Biol Phys. 2012;84:719-724.
3. Song I, Kim CK, Park BK, Park W. Assessment of response to radiotherapy for prostate cancer: Value of diffusion-weighted MRI at 3 T. Am J Roentgenol. 2010;194:W477-482.
4. Sandhu S, Moore CM, Chiong E, et al. Williams SG. Prostate cancer. Lancet. 2021;398:1075-1090.
5. Star Lack J, Nelson SJ, Kurhanewicz J, et al. Improved water and lipid suppression for 3D PRESS CSI using RF band selective inversion with gradient dephasing (BASING). Magn Reson Med. 1997;38:311-321.
6. Provencher SW. Estimation of metabolite concentrations from localized in vivo proton NMR spectra. Magn Reson Med. 1993;30:672-679.
7. Pickett B, Kurhanewicz J, Coakley F, et al. Use of MRI and spectroscopy in evaluation of external beam radiotherapy for prostate cancer. Int J Radiation Oncology Biol Phys. 2004;60:1047-1055.
8. Valentini AL, Benedetta G, D’Agostino GR, et al. Locally advanced prostate cancer: Three-dimensional magnetic resonance spectroscopy to monitor prostate response to therapy. Int J Radiation Oncology Biol Phys. 2012;84:719-724.
Figures