3511
Amide proton transfer weighted imaging histogram analysis for Prostate Cancer Detection Comparison with Mp-MRI: A two center prospective study1Shaanxi Provincial People's Hospital, xi'an, China, 2lanzhou university second hospital, lanzhou, China
Synopsis
Keywords: Prostate, Prostate
Motivation: The diagnostic utility of whole tumor amide proton transfer–weighted (APTw) imaging analysis for predicting prostate cancer(PCa) has not been reported.
Goal(s): The purpose of this study was to evaluate the diagnostic performance of whole tumor APTw histogram analysis, for the depiction of PCa compared with multiparametric MRI with Prostate Imaging Reporting and Data System (PI-RADS) version 2.1.
Approach: Diagnostic performance was assessed by ROC with AUC analysis.
Results: We found that combining PI-RADS version 2.1 and APTw histogram achieved the best results in distinguishing transition zone PCa from benign prostatic hyperplasia and peripheral zone PCa from chronic prostatitis.
Impact: Whole-tumor histogram analysis of APTw images improved the diagnostic performance of multiparametric MRI with PI-RADS version 2.1 in detecting prostate cancer in both the peripheral and transition zones.
Introduction
The incidence of prostate cancer(PCa) has increased by 42% worldwide since 2007 [1]. Prognosis and treatment planning are greatly impacted by an early and correct diagnosis. The PI-RADS version is used in clinical routine to determine the possibility of clinically significant PCa[2]. PI-RADS version 2.1 is not without its drawbacks, though, since it has a relatively high false-positive and false-negative rate, moderate interreader agreement, and diagnostic problems owing to overlapping imaging features between benign prostatic illness and PCa[3, 4]. APTw imaging has been demonstrated in recent studies to aid in PCa prediction[5, 6]. A first-order statistical technique that quantifies the characteristics of each individual pixel value is a histogram[7, 8]. Histogram analysis yields additional parameters regarding tumor heterogeneity than the mean values obtained from the traditional region of interest(ROI) approach. However, no study has investigated the utility of APTw-derived whole-tumor histogram analysis for predicting PCa. Therefore, the purpose of this study was to evaluate the diagnostic performance of whole tumor APTw histogram analysis, for depiction of PCa compared with multiparametric(mp) MRI with PI-RADS version 2.1.Materials and methods
Prospective participants suspected to have PCa underwent mp MRI and APT imaging between March 2021 and July 2023. Two radiologists analyzed the images and segmented the tumor independently using ITK software. The APTw histogram parameters of primary tumors were obtained automatically using whole-tumor volume histogram analysis. The independent risk factors markedly correlated with PCa were assessed using univariate and multivariate logistic regression analyses. Diagnostic performance of histogram analysis for APTw, PI-RADS Version 2.1, and their combination was assessed with the area under the receiver operating characteristic curve (AUC) analysis for differentiating PCa from benign lesions. AUC values were compared by using the Delong test.Results
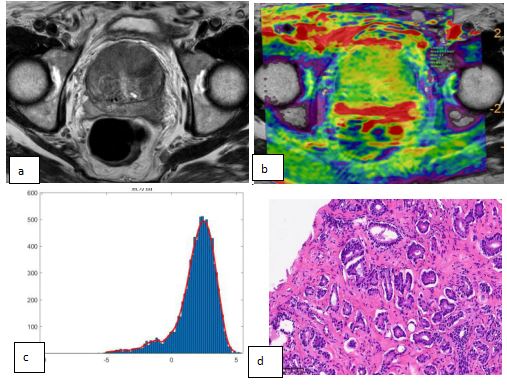
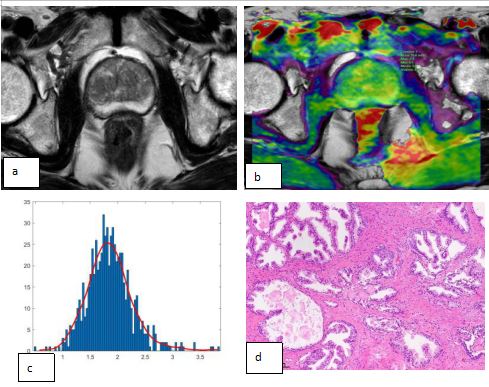
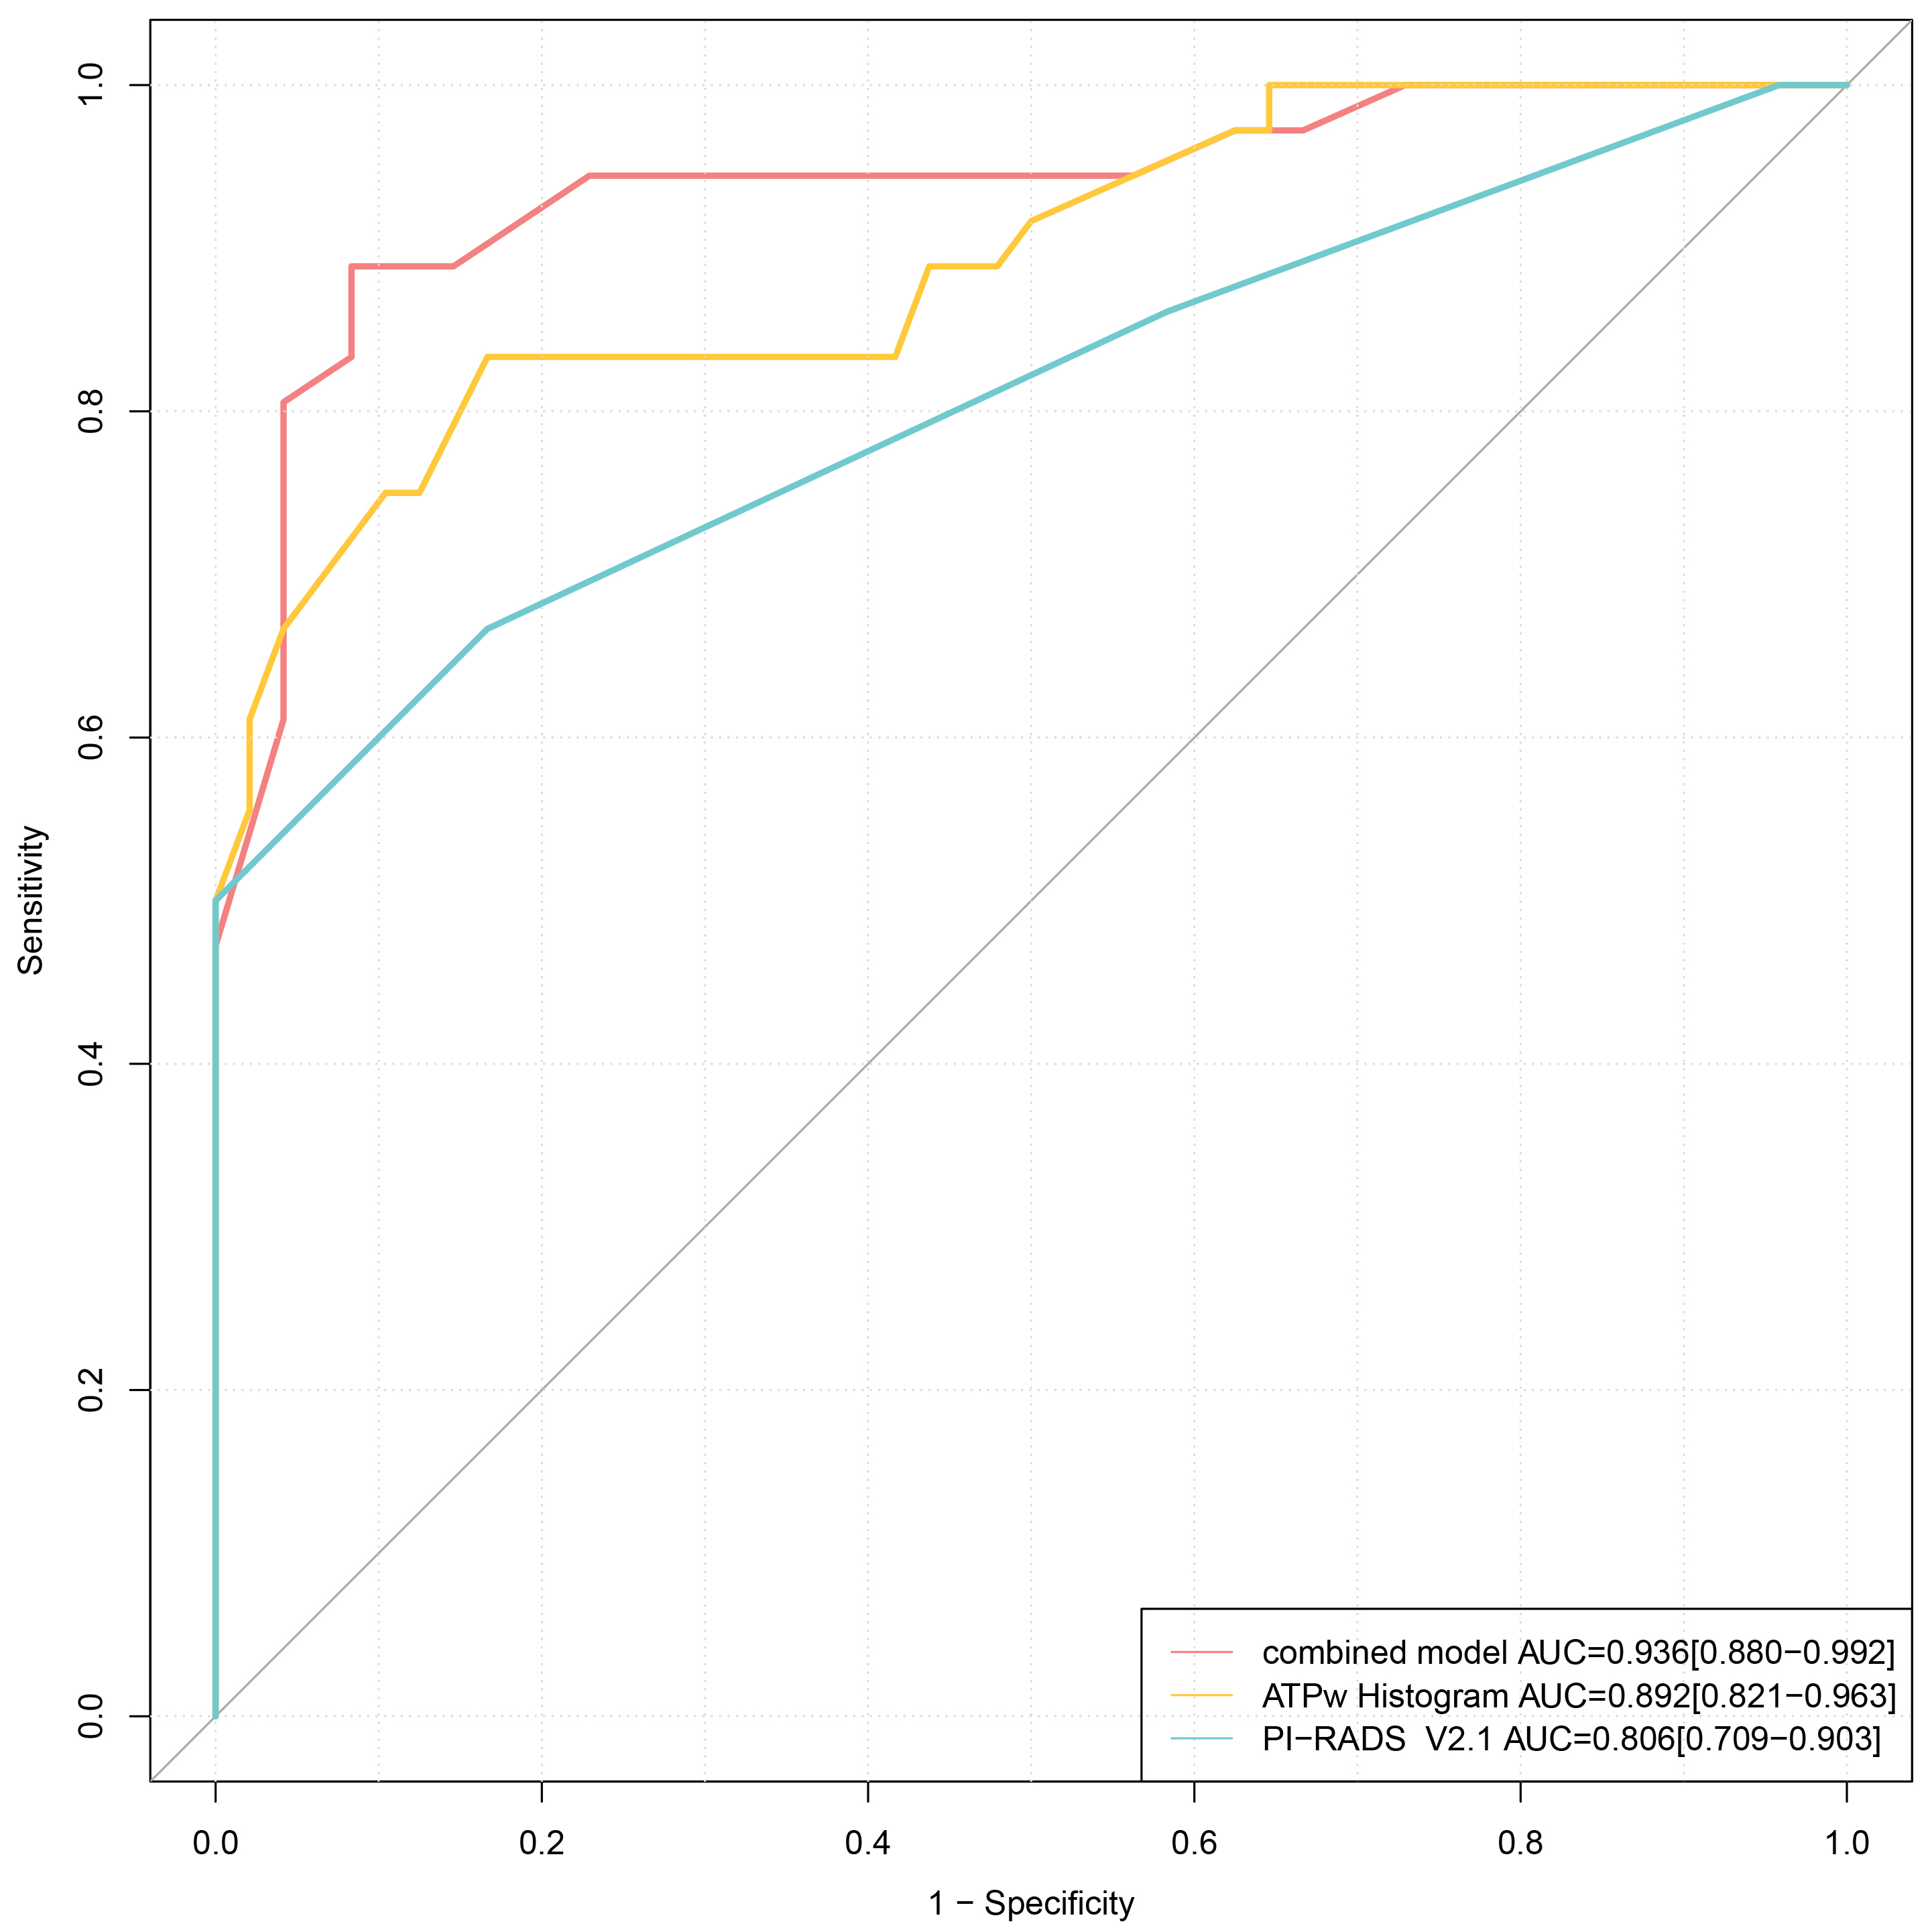
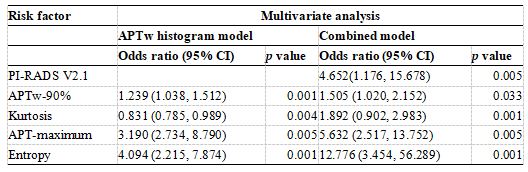
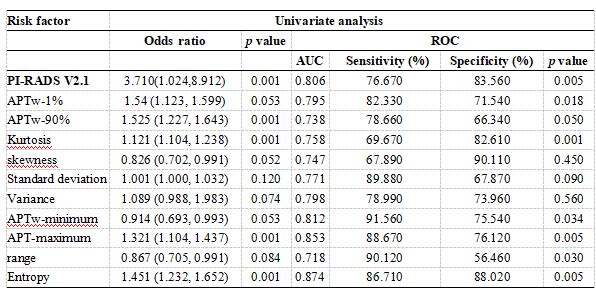
There were 246 participants with PCa and 102 with benign prostatic disease. The ICC of the histogram parameters assessment of the two radiologists was pretty good (ICC value > 0.87). Figure 1 and 2 showed two representative examples of PCa and prostate hyperplasia. Univariate analysis demonstrated that PI-RADS Version 2.1, APTw-1%, APTw-90%, APTw-minimum, APTw-maximum, entropy, kurtosis, skewness, Standard deviation, Variance, and range were significantly related to PCa (all p<0.05). Multivariate analysis demonstrated that PI-RADS Version 2.1(OR=4.652, p=0.005), APTw-90% (OR=1,505, p=0.033), APTw-maximum (OR=5.632, p=0.005), entropy (OR=12.776 p=0.001), and kurtosis (OR=1.892, p=0.001) were the independent risk factors enabling prediction PCa. The AUCs for the diagnostic ability of PI-RADS version 2.1, the APTw histogram model, and the combined model (including APTw histogram and PI-RADS Version 2.1) were 0.806, 0.892, and 0.936, respectively (Figure 3). The combined model outperformed the APTw histogram model (p=0.023) and the PI-RADS Version 2.1 (p=0.005). In regional analysis, APT-maximum combined with entropy enabled the differentiation of transition zone PCa from benign prostatic hyperplasia (AUC, 0.90) and peripheral zone PCa from chronic prostatitis (AUC, 0.93).Discussion
In this study, we assessed the diagnostic performance of APTw histogram in detecting cancer and compared it with mp-MRI. A key finding was that combining PI-RADS version 2.1 and APTw histogram achieved the best results in distinguishing PCa from benign prostatic disease (AUC, 0.936; P, .001). Our findings—that PCa could be distinguished from benign prostatic disease based on APTw-90%, APTw-maximum, entropy, and kurtosis. The higher entropy of PCa might be attributed to enhanced cellularity and collagen deposition. In addition, APT-maximum and entropy separated PCa in the peripheral zone from chronic prostatitis (AUC, 0.93) and PCa in the transition zone from benign prostatic hyperplasia (AUC, 0.90); both are hard in clinical differential diagnosis. Histogram analysis describes the distribution information of pixel intensity within the tumor. The higher kurtosis and entropy values of APTw histograms suggest tumor heterogeneity regarding the difference in mobile proteins and peptides in the proliferating tumor cells, which may be interpreted by increased cellular density and cytoplasmic protein[9,10].Conclusions
Whole-tumor histogram analysis of APTw images improved the diagnostic performance of mp-MRI with PI-RADS version 2.1 in detecting cancer in both the peripheral and transition zonesAcknowledgements
We are grateful to all the participants for their cooperation and patience.References
1.Global Burden of Disease Cancer Collaboration; Fitzmaurice C, Abate D, et al. Global, Regional, and National Cancer Incidence, Mortality, Years of Life Lost, Years Lived With Disability, and Disability-Adjusted Life-Years for 29 Cancer Groups, 1990 to 2017: A Systematic Analysis for the Global Burden of Disease Study. JAMA Oncol. 2019;5(12):1749–1768.
2. Sánchez-Oro R, Nuez JT, Martínez-Sanz G, et al. Prostate MRI: practical guidelines for interpreting and reporting according to PI-RADS version 2.1. Radiologia (Engl Ed). 2020; 62(6):437-451.
3. Drost FH, Osses D, Nieboer D, et al. Prostate Magnetic Resonance Imging, with or Without Magnetic Resonance Imaging-targeted Biopsy, and Systematic Biopsy for Detecting Prostate Cancer: A Cochrane Systematic Review and Meta-analysis. Eur Urol. 2020;77(1):78–94.
4. Borofsky S, George AK, Gaur S, et al. What Are We Missing? False-Negative Cancers at Multiparametric MR Imaging of the Prostate. Radiology. 2018; 286(1):186–195.
5. Yang L, Wang L, Tan Y, et al. Amide Proton Transfer-weighted MRI combined with serum prostate-specific antigen levels for differentiating malignant prostate lesions from benign prostate lesions: a retrospective cohort study. Cancer Imaging. 2023 ;7;23(1):3.
6. Takayama Y, Nishie A, Sugimoto M, et al. Amide proton transfer (APT) magnetic resonance imaging of prostate cancer: comparison with Gleason scores. MAGMA. 2016;29(4):671-9.
7.Just N. Improving tumour heterogeneity MRI assessment with histograms. Br J Cancer. 2014;111:2205–2213.
8. Cui Y, Yang X, Du X, et al. Whole tumour difusion kurtosis MR imaging histogram analysis of rectal adenocarcinoma: correlation with clinical pathologic prognostic factors. Eur Radiol. 2018; 28:1485–1494.
9.Zhou JY, He OY, Knutsson L, et al. APT-weighted MRI: techniques, current neuro applications, and challenging issue. J Magn Reson Imaging.2019;50(2): 347-364.
10. Guo ZX, Qin XY, Mur H, et al. Amide proton transfer could provide more accurate lesion characterization in the transition zone of the prostate. J Magn Reson Imaging. 2022, 56( 5): 1311- 1319.
Figures