3507
A Non-Linear Gradient Insert for Prostate Diffusion Imaging1Radiology and Biomedical Imaging, Yale University, New Haven, CT, United States, 2Biomedical Engineering, Yale University, New Haven, CT, United States, 3Neurosurgery, Yale University, New Haven, CT, United States
Synopsis
Keywords: Prostate, Cancer
Motivation: A sensitive imaging method that distinguishes benign or low-grade prostate lesions from aggressive ones is one of the greatest needs in prostate cancer.
Goal(s): To develop new prostate DWI technique using a non-linear gradient (NLG) to improve the diagnostic accuracy of prostate cancer.
Approach: Using an NLG coil, we can circumvent the challenge of high b-value requirements by having a gradient with a high amplitude within a limited field of view, which applies to prostate imaging.
Results: We demonstrate feasibility of using an NLG for prostate imaging, after validation with a polyvinylpyrrolidone (PVP) phantom and testing SE and EPI sequences with prostate ADC-mapping.
Impact: To better diagnose prostate cancer with high sensitivity, we use an NLG insert coil. Using only one DWI and one non-diffusion image we showed comparable ADC maps to those produced using gold standard multi-shell linear gradient sequences.
Introduction
Although 1 in 8 American men may receive a prostate cancer diagnosis1-3, many cases should be rejected or postponed because of the disease's sluggish course and therapy-related side effects.4,5 Yet, prostate cancer remains the second leading cancer killer in men, making early detection of aggressive cancers an urgent issue. Prostate cancer requires a monitoring method to differentiate benign lesions from aggressive ones, as standard template biopsy risks overdiagnosis, underdiagnosis, and urinary and erectile dysfunction.6-8 Diffusion-weighted MR imaging (DWI) is a noninvasive method for detecting prostate cancers, allowing quantification of apparent diffusion coefficient (ADC) maps that accurately reflect Gleason's score and aggressiveness.9,10 However, prostate DWI usually has a poor image signal-to-noise ratio (SNR) and is susceptible to motion distortions due to the time required for diffusion weighting in the pulse sequence. Nonlinear gradient coils, specifically for prostate imaging, offer a high amplitude gradient pulse, reducing echo time and increasing image SNR compared to linear gradients. The initial PVP phantom and prostate ADC maps using the NLG are presented.Methods
Following a diffusion-weighted pulse sequence, magnetization is defined as:$$M_{xy}=M_0 e^{-TE/T_2 } e^{-bD} (1)$$
where the magnetization $$$M_{xy}$$$ in Eq. 1 is proportional to both the diffusion component $$$(e^{-bD})$$$ and the T2-relaxation component $$$(e^{-TE/T_2 })$$$.
The b-value depends on the pulse sequence and is provided by11:
$$b_{ij}=γ^2 [G_i G_j δ]^2 |∆-δ/3|.$$
All the following experiments were acquired using a 3T MRI scanner (MAGNETOM Prismafit: Siemens Healthcare, Erlangen, Germany).
PVP Phantom Experiment
We first created a PVP water solution phantom with varying PVP concentrations to generate a diffusion magnetic resonance phantom. By adding PVP40 (Sigma-Aldrich, average weight 40,000) to distilled water, varying the w/v from 5% to 50%, different concentrations of PVP were produced as detailed in12 where a comparable experiment was conducted, but with a lower resolution. Two sets of diffusion data of the phantom were obtained. One uses the NLG coil insert, and the other, for validation, uses the linear gradient coil. The NLG SE sequence parameters are: TE=30 ms, and TR=1500.0 ms, 256 mm field of view (FOV), and 2x2x5mm3 resolution. In addition to a b0 image, we acquired an image using two monopolar trapezoid waveforms with 2ms duration and 60% of the NLG maximum amplitude (625A, 500V, peak:1033 mT/m).
The gold standard experiment used a RESOLVE sequence with TR=1500ms, TE=77ms and matching resolution and FOV, while the diffusion scheme used b-values of 0,200,400, and 600 s/mm2 in the linear gradient scan.
Prostate Experiment
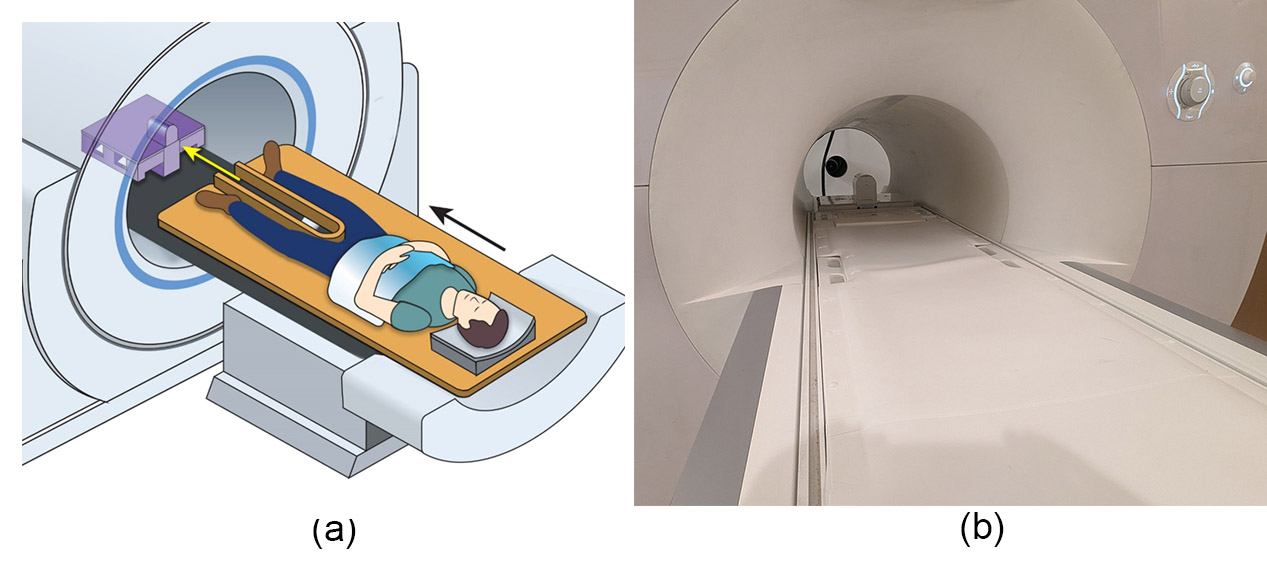
A healthy young volunteer (25 yo) was recruited for the prostate diffusion MRI. The subject enters the magnet bore feet first, as illustrated in Figure 1.(a) Two datasets were acquired using the NLG: spin-echo (SE), and 2D spin-echo (SE) echo-planar imaging (EPI).
SE-DWI with NLG
A b0 SE image was acquired for the SE, and another SE DWI using two monopolar trapezoid waveforms with 2ms duration and 60% of the NLG maximum, and the body coil used for receive.
SE-EPI-DWI with NLG
A b0 SE-EPI was acquired along with a SE-EPI-DWI using two monopolar trapezoid waveforms with 2 ms duration and 80% of the NLG maximum, with 18-channel Flex coil used for receive.
For validation (gold standard), we acquired a nine-shell RESOLVE scan with b-values:200,300,400, 500,600,800,900,1000 s/mm² and five non-diffusion weighted slices.
Results
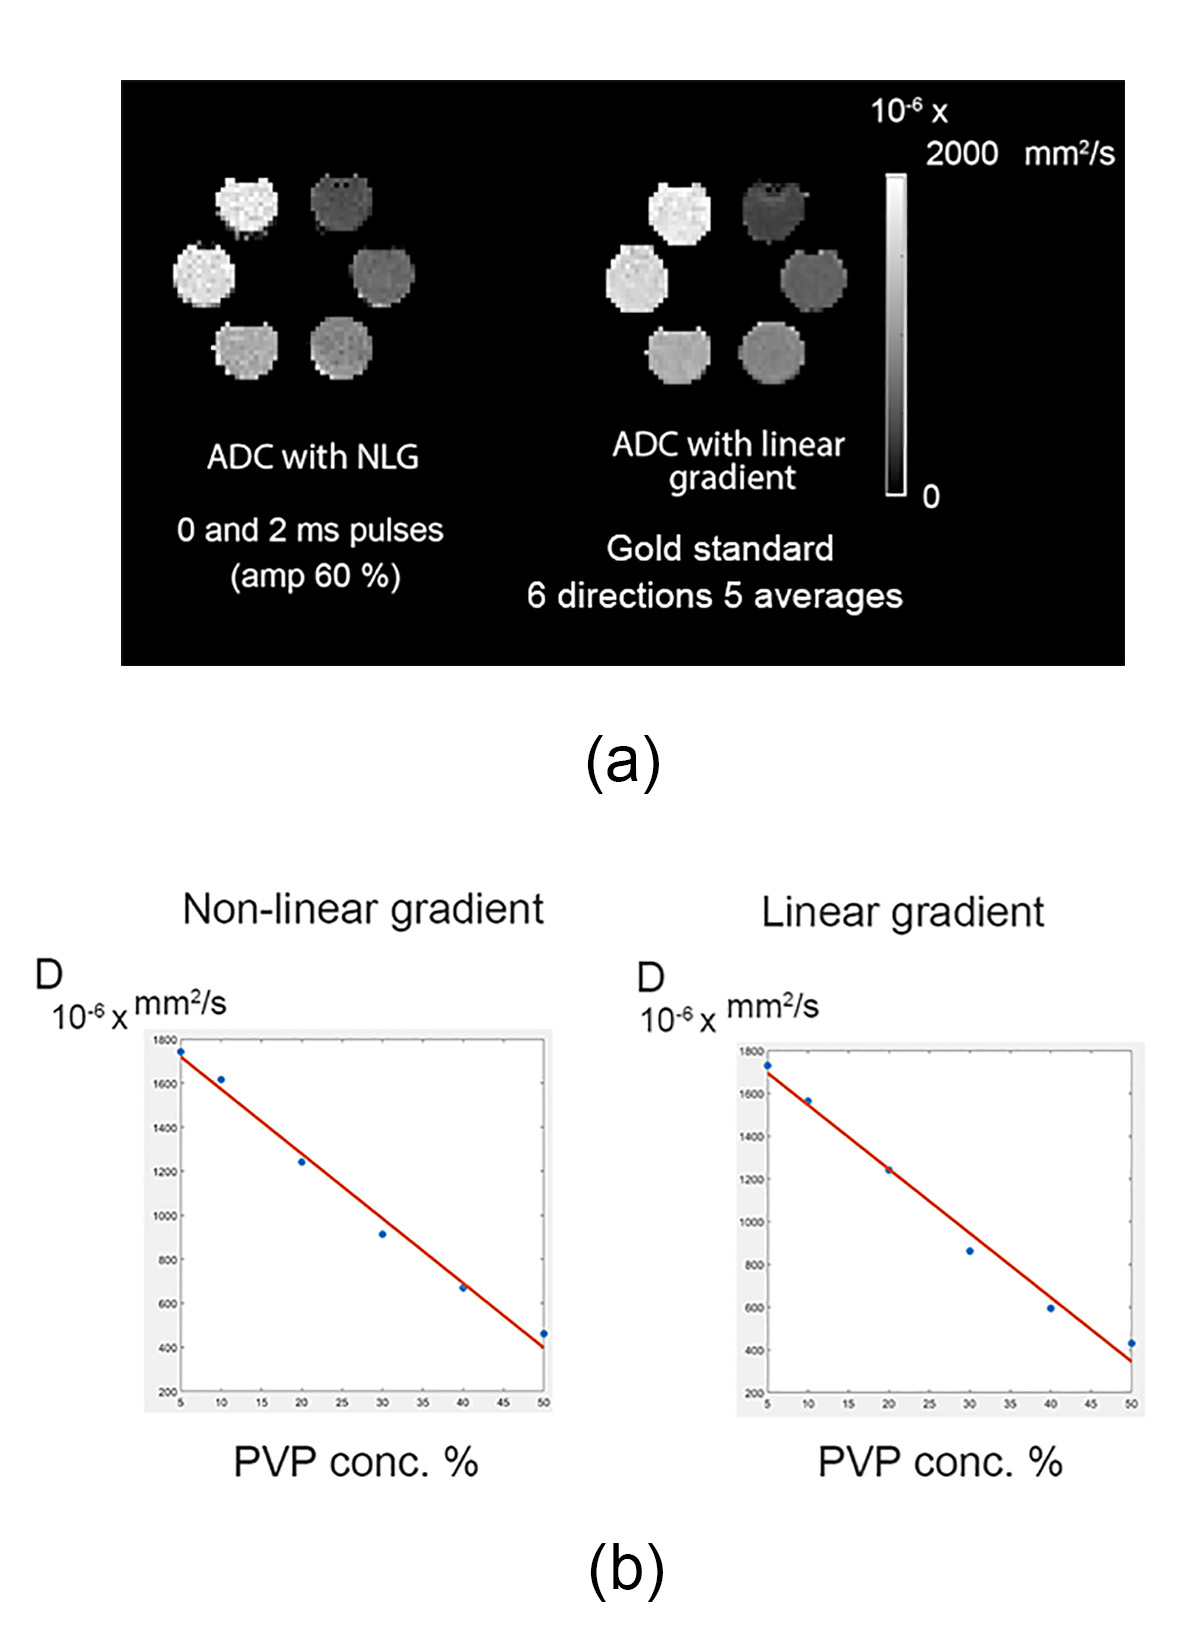
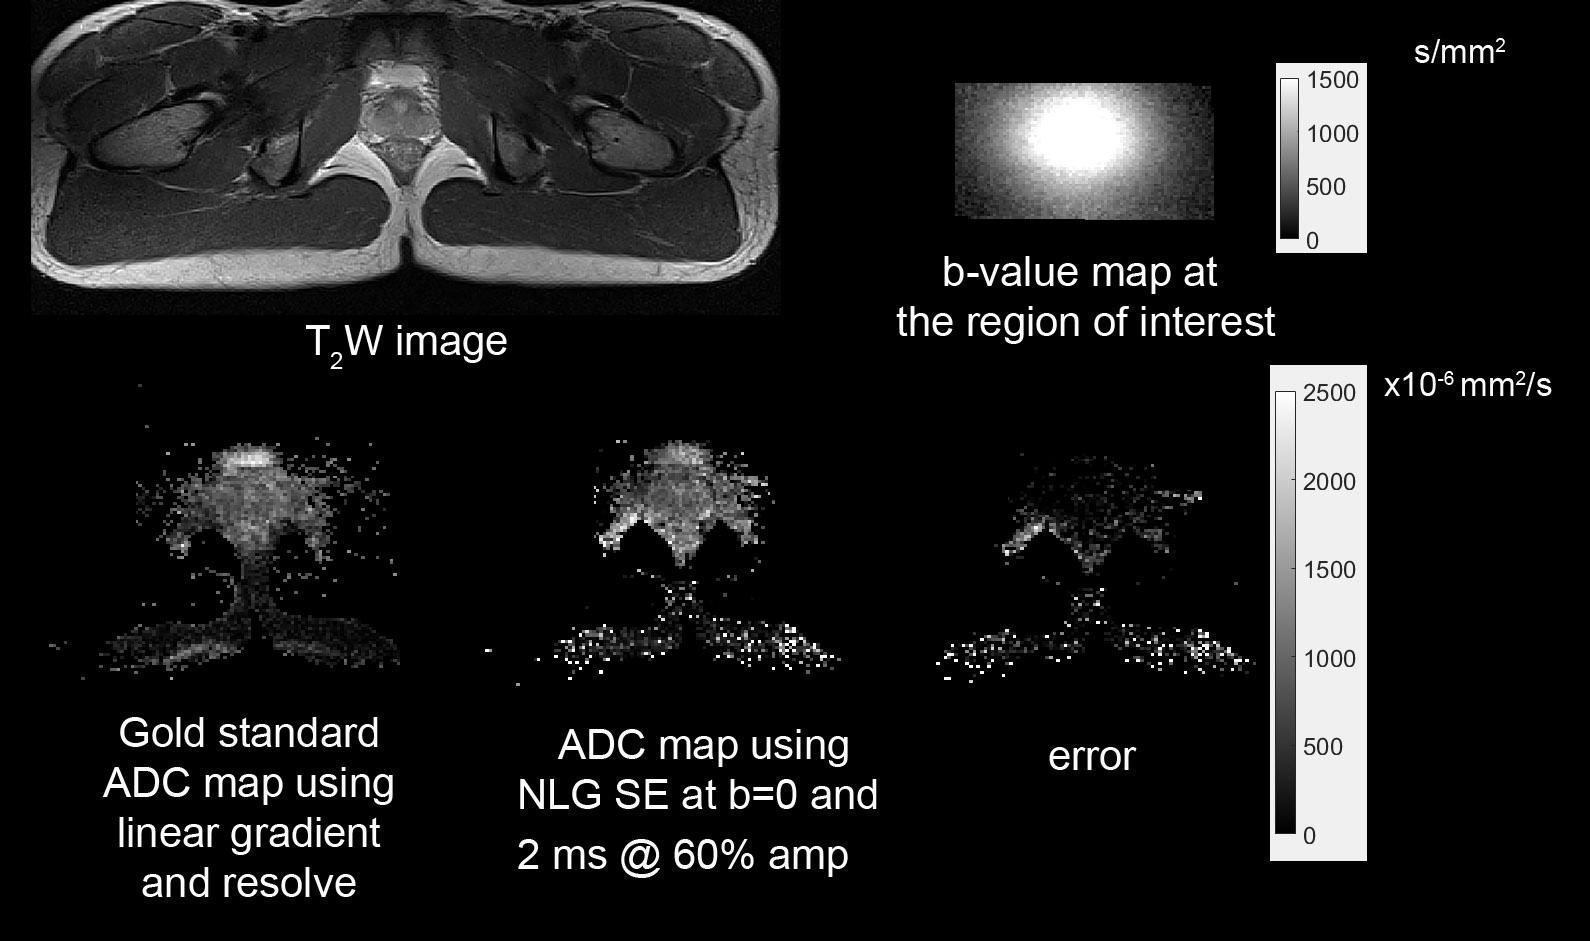
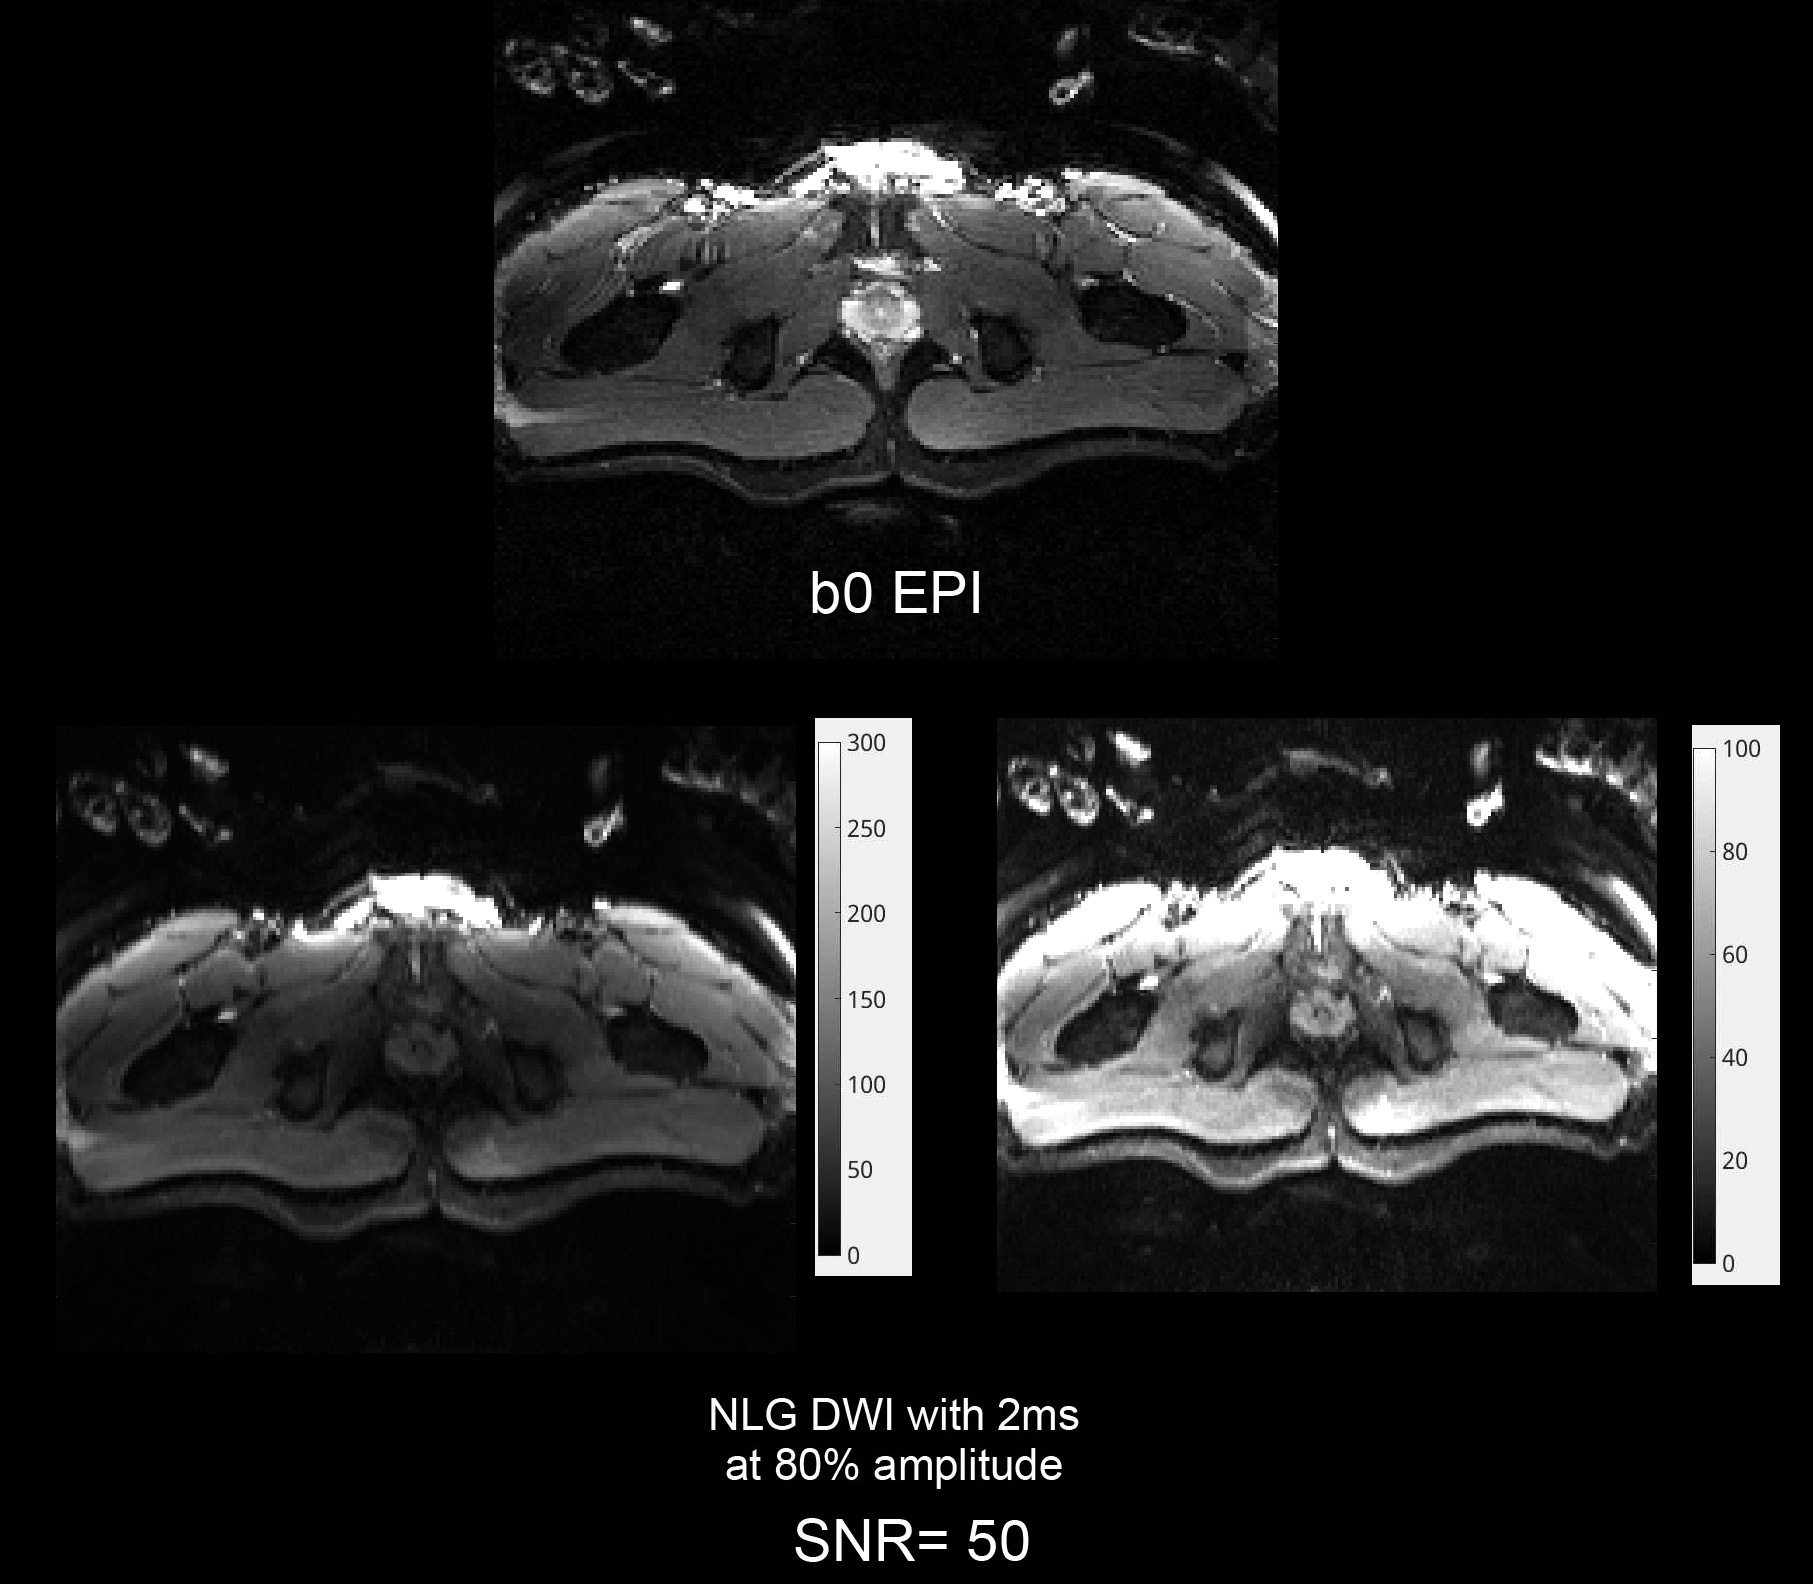
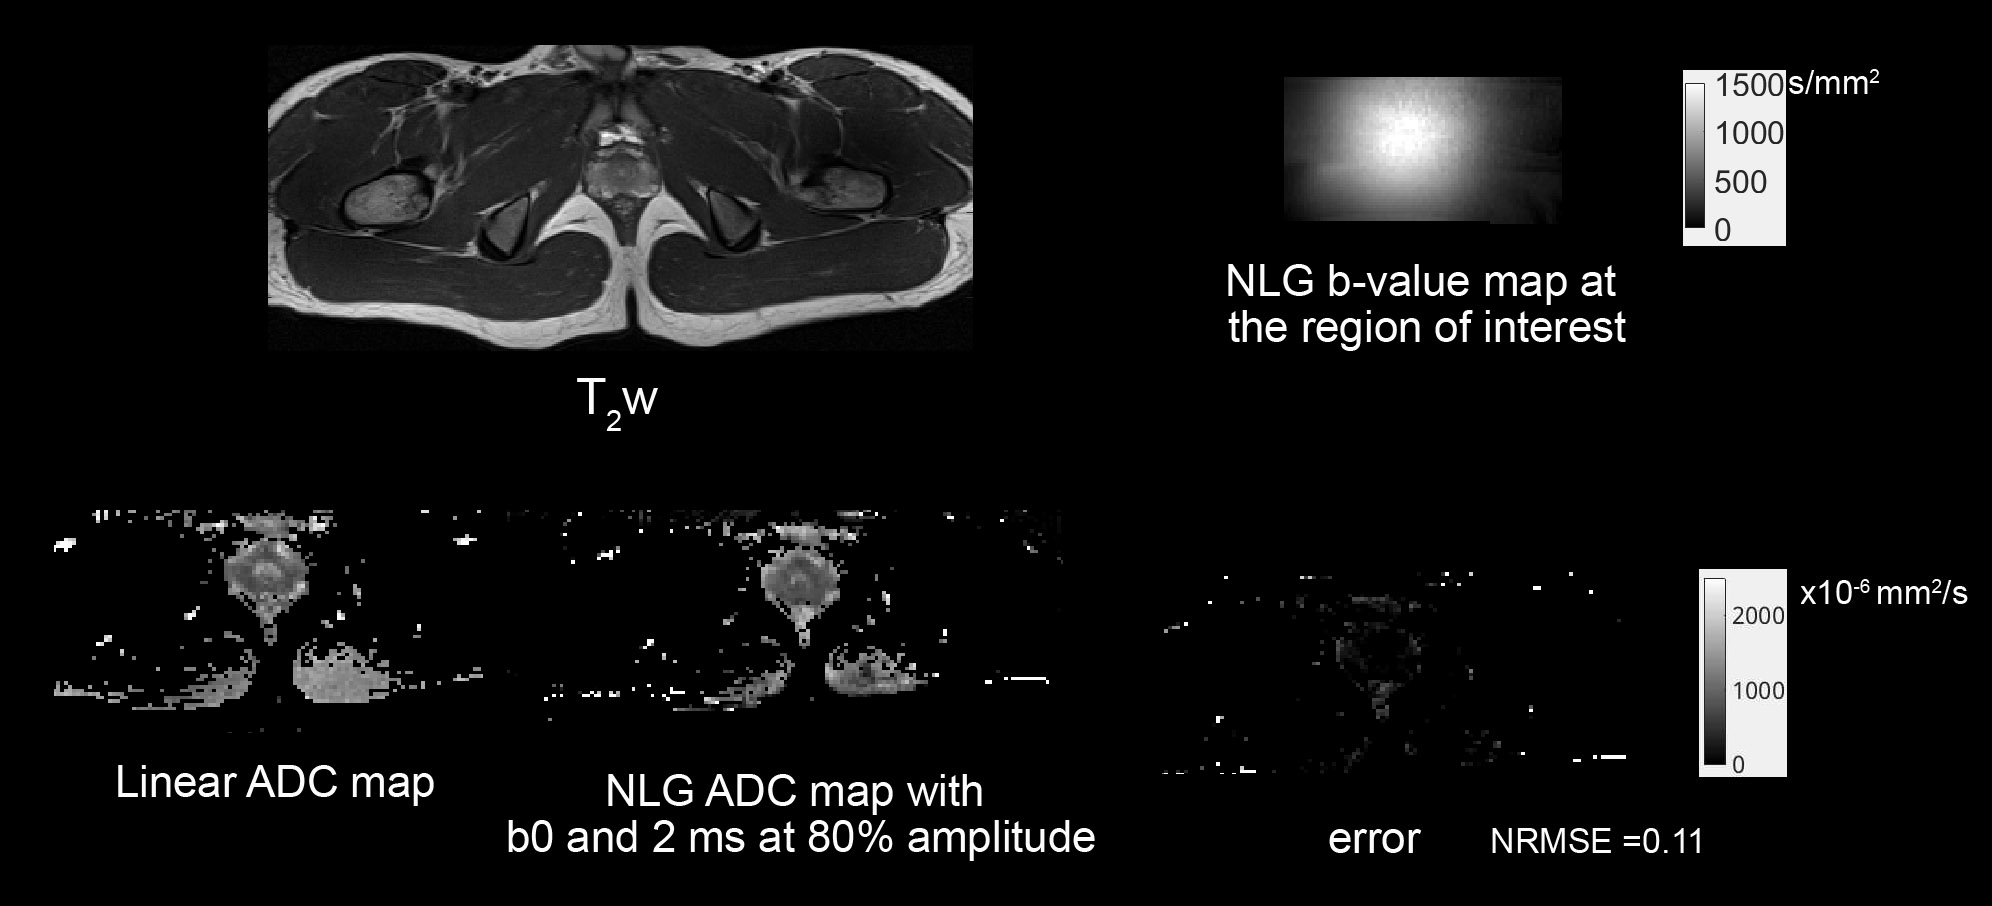
While preliminary results in the phantom were previously presented12, Figure 2 shows improved phantom results with an excellent inverse-linear relationship between the diffusivity versus the PVP concentrations. Figure 3 shows the ADC map of the linear gold standard versus that produced using the NLG SE images. Note the noisy images due to using the body coil for receive. In Figure 4, we present our first EPI-NLG results in the prostate, highlighting the low EPI ghosting and high SNR (50) even in case of high diffusion weighting. Figure 5 shows the ADC mapping results of the SE-EPI prostate using the NLG. The NRMSE error between the gold standard RESOLVE ADC and NLG ADC computed using only two images was 0.11.Discussion and Conclusion
This abstract demonstrates the feasibility of using the nonlinear gradient coil insert for prostate imaging. This can produce higher SNR images due to the ability to use shorter echo times with higher localized gradient amplitude than the constant linear gradient. We first validated the accuracy of the ADC values using a PVP phantom experiment. Then, we used SE and SE-EPI for the first time with the NLG to test the ability of the NLG to produce comparable ADC results to a gold standard nine-shell RESOLVE ADC. Future work will test the NLG with super-resolution prostate ADC mapping.Acknowledgements
NIH grant R01CA264851 funded this work.
The authors thank Dr. Andrew Dewdney (Siemens Healthineers, Erlangen,
Germany) for his expertise and assistance throughout this study.
References
- Cronin, K. A. et al. Annual Report to the Nation on the Status of Cancer, part I: National cancer statistics. Cancer, doi:10.1002/cncr.31551 (2018).
- Brawley, O. W. Trends in prostate cancer in the United States. J Natl Cancer Inst Monogr 2012, 152-156, doi:10.1093/jncimonographs/lgs035 (2012).
- Kelly, S. P. et al. Trends in the Incidence of Fatal Prostate Cancer in the United States by Race. Eur Urol 71, 195-201, doi:10.1016/j.eururo.2016.05.011 (2017).
- Roobol, M. J. & Schroder, F. H. The rate of overdiagnosis inextricably linked to prostate-specific antigen-based screening for prostate cancer can be quantified in several ways, but what is the practicable message? Eur Urol 65, 1056-1057, doi:10.1016/j.eururo.2014.01.016 (2014).
- Loeb, S. et al. Overdiagnosis and overtreatment of prostate cancer. Eur Urol 65, 1046-1055, doi:10.1016/j.eururo.2013.12.062 (2014).
- Fujita, K., Landis, P., McNeil, B. K. & Pavlovich, C. P. Serial prostate biopsies are associated with an increased risk of erectile dysfunction in men with prostate cancer on active surveillance. J Urol 182, 2664-2669, doi:10.1016/j.juro.2009.08.044 (2009).
- Klein, T. et al. The impact of prostate biopsy and periprostatic nerve block on erectile and voiding function: a prospective study. J Urol 184, 1447-1452, doi:10.1016/j.juro.2010.06.021 (2010).
- Zisman, A. et al. The impact of prostate biopsy on patient well-being: a prospective study of voiding impairment. J Urol 166, 2242-2246 (2001).
- Harvey, H. & deSouza, N. M. The role of imaging in the diagnosis of primary prostate cancer. J Clin Urol 9, 11-17, doi:10.1177/2051415816656120 (2016).
- Giles, S. L. et al. Apparent diffusion coefficient as a predictive biomarker of prostate cancer progression: value of fast and slow diffusion components. AJR Am J Roentgenol 196, 586-591, doi:10.2214/AJR.10.5016 (2011).
- Carr, H. Y. & Purcell, E. M. Effects of Diffusion on Free Precession in Nuclear Magnetic Resonance Experiments. Physical Review 94, 630-638, doi:10.1103/PhysRev.94.630 (1954).
- Elsaid, N. M. H. et al. Diffusion Weighted Imaging using a Prostate Nonlinear Gradient Coil. ISMRM 2023 annual meeting.
Figures