3502
Accelerated Glioma characterization with VERDICT MRI: a comparison between deep learning and non-linear least squares fitting1Centre for Medical Image Computing, University College London, London, United Kingdom, 2Computer Science, University College London, London, United Kingdom, 3Cardiff University Brain Research Imaging Centre (CUBRIC), School of Psychology, Cardiff University, Cardiff, United Kingdom, 4School of Computer Science and Informatics, Cardiff University, Cardiff, United Kingdom, 5Department of Neurosurgery and Gamma Knife Radiosurgery, IRCCS Ospedale San Raffaele, Milano, Italy, 6Vita-Salute San Raffaele University, Milano, Italy, 7Pathology Unit, IRCCS Ospedale San Raffaele, Milano, Italy, 8Neuroradiology Unit and CERMAC, IRCCS Ospedale San Raffaele, Milano, Italy
Synopsis
Keywords: Microstructure, Microstructure, Model fitting, Brain Tumours
Motivation: Complex multi-compartment models of diffusion MRI, as the recent adaptation of VERDICT-MRI for brain tumours, can provide important microstructural information, but traditional fitting is time-consuming and may not be accurate.
Goal(s): To explore the feasibility of deep-learning-based fitting of VERDICT for brain tumours.
Approach: We fit the VERDICT model to data from 15 glioma patients using both traditional and deep-learning approaches. We compared the resulting parameters between the two methods and with histology.
Results: VERDICT estimates from deep-learning and traditional fitting showed a good correlation and reflected histology features. The deep-learning fitting was much faster once the model was trained.
Impact: We have successfully used deep learning to fit the complex VERDICT model for brain tumour microstructure. As deep-learning fitting is much faster and potentially more precise than traditional methods, this could facilitate the clinical application of VERDICT for brain tumours.
Introduction
Multi-compartment models of diffusion MRI (dMRI) can provide important microstructure information in many applications1. However, most of them are not compatible with clinical routine due to the long time needed to both acquire the complex protocols and to process the images. The most time-consuming part of image processing is model fitting, traditionally performed by non-linear least squares (NLLS), which is computationally intensive, sensitive to outliers, has poor precision and requires an initial guess for model parameters, which often biases the estimates. Deep Learning (DL) techniques have been used for dMRI fitting and demonstrated dramatically reduced computation and improved precision2-5; furthermore, they do not need any initial guess. However, the impact of training procedures and outputs accuracy must be carefully investigated6-7. We have recently tailored VERDICT-MRI8, an imaging and modelling framework for cancer, to brain tumours9, which present higher complexity than body tumours mainly due to anisotropic peri-tumoural areas. Preliminary analysis showed that VERDICT can differentiate tumour types and subregions. However due to its complexity and degeneracy the NLLS fitting is long and can be unstable. This study explores the feasibility of DL-based fitting of VERDICT in brain tumours and compares results with those from NLLS fitting and histology.Methods
Data were collected as part of a previous study9; 15 patients with gliomas were selected here. dMRI with an isotropic resolution of 2 mm was acquired using the protocol in Table 1. We performed denoising and removal of Gibbs artifacts using MRtrix310-11 and motion and distortion correction using MD-dMRI12.VERDICT brain tumour model: The signal is modelled as:
E = fFW ⋅ e-b⋅DFW + fIC ⋅ Sphere(R,DIC) + fEES ⋅ Zeppelin(D//,D⊥,θ,φ) + fVASC ⋅ Astrosticks(DVASC)
including compartments for free water (diffusivity DFW fixed to 3 10-3 mm2/s, fraction fFW), intracellular (Sphere of radius R with isotropic restriction and intrinsic diffusivity DIC, fraction fIC), extracellular (Zeppelin, axially-symmetric tensor with axial diffusivity D//, radial diffusivity D⊥, direction identified by θ and φ, fraction fEES) and vascular tissue (Astrosticks, a set of randomly oriented zero-radius cylinders, pseudo-diffusivity DVASC fixed to 4 10-2 mm2/s, fraction fVASC), with fFW+fIC+fEES+fVASC=1.
Model fitting: We fit NODDI13 to the last two shells in Table 1 and used its isotropic fraction to fix fFW for NLLS fitting of VERDICT and to eliminate the free-water signal before DL fitting, so only the parameters of the remaining 3 compartments were estimated.
The DL fitting was based on simulated signals from 1,000,000 combinations of model parameters uniformly distributed in physically meaningful ranges, with Gaussian noise added to get SNR=42 as in our scans. We trained a Multi-Layer Perceptron regressor in scikit-learn with 3 hidden layers of size 150, ReLu activation function, Adam optimizer and initial learning rate 0.001; the loss function was the mean square error between predicted and ground-truth parameters14. The trained model was applied voxel-wise to each patient’s data to obtain whole-brain maps of VERDICT parameters.
Results
NLLS fitting took about 4 hours/brain using 8 parallel processes (Intel Haswell CPUs) and 12 GB virtual memory; DL fitting required about 2 hours for training and 10 s/brain for prediction.Figure 1 shows representative VERDICT maps from NLLS and DL fitting. The two methods show visually similar results; there are some differences in R, D// and D⊥, but mostly in areas where the corresponding fractions fIC and fEES are small. Maps from DL fitting were smoother than those from NLLS, with a significantly higher ROI variance for all parameters except fVASC (Wilcoxon signed-rank test).
We found a good correlation between the ROI median results from NLLS and DL fitting (table 2), with r > 0.75 for all parameters except R and DIC in periphery areas (where they are associated with very small intracellular signals).
Figures 2 and 3 show maps of the VERDICT fractions compared to histology in two patients who underwent stereotactic biopsy. Again, the two methods provided very similar signal fractions and DL maps were smoother.
Discussion and conclusions
We have shown the feasibility of DL fitting of a complex VERDICT model for brain tumours. Results showed high correlation with NLLS estimates with very few and not clinically-relevant exceptions. DL fitting is much faster than NLLS fitting once the model is trained, which has obvious practical advantages for clinical adoption, and maps were smoother maintaining lesion conspicuity. The main limitation of this study is the lack of a quantitative ground truth; the NLLS results can’t be considered fully reliable for such a complex model. However, qualitative agreement with histology is encouraging to move forward with larger clinical studies, including point-to-point correlation with histology.Acknowledgements
This research was funded by Engineering and Physical Sciences Research Council grant nr. EP/N021967/1 to E.P. and by UK Research and Innovation, Future Leaders Fellowship (MR/T020296/1) to M.PReferences
1. Alexander, D.C.; Dyrby, T.B.; Nilsson, M.; Zhang, H. Imaging brain microstructure with diffusion MRI: practicality and applications. NMR Biomed 2019, 32, e3841.
2. Grussu, F.; Battiston, M.; Palombo, M.; Schneider, T.; Gandini Wheeler-Kingshott, C.A.M.; Alexander, D.C. Deep learning model fitting for diffusion-relaxometry: a comparative study. bioRxiv 2020, 10.1101/2020.10.20.347625, 2020.2010.2020.347625.
3. Tian, Q.; Bilgic, B.; Fan, Q.; Liao, C.; Ngamsombat, C.; Hu, Y.; Witzel, T.; Setsompop, K.; Polimeni, J.R.; Huang, S.Y. DeepDTI: High-fidelity six-direction diffusion tensor imaging using deep learning. NeuroImage 2020, 219, 117017.
4. Barbieri, S.; Gurney-Champion, O.J.; Klaassen, R.; Thoeny, H.C. Deep learning how to fit an intravoxel incoherent motion model to diffusion-weighted MRI. Magnetic Resonance in Medicine 2020, 83, 312-321.
5. de Almeida Martins, J.P.; Nilsson, M.; Lampinen, B.; Palombo, M.; While, P.T.; Westin, C.-F.; Szczepankiewicz, F. Neural networks for parameter estimation in microstructural MRI: Application to a diffusion-relaxation model of white matter. NeuroImage 2021, 244, 118601.
6. Gyori NG, Palombo M, Clark CA, Zhang H, Alexander DC. Training data distribution significantly impacts the estimation of tissue microstructure with machine learning. Magn Reson Med. 2022 Feb;87(2):932-947.
7. Epstein SC, Bray TJ, Hall-Craggs M, Zhang H. Choice of training label matters: how to best use deep learning for quantitative MRI parameter estimation. arXiv preprint 2022; arXiv:2205.05587
8. Panagiotaki, E.; Walker-Samuel, S.; Siow, B.; Johnson, S.P.; Rajkumar, V.; Pedley, R.B.; Lythgoe, M.F.; Alexander, D.C. Noninvasive quantification of solid tumor microstructure using VERDICT MRI. Cancer Res 2014, 74, 1902-1912, doi:10.1158/0008-5472.Can-13-2511.
9. Figini M, Castellano A, Bailo M, Callea M, Cadioli M, Bouyagoub S, Palombo M, Pieri V, Mortini P, Falini A, Alexander DC, Cercignani M, Panagiotaki E. Comprehensive Brain Tumour Characterisation with VERDICT-MRI: Evaluation of Cellular and Vascular Measures Validated by Histology. Cancers (Basel). 2023 Apr 27;15(9):2490.
10. Veraart, J.; Novikov, D.S.; Christiaens, D.; Ades-Aron, B.; Sijbers, J.; Fieremans, E. Denoising of diffusion MRI using random matrix theory. Neuroimage 2016, 142, 394-406.
11. Kellner, E.; Dhital, B.; Kiselev, V.G.; Reisert, M. Gibbs-ringing artifact removal based on local subvoxel-shifts. Magn Reson Med 2016, 76, 1574-1581.
12. Nilsson, M.; Szczepankiewicz, F.; Lampinen, B.; Ahlgren, A.; de Almeida Martins, J.P.; Lasic, S.; Westin, C.-F.; Topgaard, D. An open-source framework for analysis of multidimensional diffusion MRI data implemented in MATLAB. In Proceedings of Joint Annual Meeting ISMRM-ESMRMB, Paris, France; p. 5355.
13. Zhang, H.; Schneider, T.; Wheeler-Kingshott, C.A.; Alexander, D.C. NODDI: practical in vivo neurite orientation dispersion and density imaging of the human brain. Neuroimage 2012, 61, 1000-1016, doi:10.1016/j.neuroimage.2012.03.072.
14. Sen S, Valindria V, Slator PJ, Pye H, Grey A, Freeman A, Moore C, Whitaker H, Punwani S, Singh S, Panagiotaki E. Differentiating False Positive Lesions from Clinically Significant Cancer and Normal Prostate Tissue Using VERDICT MRI and Other Diffusion Models. Diagnostics (Basel). 2022 Jul 5;12(7):1631
Figures
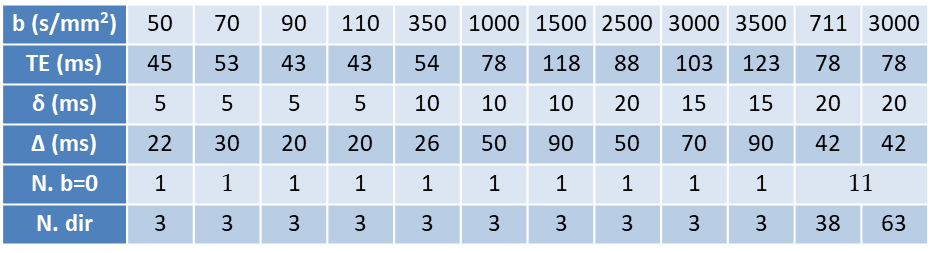
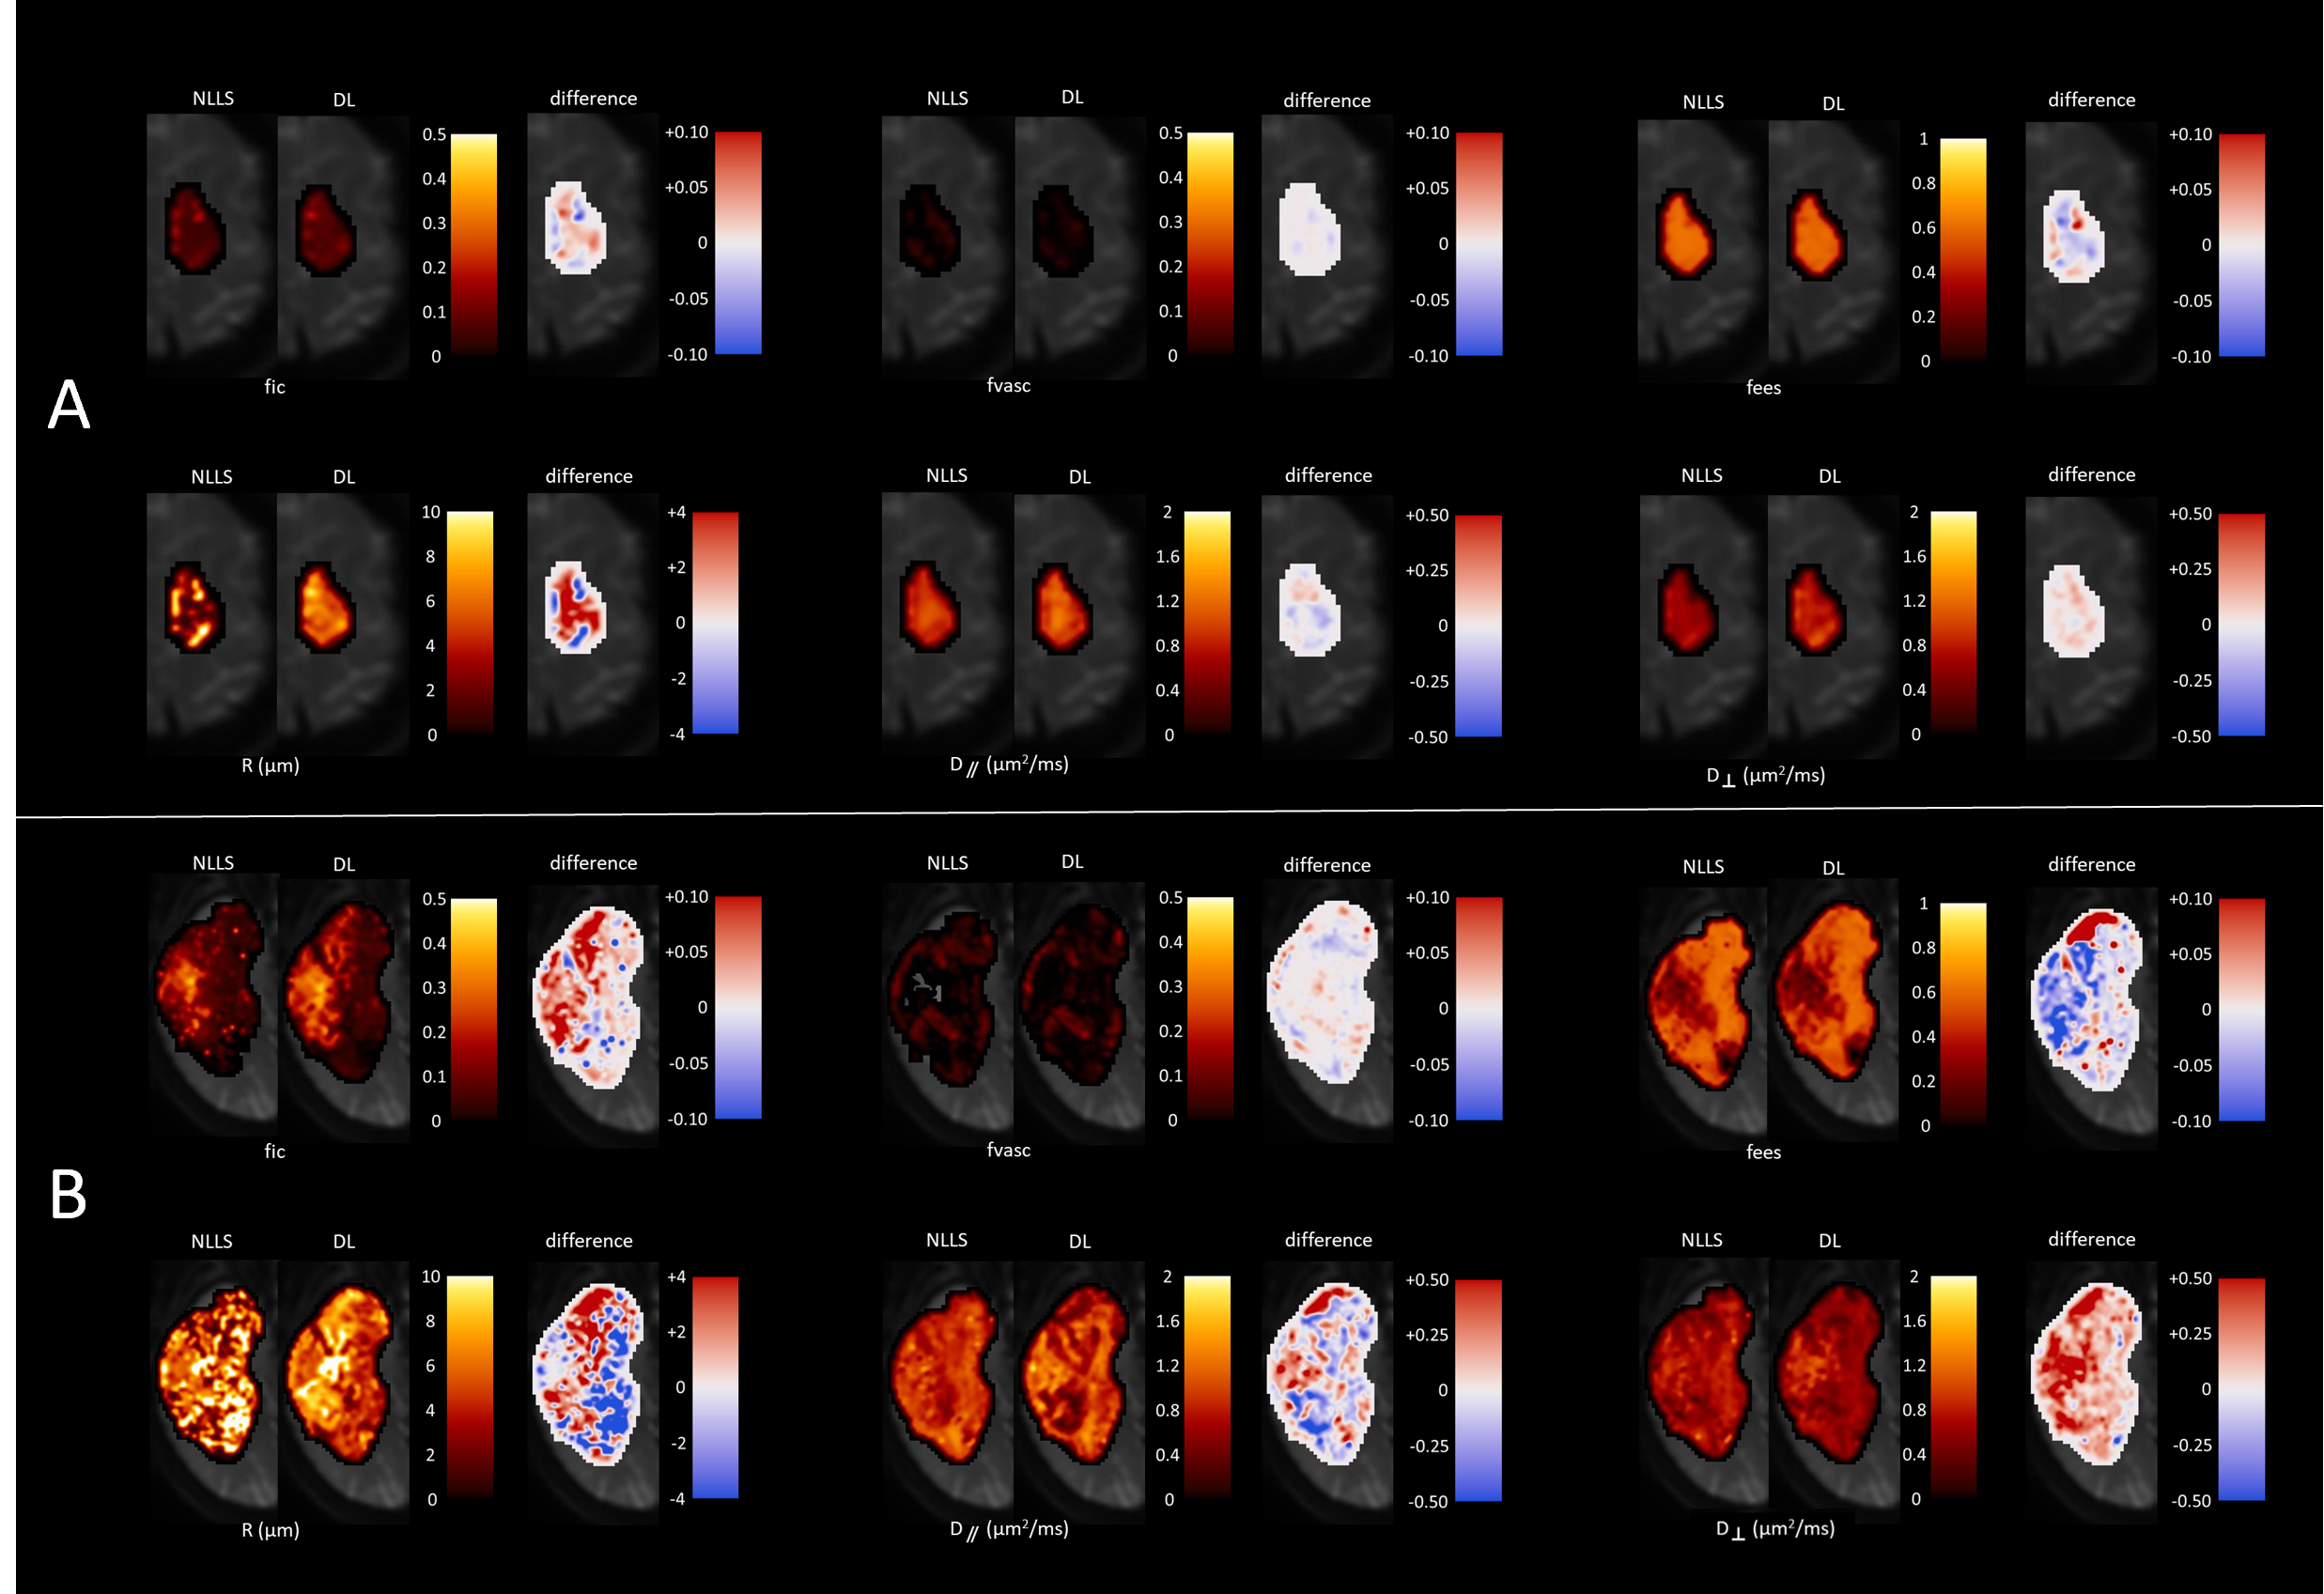
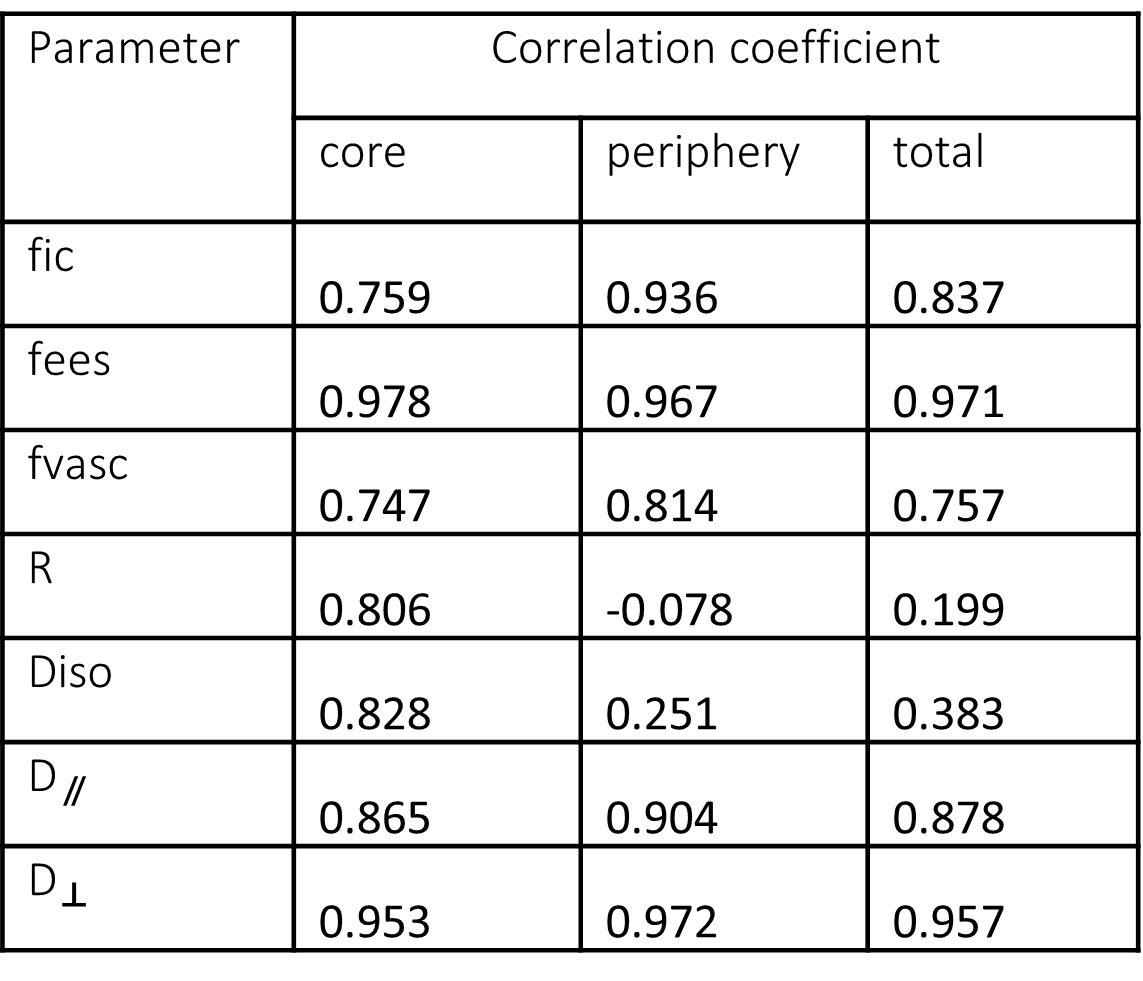
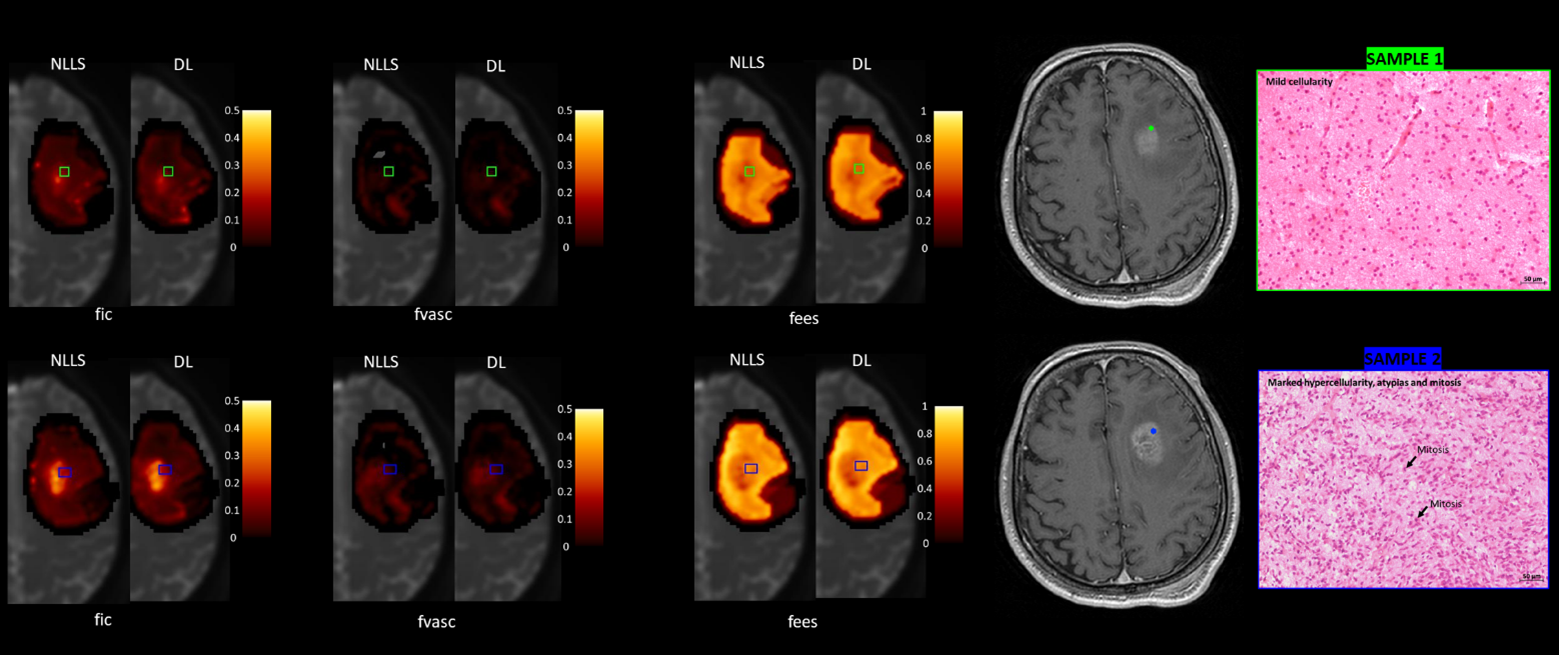
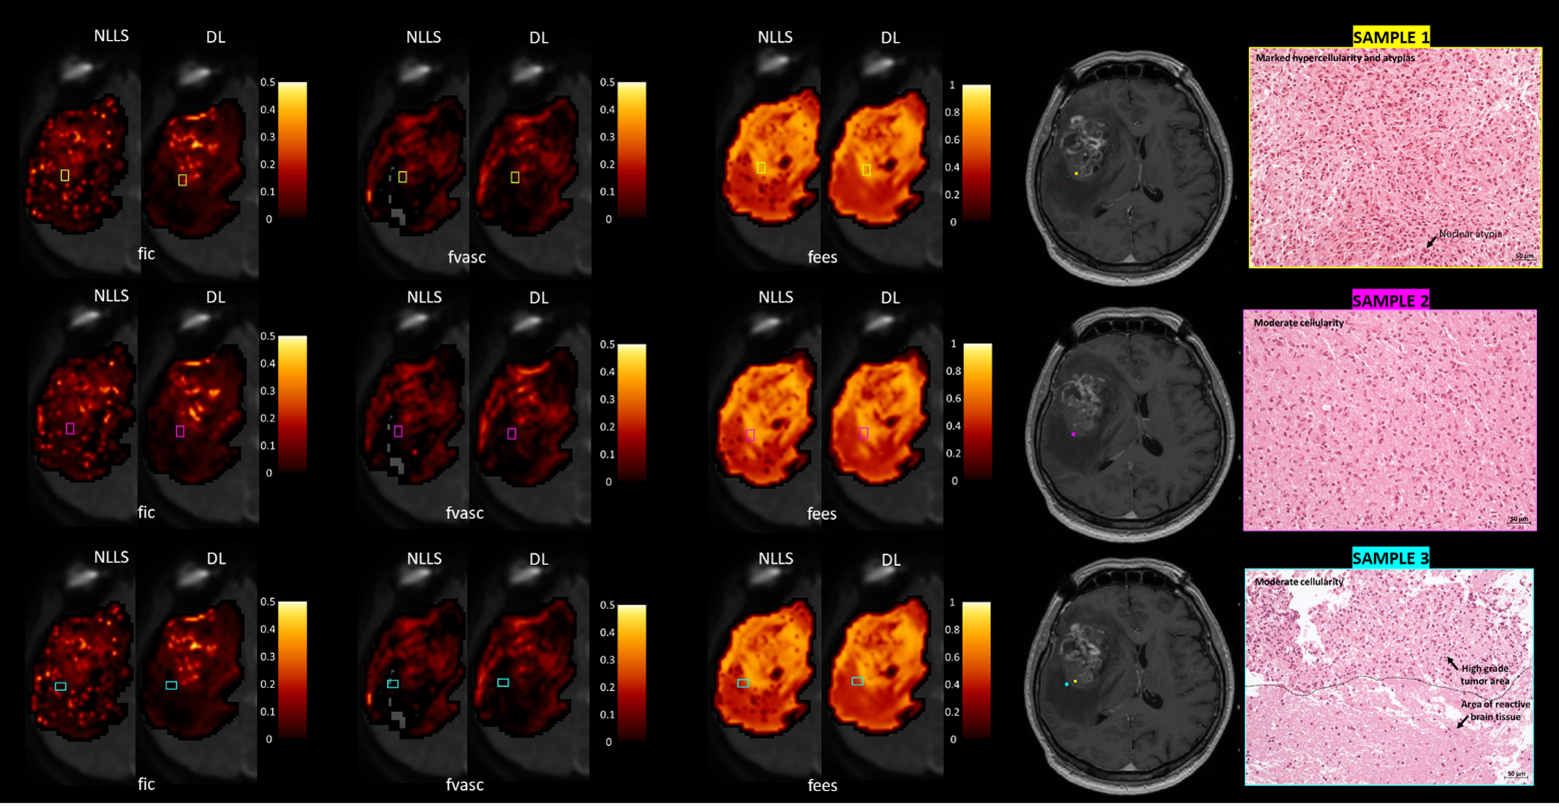
Figure 3: comparison with histology in a WHO grade 4 glioblastoma. VERDICT maps are shown for three slides corresponding to three biopsy locations as in figure 2. Both methods show higher fIC in the first location (yellow) than in the other two (purple and cyan), reflecting the higher cellularity shown by histology. Notice that maps from DL fitting are smoother than those from NLLS, especially for fIC.