3501
Test-retest Repeatability of Echo Planar Imaging Diffusion-weighted MRI on a 1.5T MR-linac for Head and Neck Cancers1Radiation Oncology, UT MD Anderson Cancer Center, Houston, TX, United States, 2Dartmouth Hitchcock Medical Center, Lebanon, NH, United States, 3Elekta AB, Philadelphia, PA, United States
Synopsis
Keywords: Simulation/Validation, Diffusion/other diffusion imaging techniques, MR-linac, image-guided radiation therapy, repeatability
Motivation: In order to use DWI on MR-linacs to adapt head and neck cancer radiotherapy treatment plans based on response, the variability in ADC must be characterized.
Goal(s): To quantify the repeatability of ADC on a 1.5T MR-linac in a large cohort (37 head and neck cancer patients).
Approach: Patients were imaged with echo planar imaging-DWI twice before the start of radiotherapy. Mean ADC values of primary tumors and lymph nodes were compared across time points using repeatability metrics.
Results: Repeatability coefficients were 53.0%/35.5% for tumors/nodes, indicating that this DWI sequence is insufficient for detecting clinically significant ADC changes and must be further optimized.
Impact: Our DWI test-retest results demonstrate that the current widely implemented EPI-DWI sequence for head and neck cancers on 1.5T MR-linacs has substantial ADC variability across time points and needs to be further refined.
Introduction
Changes in diffusion-weighted imaging (DWI) apparent diffusion coefficient (ADC) values of head and neck cancers (HNC) during radiation therapy (RT) can predict response to RT1, forming the basis for biological image-guided adaptive RT where changes in quantitative imaging biomarkers inform treatment plan adaptation2. MRI-linear accelerators (MR-linacs) are well-suited for this purpose, but the variability in ADC must be characterized to understand when ADC changes are biologically meaningful. We aim to quantify ADC repeatability metrics in a large cohort of HNC patients on a 1.5T MR-linac.Methods
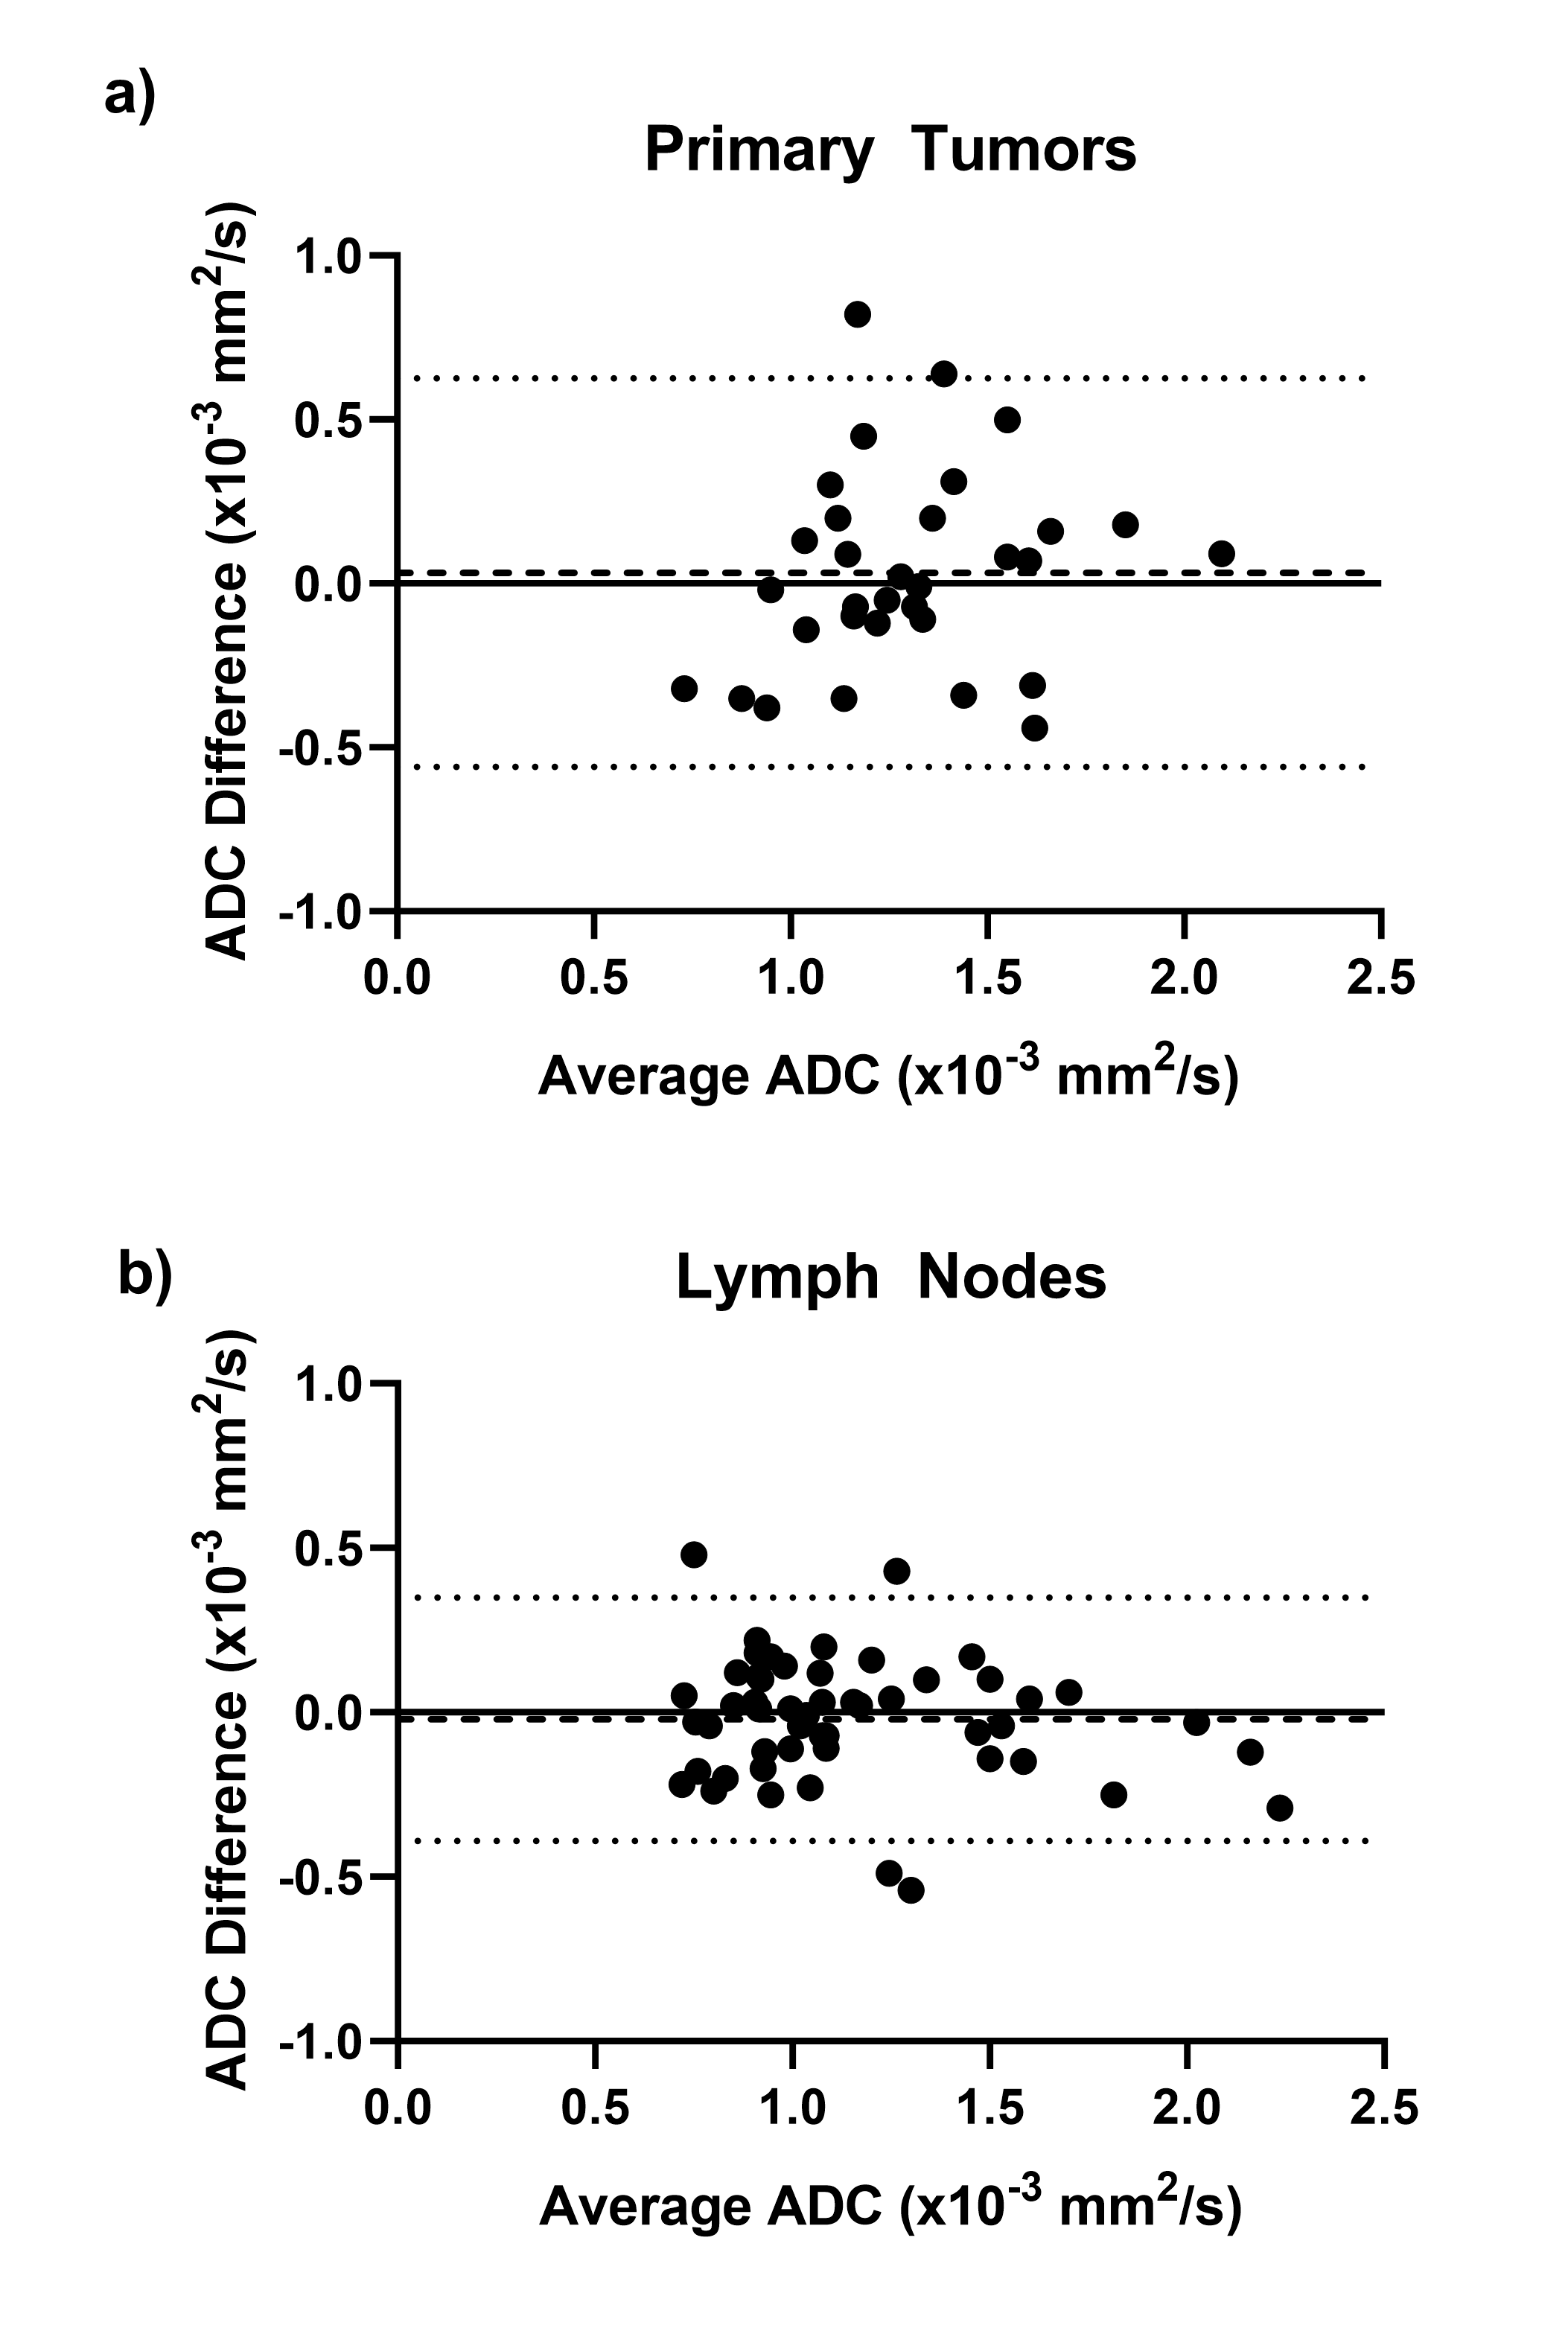
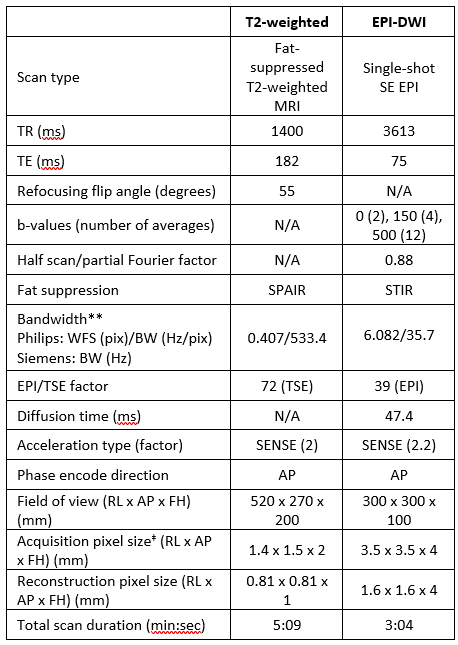
This retrospective study included HNC patients that fit the following criteria: histologically confirmed HNC, consented to MOMENTUM observational trial3, and imaged with echo planar imaging (EPI)-DWI on the 1.5T MR-linac (Elekta Unity) at two time points between the pre-treatment MR simulation and first day of treatment (inclusive). Patients were imaged in RT immobilization masks with a T2-weighted sequence and EPI-DWI with b-values of 0, 150, and 500 s/mm2. (Acquisition parameters are in Table 1.) ADC maps were reconstructed by the scanner using only b=150 and 500 s/mm2 images to minimize perfusion effects4. Primary tumors (PTs) and pathological lymph nodes (LNs) were segmented in VelocityAI (v3.0.1) on the DWI b0 images—which were rigidly registered to the T2w images as guidance for better visualization—then were rigidly copied to the ADC maps. Mean ADC values and volumes of each structure were extracted in VelocityAI. Wilcoxon signed rank tests (α=0.05) were performed in GraphPad Prism (v10.0.3) to determine if there were significant differences in volume and mean ADC between time points 1 and 2 (TP1 and TP2) for PTs and LNs. The following repeatability metrics were calculated according to consensus guideline procedures5: within-subject deviation (wSD), repeatability coefficient (RC), within-subject coefficient of variation (wCV), and percent RC (%RC). Bland-Altman analysis was performed in GraphPad Prism for PT and LN mean ADC values across TP1 and TP2 to determine the mean bias and 95% limits of agreement.Results
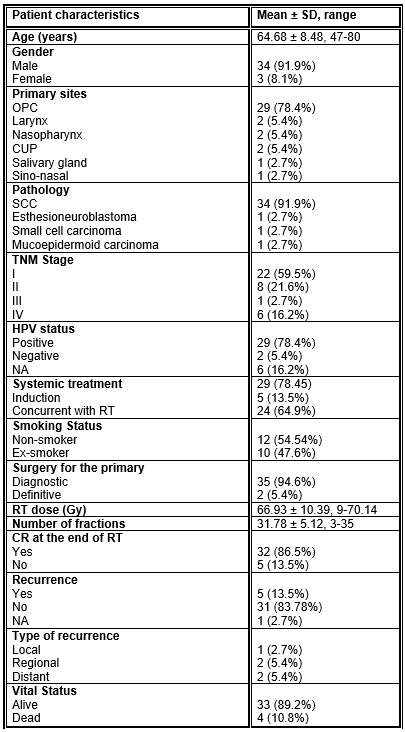
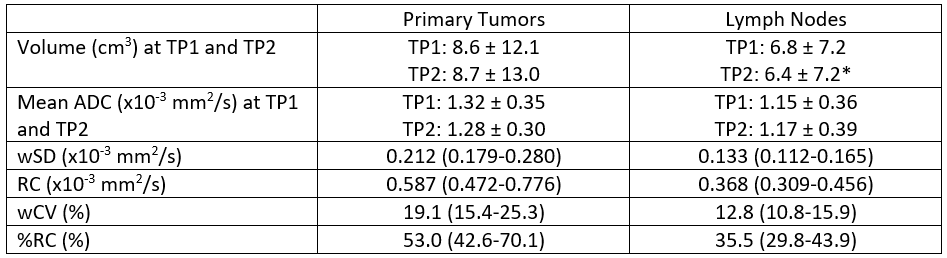
37 patients were included in the cohort with a total of 32 PTs and 52 LNs. Patient demographics are provided in Table 2. The median (range) number of days between imaging time points was 11 (1-15). Structure volumes, mean ADC values, and repeatability metrics for PTs and LNs are shown in Table 3. The differences in volume and mean ADC between time points were not statistically significant except for LN volume (p=0.0008). The wSD (95% confidence interval) values were 0.212 (0.179-0.280) x10-3 mm2/s and 0.133 (0.112-0.165) x10-3 mm2/s for PTs and LNs, respectively. The wCV (95% confidence interval) values were 19.1% (15.4%-25.3%) and 12.8% (10.8%-15.9%) for PTs and LNs, respectively. From Bland-Altman analysis, the mean bias (95% limits of agreement) between TP1 and TP2 was 0.033 (-0.560 – 0.626) x10-3 mm2/s for PTs and -0.020 (-0.390 – 0.350) x10-3 mm2/s for LNs.Discussion/Conclusions
While a small number of studies have quantified ADC repeatability for HNC in both conventional MRIs6 and MR-linacs7,8, cohorts have been small (≤11 patients). Our study has the largest cohort so far (32 PTs and 52 LNs) and comes closest to meeting the minimum recommended sample size of 35 lesions for both PTs and LNs9. Our wCV values are similar to the two previous reports using the same EPI sequence on a 1.5T MR-linac. Habrich et al. used b=150,500 ADC maps and reported RC values of 0.457 and 0.310 x10⁻³ mm2/s for PTs and LNs and %RC values of 31.3% and 23.5% for PTs and LNs7. However, all test-retest scans were acquired during the same session with no repositioning, so the variability is expected to be lower. For repeat scans at least a day apart, McDonald et al. reported PT and LN %RC values of 52.5% and 39.5% for b=150,500 ADC maps and 28.5% and 27.6% for b=0,500 ADC maps8; these values are very similar to our current results (53.0% (PT) and 35.5% (LN)) but demonstrate that ADC variability is higher when using b=150,500 ADC maps, which was done to minimize perfusion effects4. Furthermore, repeatability was consistently worse in PTs than in LNs in all studies, which is likely due to 1) the greater delineation uncertainty for PTs than LNs and 2) the more heterogeneous composition of PTs. Finally, previous studies have demonstrated that a threshold mid-RT ΔADC as low as 7% can discriminate between complete response and non-responders in HNC1. Our results indicate that the current MR-linac EPI-DWI sequence is not sufficiently sensitive to detect clinically significant ADC changes, so further sequence optimization is necessary to improve signal-to-noise ratio and ADC measurement robustness.Acknowledgements
This project is supported by an academic-industrial partnership R01 grant from the National Institutes of Health (NIH)/National Institute of Dental and Craniofacial Research (NIDCR) (R01DE028290), NIH/NCI (National Cancer Institute) Image-Guided Cancer Therapy T32 Program (T32CA261856), and an AAPM-ASTRO Post-doc/Resident Seed Grant.References
- Mohamed ASR, Abusaif A, He R, et al. Prospective validation of diffusion-weighted MRI as a biomarker of tumor response and oncologic outcomes in head and neck cancer: Results from an observational biomarker pre-qualification study. Radiother Oncol. 2023;183. doi:10.1016/j.radonc.2023.109641
- van Houdt PJ, Saeed H, Thorwarth D, et al. Integration of quantitative imaging biomarkers in clinical trials for MR-guided radiotherapy: Conceptual guidance for multicentre studies from the MR-Linac Consortium Imaging Biomarker Working Group. Eur J Cancer. 2021;153:64-71. doi:10.1016/j.ejca.2021.04.041
- van Otterloo SR de M, Christodouleas JP, Blezer ELA, et al. The MOMENTUM Study: An International Registry for the Evidence-Based Introduction of MR-Guided Adaptive Therapy. Front Oncol. 2020;10(September):1328. doi:10.3389/fonc.2020.01328
- Kooreman ES, van Houdt PJ, Keesman R, et al. ADC measurements on the Unity MR-linac – A recommendation on behalf of the Elekta Unity MR-linac consortium. Radiother Oncol. 2020;153:106-113. doi:10.1016/j.radonc.2020.09.046
- Shukla-Dave A, Obuchowski NA, Chenevert TL, et al. Quantitative imaging biomarkers alliance (QIBA) recommendations for improved precision of DWI and DCE-MRI derived biomarkers in multicenter oncology trials. J Magn Reson Imaging. 2019;49(7):e101-e121. doi:10.1002/jmri.26518
- Paudyal R, Konar AS, Obuchowski NA, et al. Repeatability of Quantitative Diffusion-Weighted Imaging Metrics in Phantoms, Head-and-Neck and Thyroid Cancers: Preliminary Findings. Tomography. 2019;5(1):15-25. doi:10.18383/j.tom.2018.00044
- Habrich J, Boeke S, Nachbar M, et al. Repeatability of diffusion-weighted magnetic resonance imaging in head and neck cancer at a 1.5 T MR-Linac. Radiother Oncol. 2022;174:141-148. doi:10.1016/j.radonc.2022.07.020
- McDonald BA, Salzillo T, Mulder S, et al. Prospective evaluation of in vivo and phantom repeatability and reproducibility of diffusion-weighted MRI sequences on 1.5 T MRI-linear accelerator (MR-Linac) and MR simulator devices for head and neck cancers. Radiother Oncol. 2023;185:109717. doi:10.1016/j.radonc.2023.109717
- Obuchowski NA, Bullen J. Quantitative imaging biomarkers: Effect of sample size and bias on confidence interval coverage. Stat Methods Med Res. 2018;27(10):3139-3150. doi:10.1177/0962280217693662
Figures