3500
Oscillating Gradient Spin Echo Shows Elevated Diffusion Dispersion Rate in Human Acute Ischemic Stroke1Biomedical Engineering, University of Alberta, Edmonton, AB, Canada, 2Radiology and Diagnostic Imaging, University of Alberta, Edmonton, AB, Canada, 3Neurology, University of Alberta, Edmonton, AB, Canada, 4Siemens Healthcare GmbH, Erlangen, Germany
Synopsis
Keywords: Microstructure, Diffusion/other diffusion imaging techniques
Motivation: The diffusion dispersion rate (DDR, slope of diffusion with frequency of oscillating-gradient-spin-echo - OGSE) has been probed in animal stroke models and healthy human brain, but has not been explored in human acute ischemic stroke.
Goal(s): Our goal is to map DDR in human stroke and explore its insight on the biophysical mechanisms related to reduced diffusion in stroke.
Approach: DDR maps using OGSE 25/40/50Hz were acquired in 12 acute ischemic stroke patients.
Results: DDR is significantly higher in ischemic lesions relative to contralateral white matter, and is highest in brain regions with presumably larger axons.
Impact: The application of oscillating-gradient-spin-echo diffusion MRI with different oscillating frequencies highlights greater diffusion time effects in acute stroke than healthy tissue, which agrees with earlier preclinical ischemia models, and implicates changes of short range microstructural disorder (e.g. beading).
Introduction
Relative to the typically used pulsed-gradient-spin-echo (PGSE) diffusion MRI with long diffusion times, oscillating-gradient-spin-echo (OGSE) has demonstrated changes of diffusion metrics as a function of oscillating frequency, f (inversely related to diffusion time), in healthy human white matter1-4. The rate of diffusivity change with oscillating frequency (also known as diffusion dispersion rate, DDR5,6) has been proposed and shown to be related to axon diameters in rat spinal cord5 and mean diffusivity (MD) has demonstrated a square root frequency (f0.5) dependence in healthy human brain2. This f0.5 behavior of MD change has been observed in animal models of acute ischemia7,8, but with a greater slope interpreted as changes of short range disorder such as neurite beading (see Figure 7 in reference9). OGSE studies of human stroke have shown less diffusion reduction in lesions than with PGSE, but DDR has not been evaluated10,11. The purpose here is to map and investigate the diffusion dispersion rate using PGSE (0 Hz) and OGSE 25, 40 and 50 Hz in human acute ischemic stroke for the first time.Methods
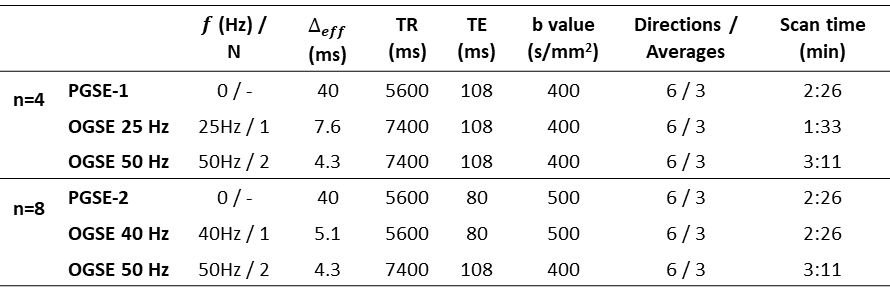
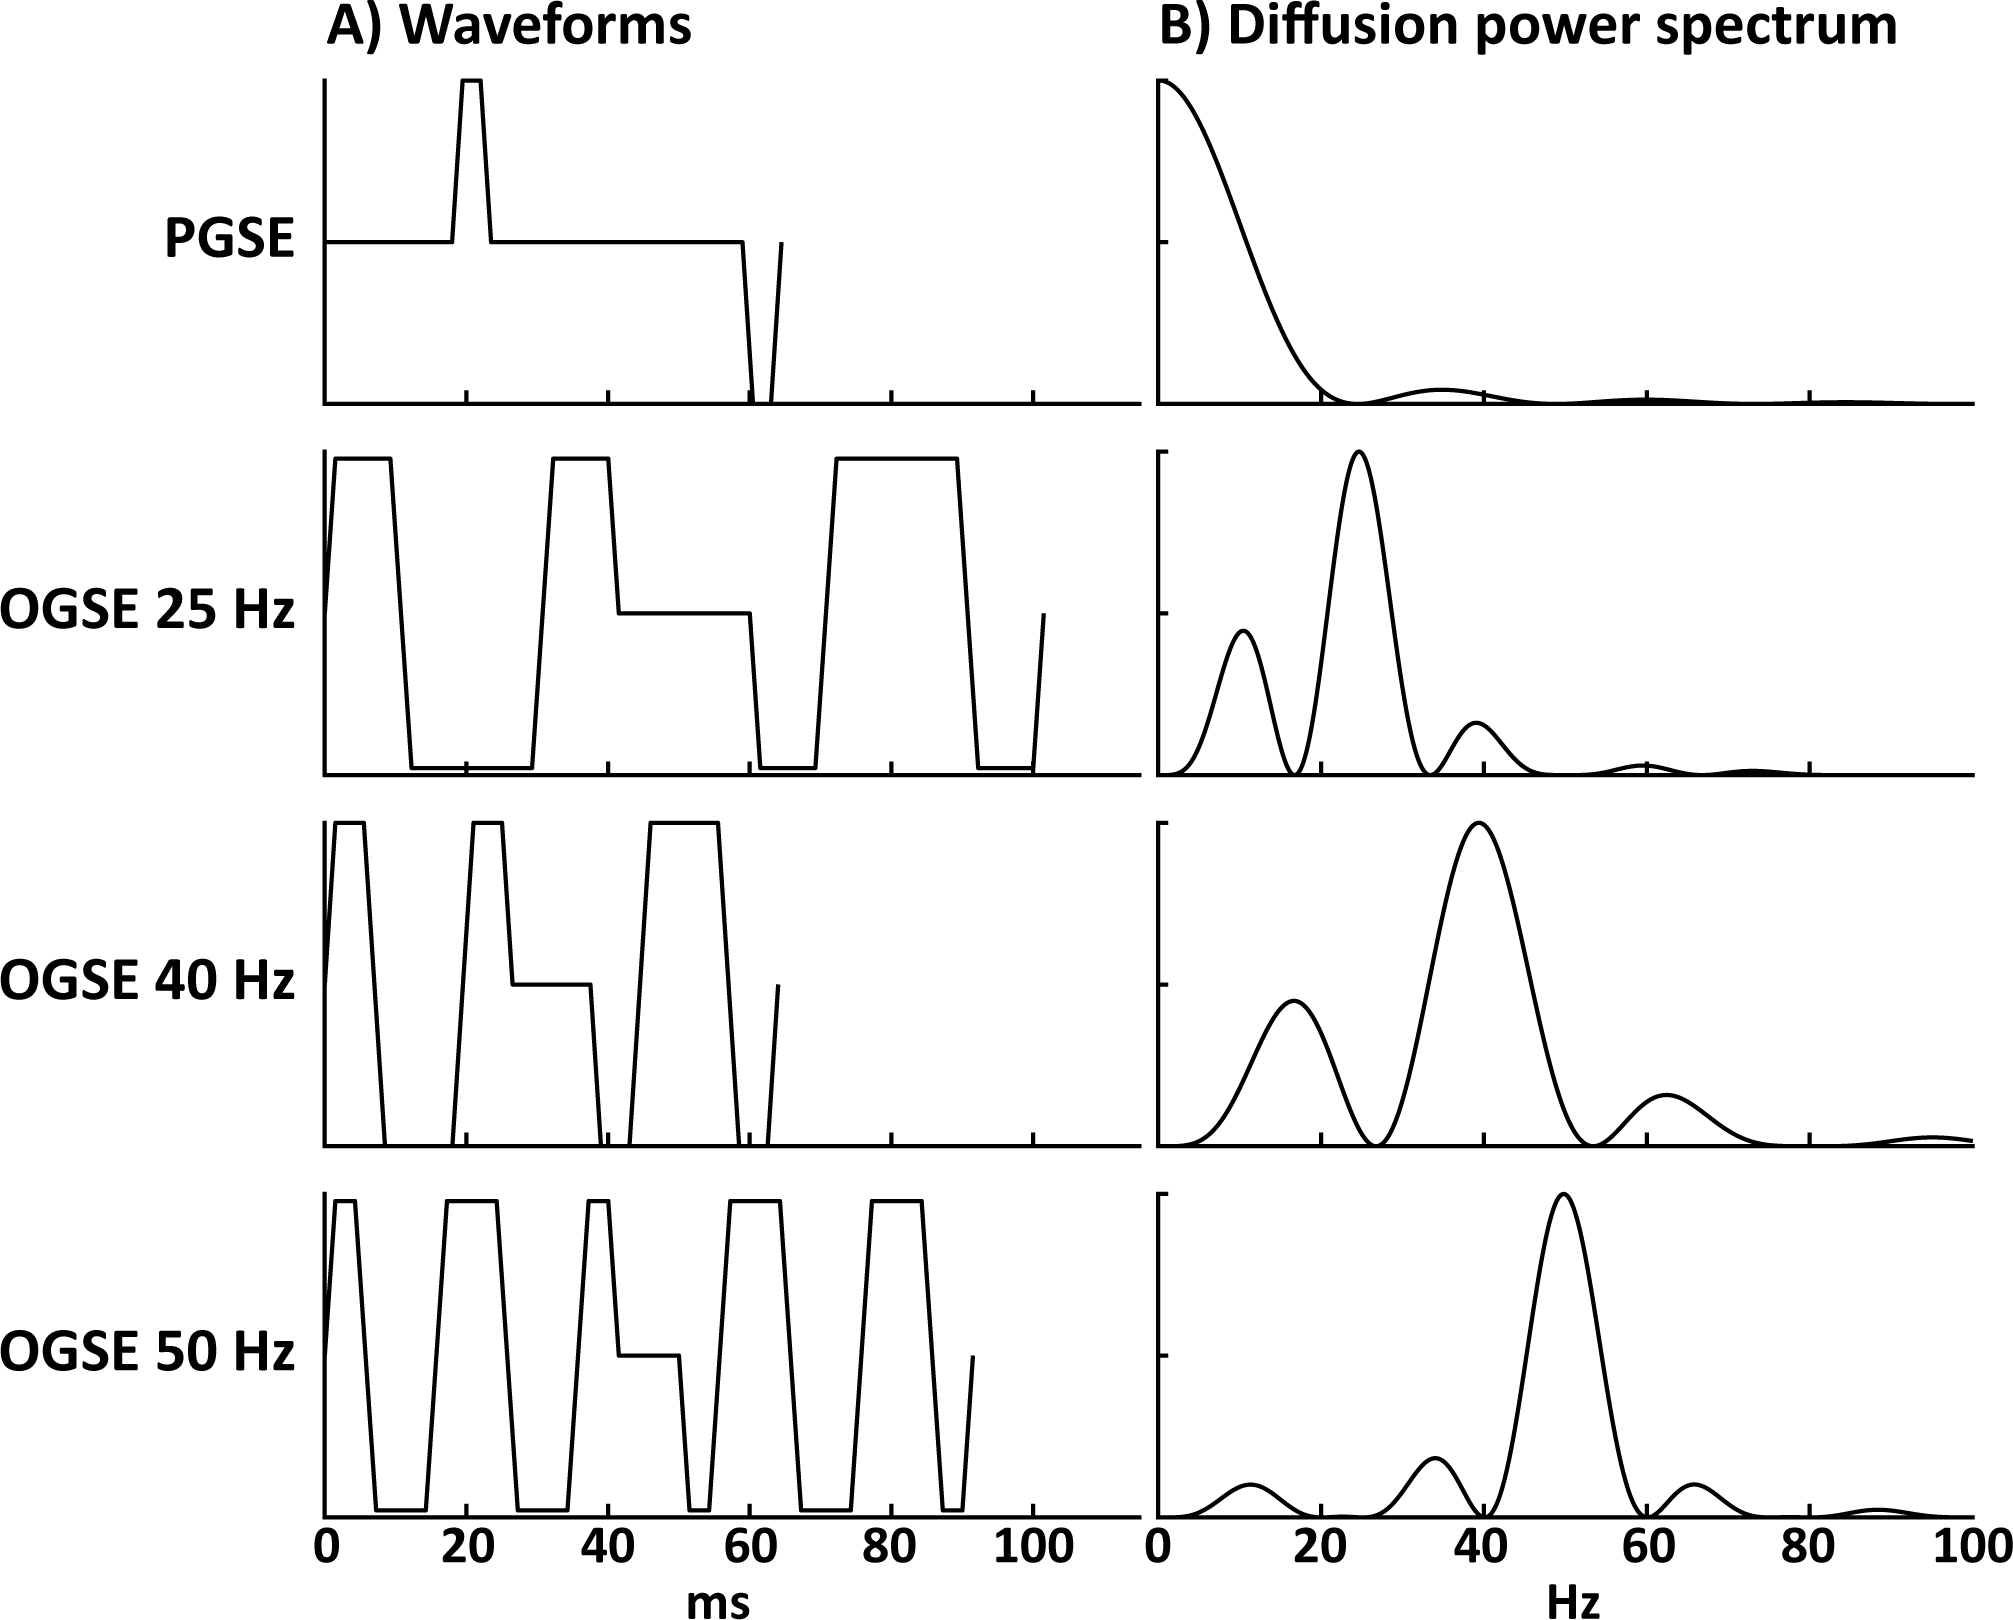
Two sets of PGSE/OGSE diffusion protocols (Table 1 for details) were acquired on a 3T Siemens Prisma in (sub)acute stroke patients: (1) PGSE and OGSE 40/50 Hz – n=8,63±7 (51-74) years old, 7 males, NIHSS 8±5 (1-18), scanned 41±21 (6-72) hours after stroke onset, lesion volumes 5±7 (0.02-18.1) cm3; and (2) PGSE and OGSE 25/50 Hz – n=4, 52±25 (20-77) years old, 3 males, NIHSS 3±3 (1-7), scanned 33±5 (29-40) hours after stroke onset, lesion volumes 2.0±0.2 (1.8-2.2) cm3. The single-shot EPI diffusion images were acquired on a 3T scanner (MAGNETOM Prisma, Siemens Healthcare, Erlangen, Germany) with 20 3 mm (no gap) axial slices centred on the lesion, 1.85x1.85 mm2 in-plane resolution, and GRAPPA R=2 using three diffusion waveforms per patient over 8 minutes (Figure 1 including diffusion power spectrum. PGSE/OGSE MD were computed and coregistered using ExploreDTI and FSL. Voxel-wise DDR map (MD as a linear function of f0.5) was calculated in Matlab. Manual regions-of-interest yielded DDR in lesion white matter which was compared to the contralateral hemisphere using paired t test. Linear correlation was performed between DDR and patient demographic information.Results
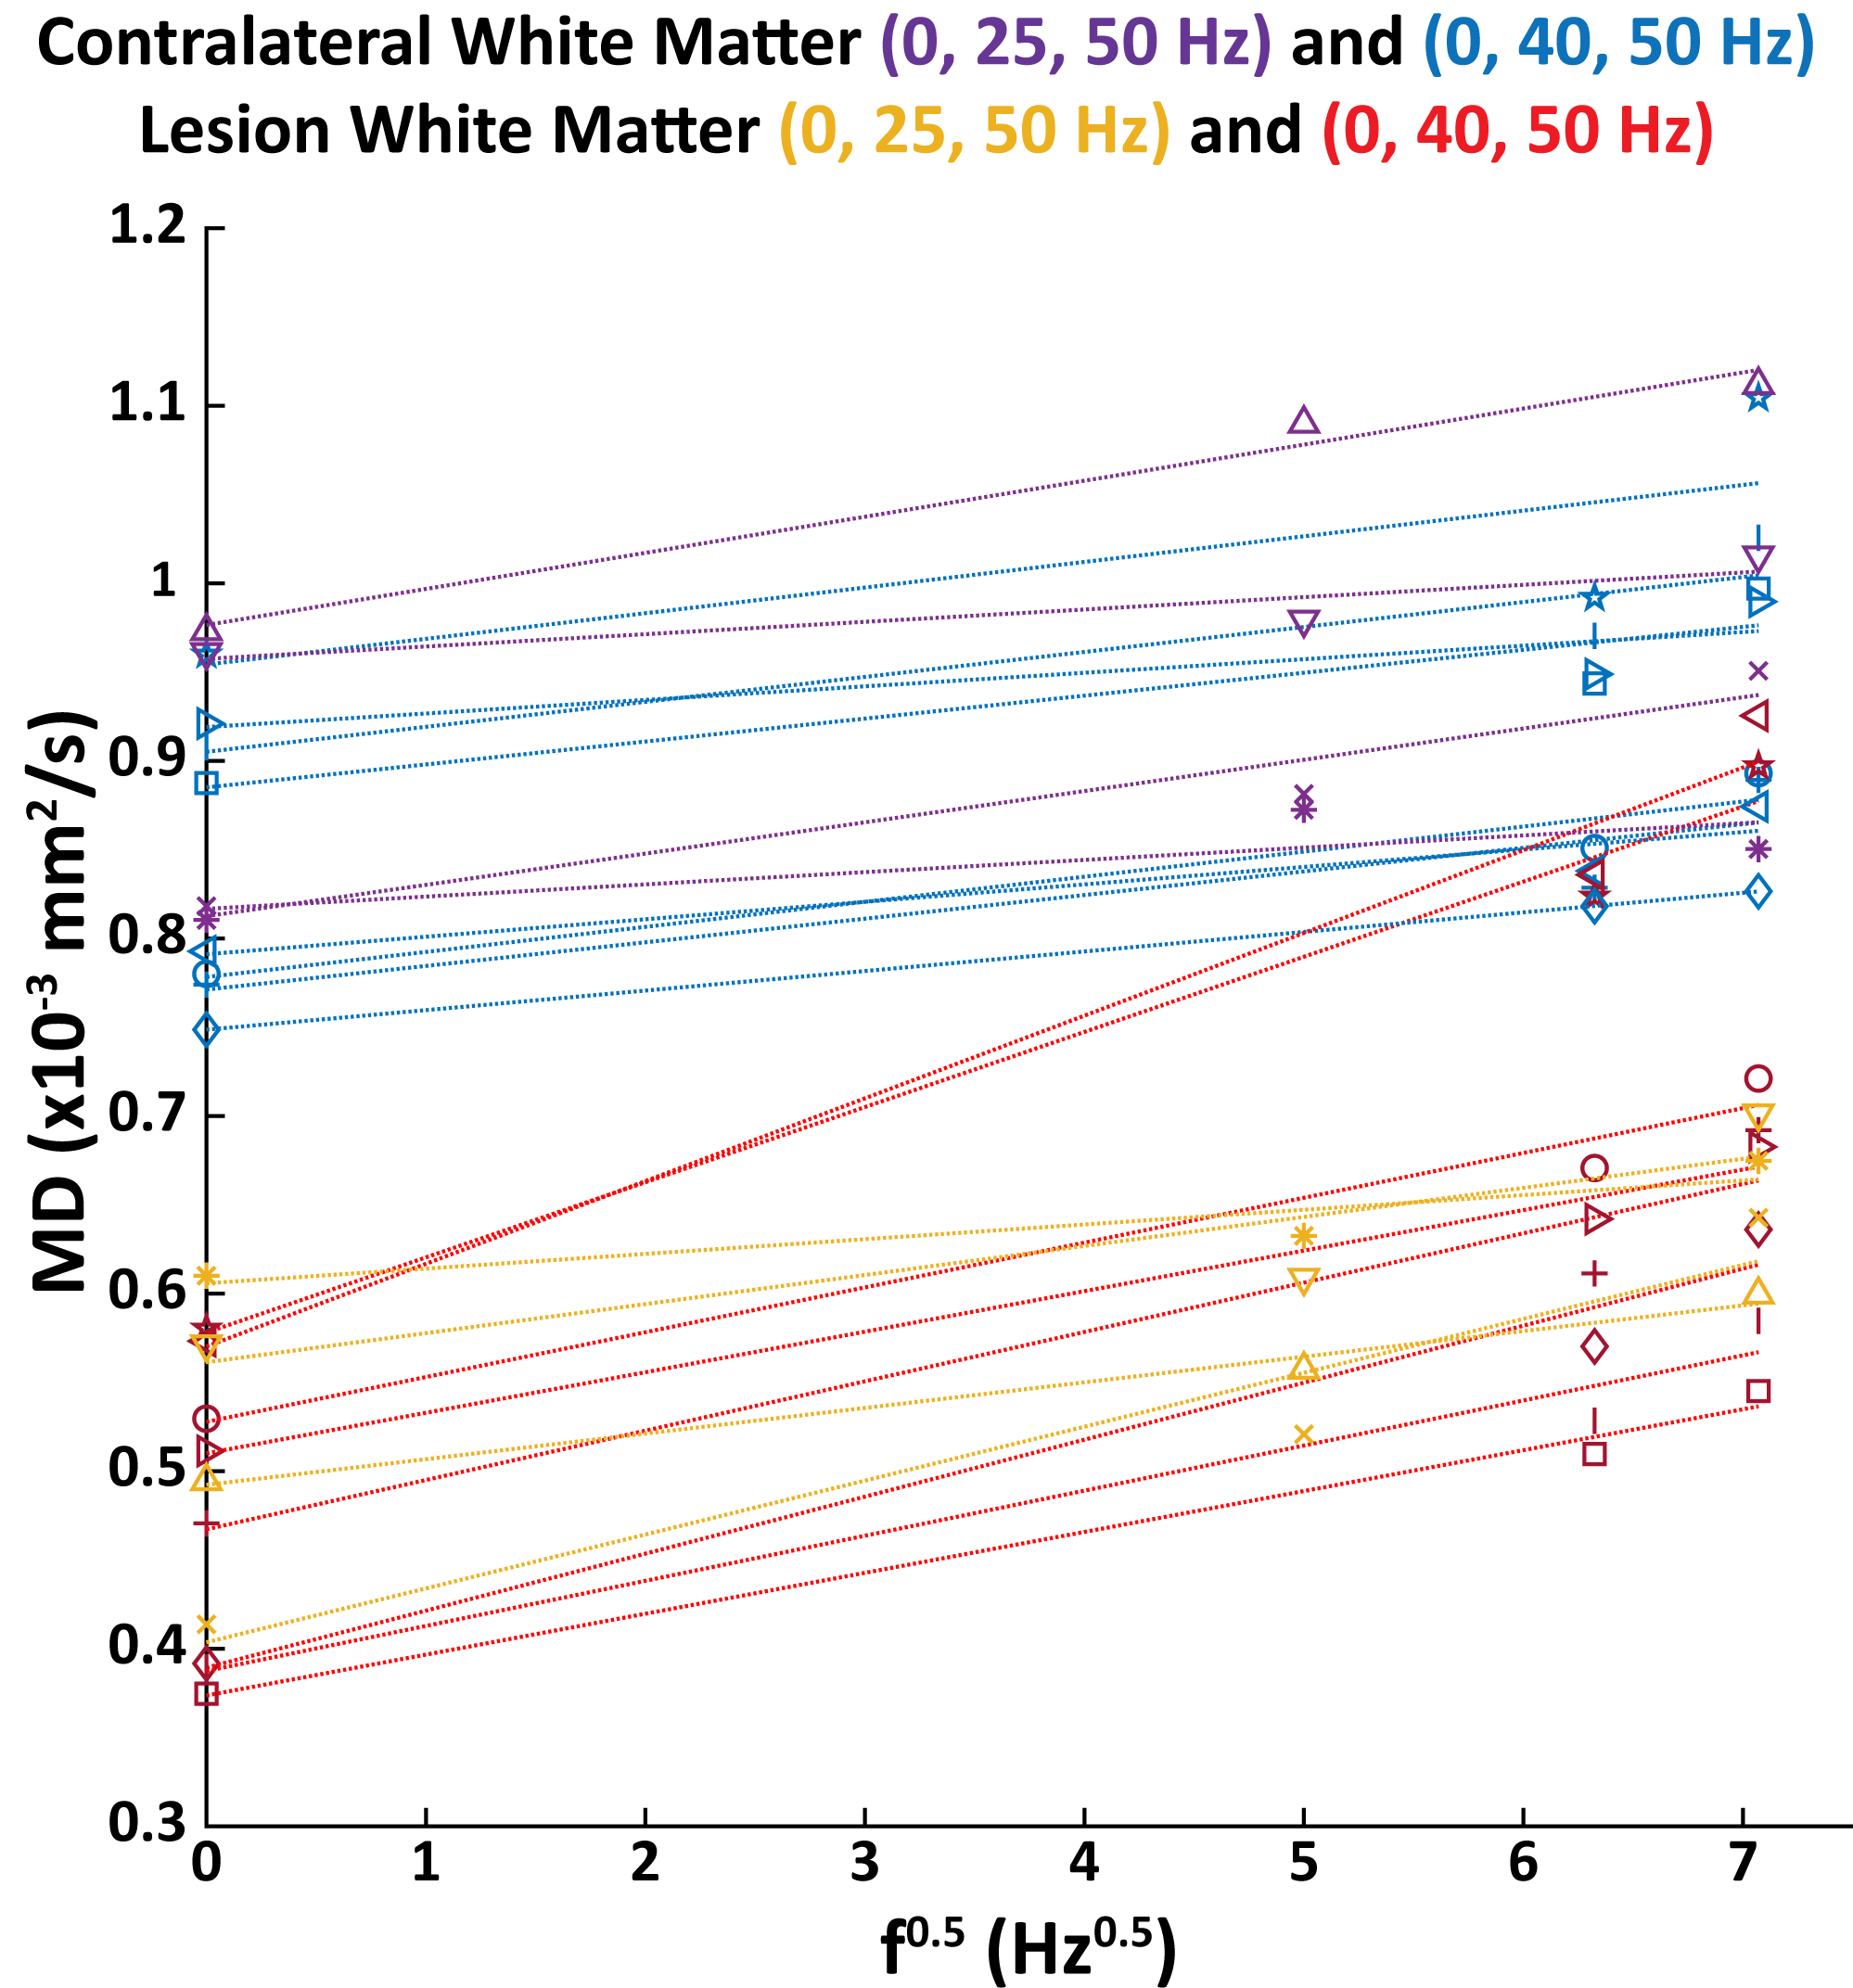
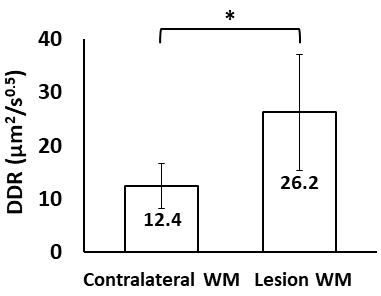
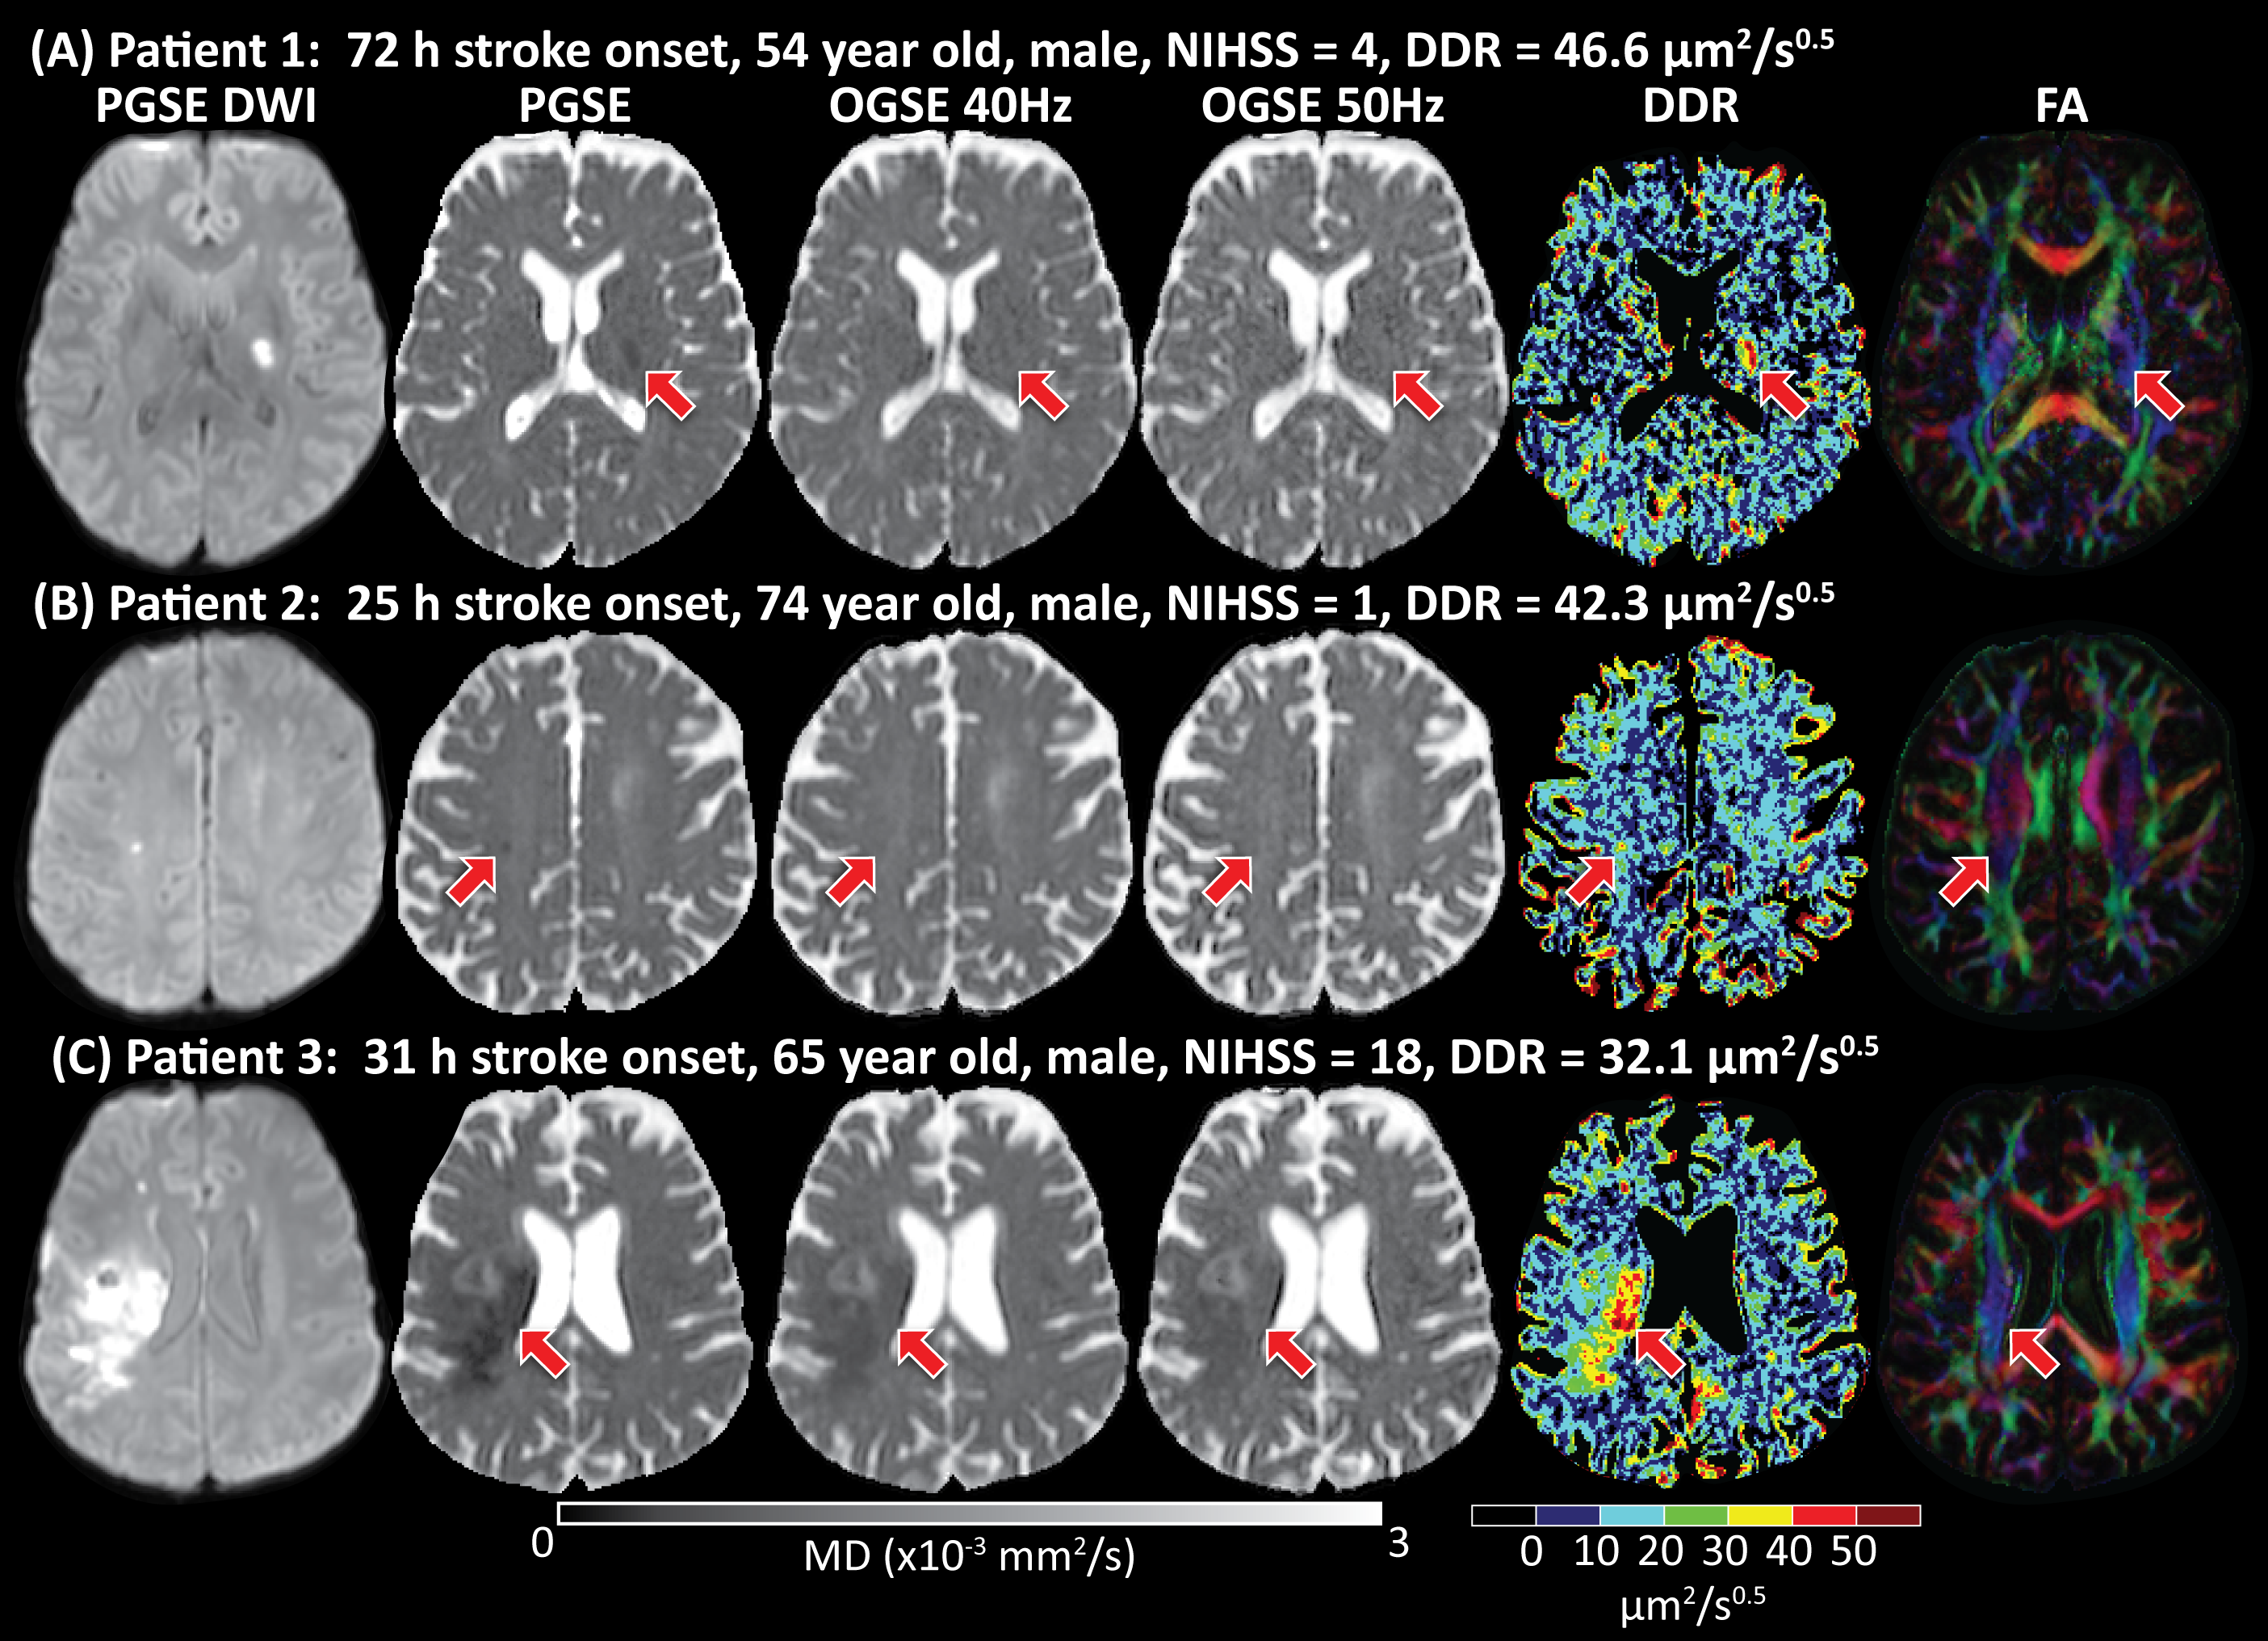
PGSE (0 Hz) and OGSE 25/40/50 Hz showed that MD was dependent on oscillating frequency were with greater slopes in lesion white matter relative to contralateral white matter (Figure 2). Overall, DDR was significantly larger in ischemic white matter (26.2±10.9 µm2/s0.5) versus contralateral white matter (12.4±4.2 µm2/s0.5, p = 0.001) (Figure 3). There was large variability of DDR in lesions across patients (range of 8.3-46.6 µm2/s0.5) versus contralateral white matter (range of 6.9-20.3 µm2/s0.5). The two patients with the largest lesion DDR values (46.6 and 42.3 µm2/s0.5) had two of the highest PGSE MD (~0.58x10⁻³ mm2/s) and had lesions located in the posterior limb of internal capsule (PLIC) and corticospinal tract both notably showing ‘disappearing’ strokes on the short diffusion time OGSE MD maps (Figure 4A&B). However, the patient with the third largest DDR (32.1 µm2/s0.5) had low PGSE MD (0.39x10⁻³ mm2/s) with part of the lesion located in PLIC (Figure 4C). No correlation was found between DDR and stroke onset time, age, NIHSS or lesion volume.Discussion
The marked diffusion time effect in human acute ischemic stroke is well-described with MD as a linear function of f0.5 using PGSE (0 Hz) and multiple OGSE frequencies of 25, 40 and 50 Hz. The significantly higher DDR in ischemic WM relative to contralateral WM is consistent with animal stroke models7,8,12. It is also consistent with greater MD change with OGSE in human stroke, although DDR was not calculated11. The DDR measured experimentally in contralateral WM showed good agreement with recent OGSE studies in healthy human brain2,3. Interestingly, the two disappearing lesions (Figure 4A&B) with the largest DDR were mainly located in large, coherent WM tracts which may have larger diameter axons. DDR (perpendicular) has been shown to increase with greater (healthy) axon diameters5. However, large DDR difference (16.4-46.6 µm2/s0.5) occurred even with similar lesion WM involvement. This variability may be due to averaging the whole lesion WM. For example, patient 3 (Figure 4C) had distinct DDR in the lesion WM subregions of PIC (45.6 µm2/s0.5) and subcortical WM (29.5 µm2/s0.5), with the former matching with patient 1&2. In conclusion, diffusion dispersion rate may be an informative measure to assess microstructural changes in acute stroke.Acknowledgements
Supported by the Heart and Stroke Foundation of Canada and China Scholarship Council.References
1. Baron CA, Beaulieu C. Oscillating gradient spin‐echo (OGSE) diffusion tensor imaging of the human brain. Magnetic resonance in medicine. 2014;72(3):726-736.
2. Arbabi A, Kai J, Khan AR, Baron CA. Diffusion dispersion imaging: mapping oscillating gradient spin‐echo frequency dependence in the human brain. Magnetic Resonance in Medicine. 2020;83(6):2197-2208.
3. Tan ET, Shih RY, Mitra J, et al. Oscillating diffusion‐encoding with a high gradient‐amplitude and high slew‐rate head‐only gradient for human brain imaging. Magnetic Resonance in Medicine. 2020;84(2):950-965.
4. Michael ES, Hennel F, Pruessmann KP. Evaluating diffusion dispersion across an extended range of b‐values and frequencies: Exploiting gap‐filled OGSE shapes, strong gradients, and spiral readouts. Magnetic Resonance in Medicine. 2022;87(6):2710-2723.
5. Xu J, Li H, Li K, et al. Fast and simplified mapping of mean axon diameter using temporal diffusion spectroscopy. NMR in Biomedicine. 2016;29(4):400-410.
6. Novikov DS, Jensen JH, Helpern JA, Fieremans E. Revealing mesoscopic structural universality with diffusion. Proceedings of the National Academy of Sciences. 2014;111(14):5088-5093.
7. Does MD, Parsons EC, Gore JC. Oscillating gradient measurements of water diffusion in normal and globally ischemic rat brain. Magnetic Resonance in Medicine. 2003;49(2):206-215.
8. Wu D, Martin LJ, Northington FJ, Zhang J. Oscillating gradient diffusion MRI reveals unique microstructural information in normal and hypoxia‐ischemia injured mouse brains. Magnetic Resonance in Medicine. 2014;72(5):1366-1374.
9. Novikov DS, Fieremans E, Jespersen SN, Kiselev VG. Quantifying brain microstructure with diffusion MRI: Theory and parameter estimation. NMR in Biomedicine. 2019;32(4):e3998.
10. Zhou M, Stobbe R, Buck B, et al. Exploring the oscillating gradient waveform frequency dependence of diffusivity changes in human acute ischemic stroke. In Proceedings of the 32nd Annual Meeting of ISMRM 2023; Toronto, Canada. p.3220.
11. Baron CA, Kate M, Gioia L, et al. Reduction of diffusion-weighted imaging contrast of acute ischemic stroke at short diffusion times. Stroke. 2015;46(8):2136-2141.
12. Wu D, Martin LJ, Northington FJ, Zhang J. Oscillating-gradient diffusion magnetic resonance imaging detects acute subcellular structural changes in the mouse forebrain after neonatal hypoxia-ischemia. Journal of Cerebral Blood Flow & Metabolism. 2019;39(7):1336-1348.
Figures