3497
Enhancing subtle cortical lesion detection through multi-dimensional MRI modelling and optimization1Psychology, Cardiff University, Cardiff, United Kingdom, 2Computer Science and Informatics, Cardiff University, Cardiff, United Kingdom
Synopsis
Keywords: Diffusion Modeling, Neuro
Motivation: Many cortical pathologies are invisible via conventional MRI, making it difficult for clinicians to correctly diagnose and treat patients.
Goal(s): Our aim was to optimize advanced MRI acquisitions, making them sensitive to subtle cortical pathologies while at the same time reducing acquisition times to clinically-feasible durations.
Approach: We calculated the combined relaxation-diffusion signal to encompass surface relaxivity and T2 effects. We used Monte-Carlo simulations to model the signal from healthy and pathological cortical neurons for different PGSE schemes.
Results: Our optimized sequences can distinguish pathology associated with focal cortical dysplasia from healthy tissue, and differentiate between focal cortical dysplasia subcategories.
Impact: We calculate the combined relaxation-diffusion signal encompassing surface relaxivity and T2 effects, and use it in Monte-Carlo simulations to optimize MRI sequences for subtle cortical lesion detection. Our methodology can be used by researchers to investigate other cortical pathologies.
Introduction
The limited ability of conventional MRI to detect cortical lesions is problematic for patients suffering from conditions such as focal cortical dysplasia (FCD). Multi-dimensional MRI allows simultaneous quantification of multiple properties sensitive to tissue microstructure, but requires long, clinically-unfeasible acquisitions1.Here we used Monte-Carlo simulations to optimize combined relaxation-diffusion MRI and enhance the detection of subtle cortical lesions. We used FCD as an example pathology that is challenging to image2. We simulated the multi-dimensional MRI signal for healthy neurons3,4, and for dysmorphic neurons and balloon cells, i.e., the large neurons comprising the pathology of type-II FCD2,5,6.
Methods
Digital reconstructions (.swc files) of neurons from the frontal, motor and temporal cortices (where FCD usually presents) were downloaded from https://neuromorpho.org7-13. They were either used as they were to represent healthy neurons, or adapted using the Trees Toolbox14 to resemble balloon cells or dysmorphic neurons. The adaptations involved enlarging the soma to diameters appropriate for the pathological neurons, and trimming dendrites to mimic their arborization. Meshes representing the neuron boundaries were generated using the SWC-Mesher package within the Blender software15.Monte-Carlo simulations were performed using a modified version of Disimpy(https://github.com/kerkelae/disimpy)16, where we added the capability to simulate the combined relaxation-diffusion MRI signal accounting for surface relaxivity and T2 effects.
The phase accumulated by spin $$$j$$$ moving inside a neuron under a diffusion-sensitising gradient $$${\bf{g}}(t)$$$ after one echo time (TE=K$$$\delta t$$$) is17,18:
$$\phi_j=\gamma\int_0^{\mathrm{TE}}a(\tau){\bf{g}}(\tau)\cdot{\bf{r}}_j(\tau)d\tau$$
where $$$a(t<\frac{\mathrm{TE}}{2})=+1$$$, $$$a(t\geq\frac{\mathrm{TE}}{2})=-1$$$.
The T2–magnetization decay is governed by the decay of the bulk magnetization and the non-uniform magnetization at the boundary of the restricting domain19,20. Considering these processes, the magnetization of spin $$$j$$$ at TE is:
$$M^j=\prod_{k=1}^{K}{e}^{-\frac{\delta t}{T_{2,i}}}(1-\psi^j P(k))$$
where $$$P(k)$$$ is 1 if the spin hits the boundary, 0 otherwise, and $$$\psi^j=\frac{2\rho_2\delta s}{3D_0}$$$ ($$$\delta s=$$$step length of the spin in infinitesimal time $$$\delta t$$$, $$$D_0$$$=diffusivity, $$$\rho_2$$$=membrane surface relaxivity). The normalized signal of $$$N$$$ spins is:
$$S_{\mathrm{normalized}}=\frac{\sum_{j=1}^{N}M^j {e}^{-i\phi}}{\sum_{j=1}^N M^j}.$$
Spins were placed inside each reconstructed neuronal substrate. A pulsed-gradient spin echo (PGSE) sequence with 12 b-values (0, 500, 1200, 2400, and 3000 to 10,000s/mm2 in increments of 1000 s/mm2) and 128 isotropically-distributed gradient directions was simulated for two diffusion timings ($$$\Delta$$$=45ms/$$$\delta$$$=15ms and $$$\Delta$$$=25ms/$$$\delta$$$=9ms), seven TEs (64, 70, 80, 90, 100, 110 and 120ms), and surface relaxivity of 10-7m/s. Signal convergence was tested over a range of spin numbers and time steps, and achieved for 1,000,000 spins and time step of 2x10⁻⁵s.
Simulations were run for healthy neurons (from the frontal, motor and temporal cortices), balloon cells and dysmorphic neurons. For each set of b-value, $$$\Delta$$$/$$$\delta$$$ and TE, the signal was averaged over the 128 gradient directions and normalized versus the signal for b=0s/mm2.
We hypothesized that the main driver of the differences in the signal for different neurons is the soma size. To test that, we calculated Spearman correlations between the normalized direction-averaged signal and the neuron soma diameter, for each b-value and TE.
To identify acquisition parameters that maximally differentiate between healthy people and FCD patients, we calculated the signal differences between healthy and pathological temporal-lobe voxels. Healthy voxels consisted of 22% extracellular space and 78% healthy neurons. We considered 2 pathology cases, both with 27% extra-cellular space21: a) 40% dysmorphic neurons, 33% healthy neurons (FCD-II type-a)5, and b) 20% balloon cells, 20% dysmorphic neurons, 33% healthy neurons (FCD-II type-b)5.
Results
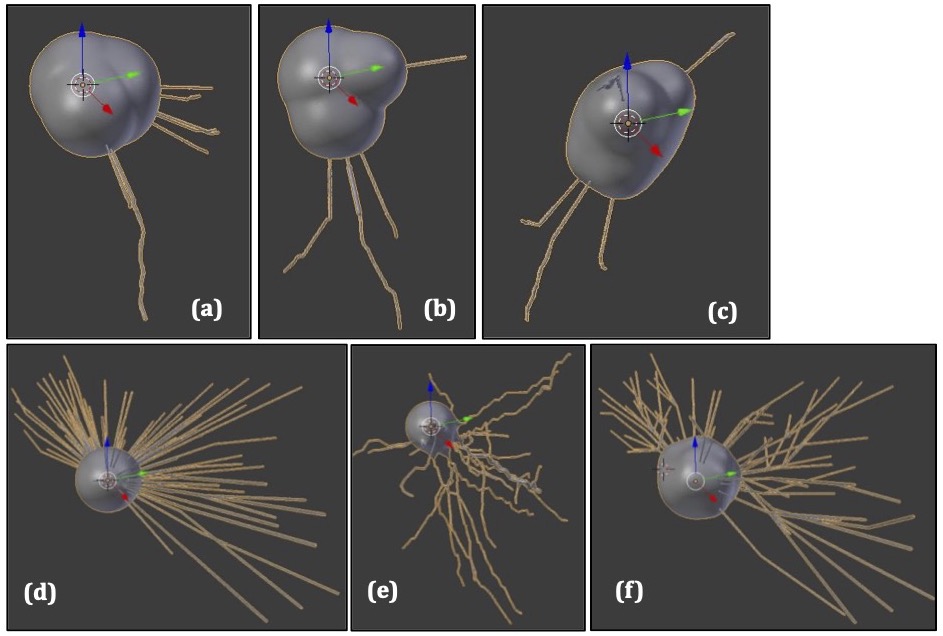
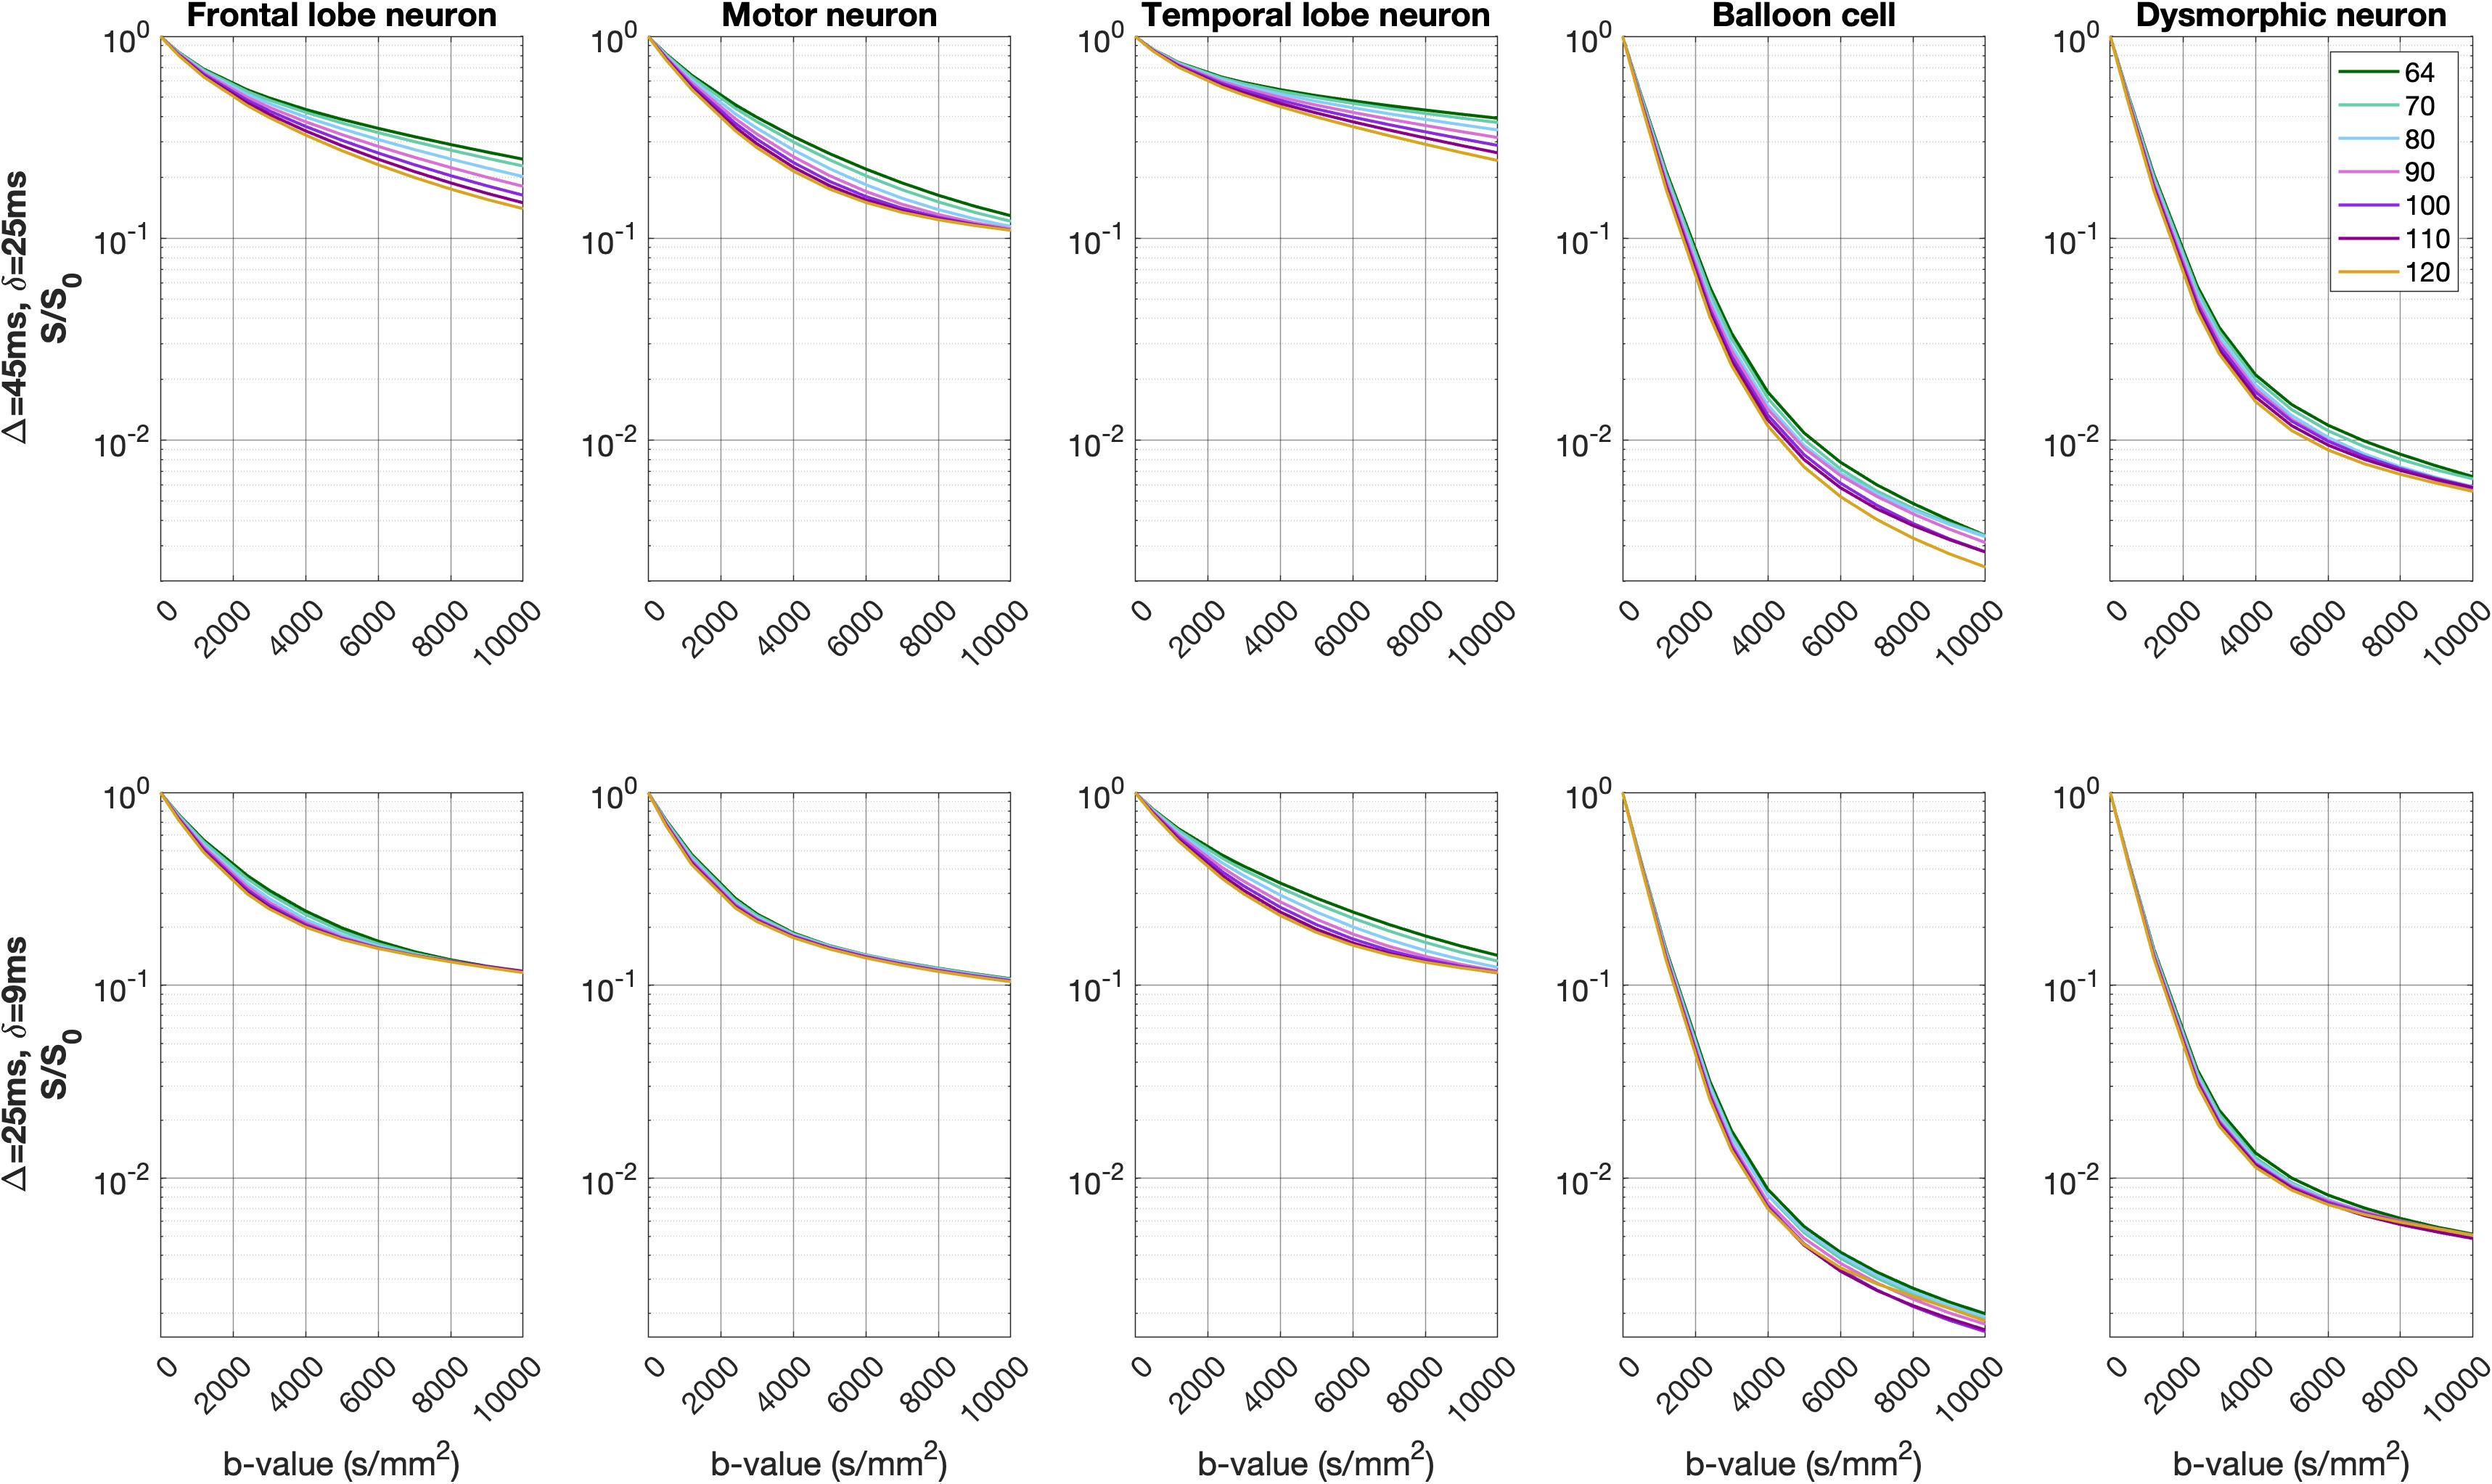
Fig. 1 shows the balloon-cell and dysmorphic-neuron models generated. Our models capture all characteristics of those pathological neurons seen in histology images (large soma, simplified arborization)5.The normalized direction-averaged signal was higher for the healthy neurons compared to the pathological neurons, across the b-values and TEs of the two PGSE schemes (Fig. 2).
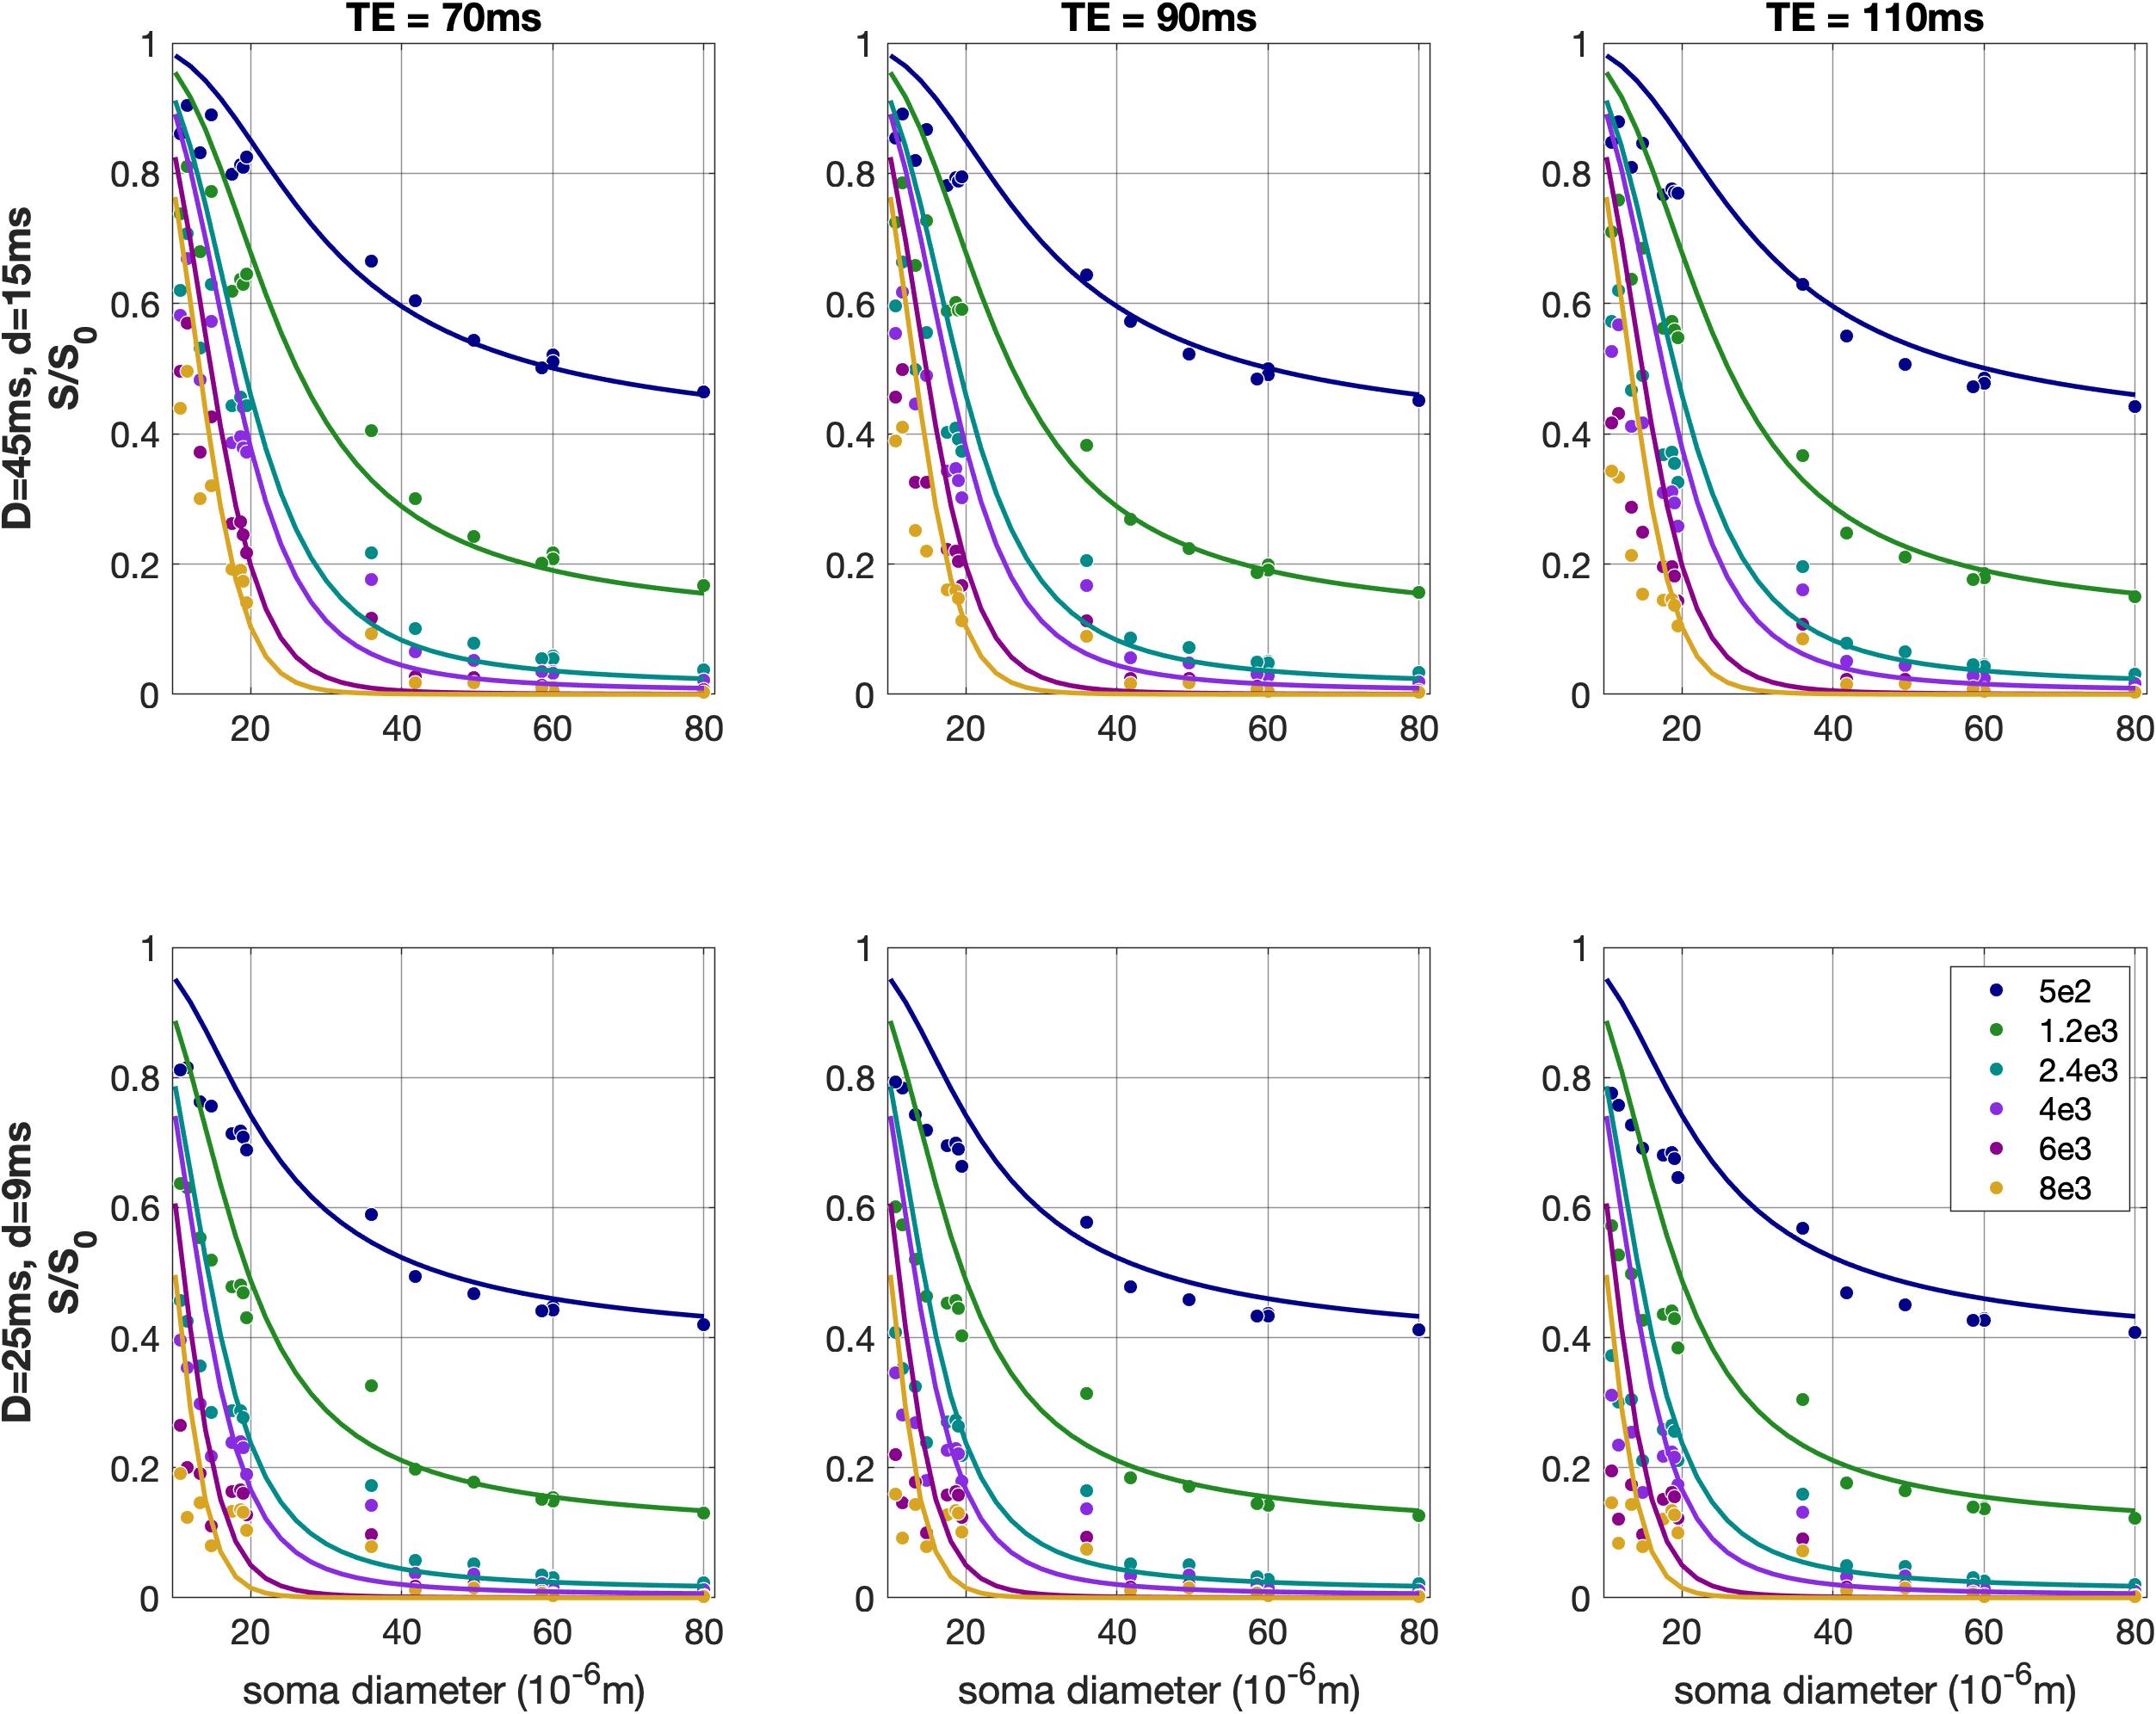
The Spearman correlations between signal and soma diameter ranged from -0.88 to -0.98 for all b-values and TEs ($$$p$$$-values<10-10). Those relationships are shown in Fig. 4 - overlayed are the curves representing the signal from a perfect sphere22.
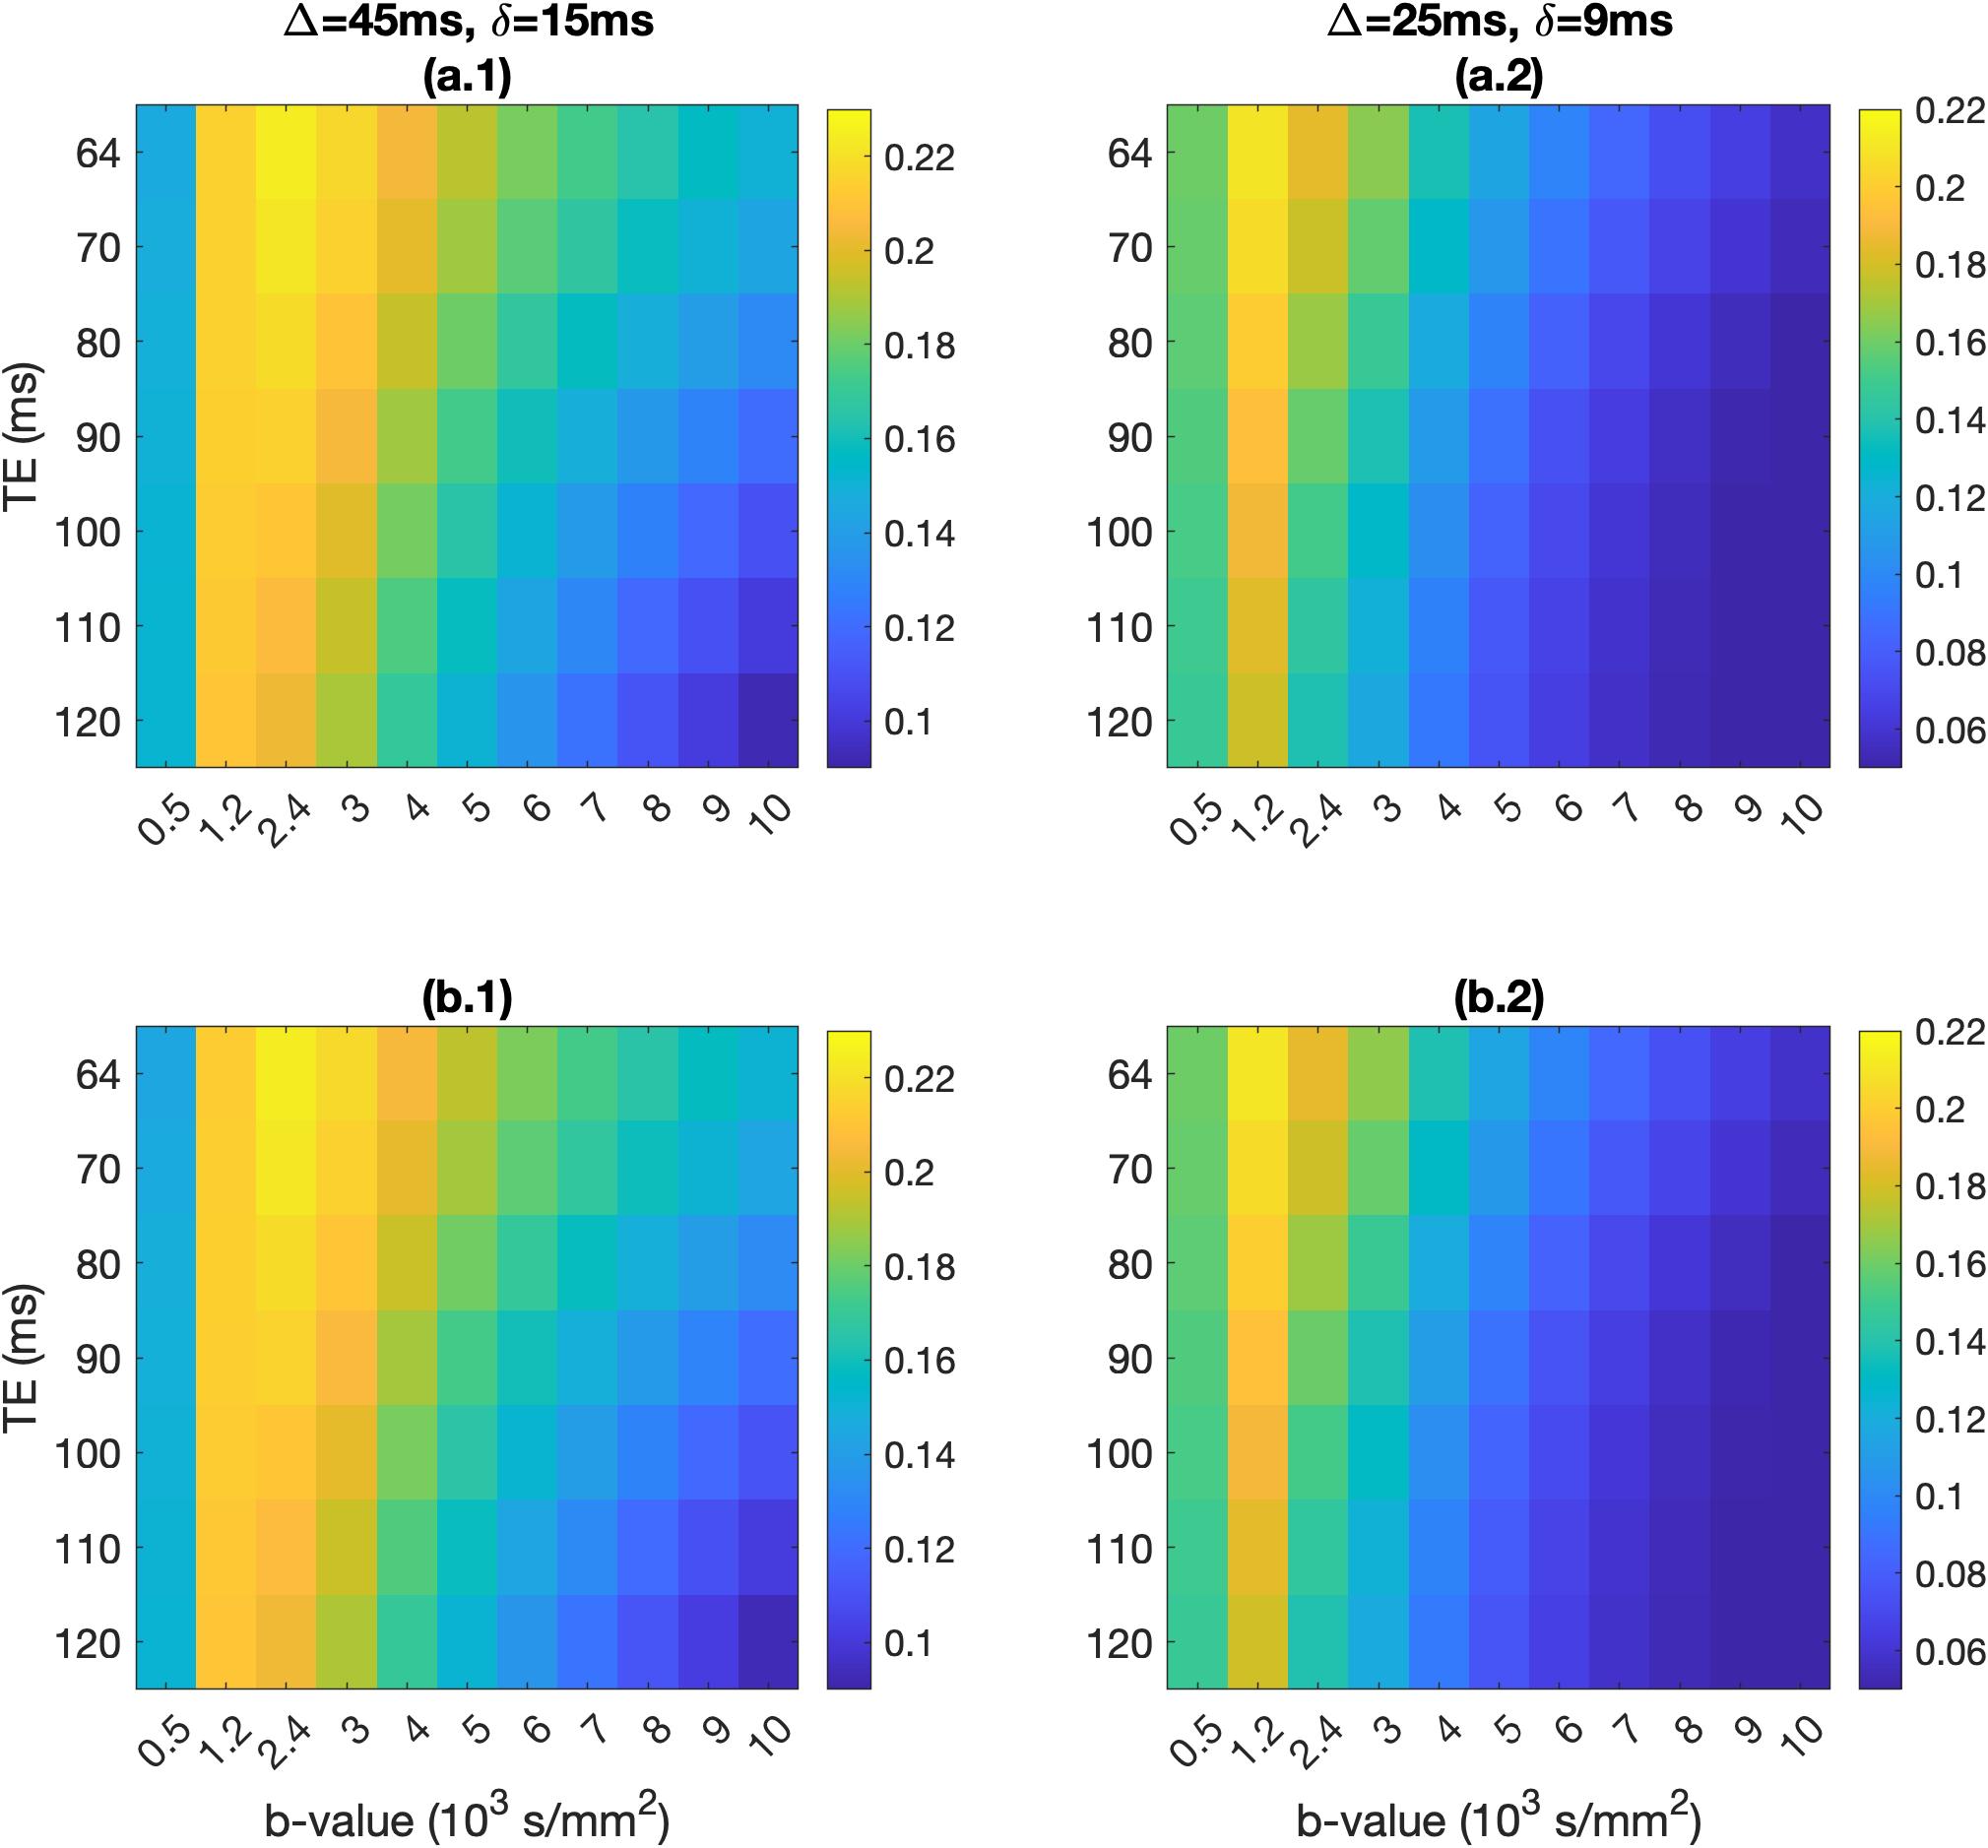
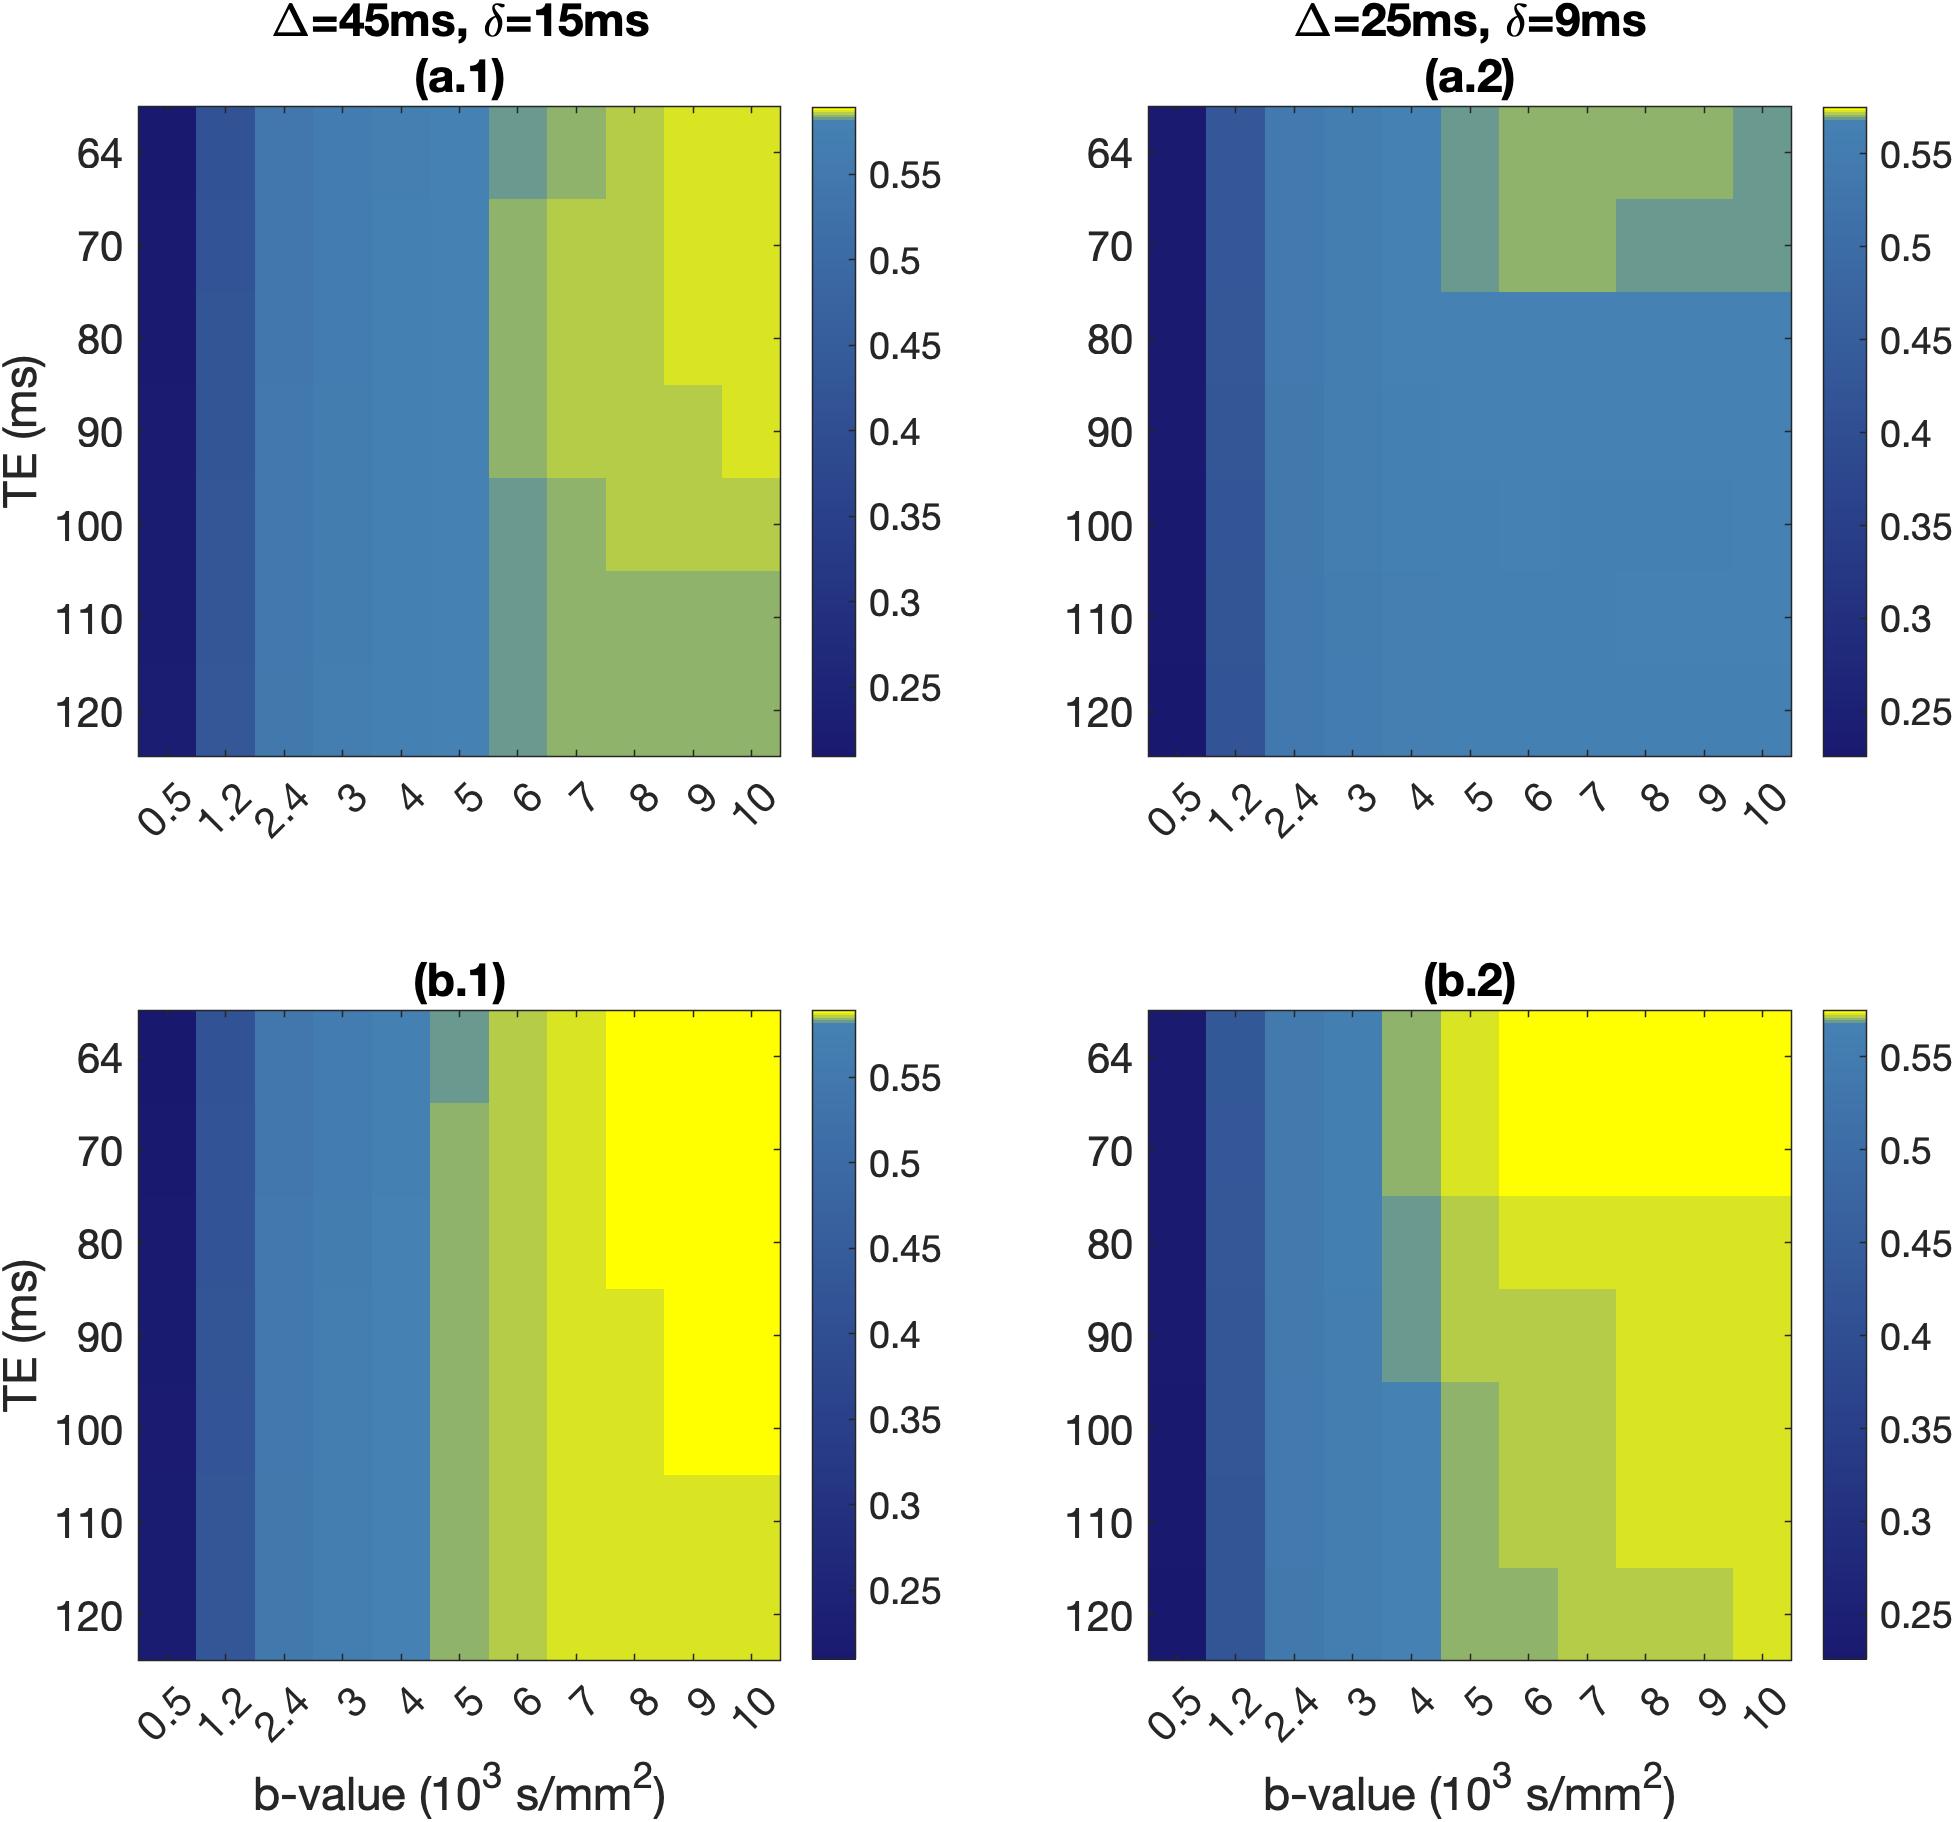
The absolute and fractional signal differences between the healthy and pathological voxels are shown in Fig. 4 and 5, across the b-values and TEs of the two PGSE schemes.
Discussion & Conclusions
Neuron soma size drives the signal differences for the neurons we modelled. The small differences between the perfect-sphere signal and that from our simulated neurons are due to the soma not being a perfect sphere, and the presence of dendrites.Absolute signal differences peaked at around b=2000s/mm2 for both PGSE schemes, allowing differentiation between healthy people and FCD patients. Fractional signal differences were higher at b=6000s/mm2 and above. FCD-IIb voxels exhibited higher fractional differences compared to FCD-IIa voxels, offering a potential avenue for non-invasively distinguishing between the two types of pathology.
Acknowledgements
EM, DKJ and MP are supported by a MRC grant at Cardiff University (MR/W031566/1). KŞ and MP are supported by a UKRI Future Leaders Fellowship (MR/T020296/2). CAR is supported by a UKRI PhD studentship.References
1. Afzali M, Mueller L, Sakaie K, et al. MR Fingerprinting with b-Tensor Encoding for Simultaneous Quantification of Relaxation and Diffusion in a Single Scan. Magn Reson Med. 2022; 88: 2043-2057.
2. Aslan A, Akif Deniz M, Tas Deniz Z, Turmak M, Ekici Faysal. Diagnostic contribution of focal cortical dysplasia MRI imaging findings and ADC values. Egyptian Journal of Radiology and Nuclear Medicine 2019; 50:15.
3. Palombo M, Alexander D C, Zhang H. A generative model of realistic brain cells with application to numerical simulation of the diffusion-weighted MR signal. NeuroImage 2019; 188:391-402.
4. Palombo M, Ianus A, Guerreri M, et al. SANDI: A compartment-based model for non-invasive apparent soma and neurite imaging by diffusion MRI. NeuroImage 2020, 215:116835.
5. Rossini L, De Santis D, Mauceri RR, et al. Dendritic pathology, spine loss and synaptic reorganization in human cortex from epilepsy patients. Brain 2021; 144(1):251-265.
6. Aronica E and Muhlebner A. Neuropathology of epilepsy. Handbook of Clinical Neurology 2018; 145:193-216.
7. Akram M A, Nanda S, Maraver P, Armañanzas R, Ascoli G A. An open repository for single-cell reconstructions of the brain forest. Sci Data 2018; 5:180006.
8. Jacobs B, Garcia M E, Shea-Shumsky N B, et al. Comparative morphology of gigantopyramidal neurons in primary motor cortex across mammals. Journal of Comparative Neurology 2017; 526(3):496-536.
9. Shao Y, Ge Q, Yang J, et al. Pathological networks involving dysmorphic neurons in type II focal cortical dysplasia. Neuroscience Bulletin 2022; 38:1007-1024.
10. Steele P R, Fantin Cavarsan C, Dowaliby L, et al. Altered motoneuron properties contribute to motor deficits in a rabbit hypoxia-ischemia model of cerebral palsy. Front. Cell. Neurosci. 2020; 14
11. Aihara S, Fujimoto S, Sakaguchi R, Imai T. BMPR-2 gates activity-dependent stabilization of primary dendrites during mitral cell remodeling. Cell Reports 2021; 35(12):109276.
12. Scholtens L, Pijnenburg R, de Lange S C, et al. Common Microscale and Macroscale Principles of Connectivity in the Human Brain. Journal of Neuroscience 2022; 42(20):4147-4163.
13. Wang B, Yin L, Zou X, et al. A Subtype of Inhibitory Interneuron with Intrinsic Persistent Activity in Human and Monkey Neocortex. Cell Reports 2015; 10(9):1450-1458.
14. Cuntz H, Forstner F, Borst A, Häusser M. One rule to grow them all: A general theory of neuronal branching and its practical application. PLoS Comput Biol 2010; 6(8): e1000877.
15. Blender Online Community. Blender – a 3D modelling and rendering package. http://www.blender.org.
16. Kerkelä L, Nery F, Hall M G, Clark C A. Disimpy: A massively parallel Monte Carlo simulator for generating diffusion-weighted MRI data in Python. The Journal of Open Source Software 2020; 5(52):2527.
17. Hall M G, Alexander D C. Convergence and parameter choice for Monte-Carlo simulations of diffusion MRI. IEEE Transactions on Medical Imaging 2009; 28(9):1354-1364.
18. Hong-Hsi L, Fieremans E, Novikov D S. Realistic Microstructure Simulator (RMS): Monte Carlo simulations of diffusion in three-dimensional cell segmentations of microscopy images. Journal of Neuroscience Methods 2021; 350:109018.
19. Mao-jin T, Jing-jing X, You-long Z, Chi-cheng X. Nuclear magnetic resonance (NMR) microscopic simulation based on random walk: Theory and parameter analysis. J. Cent. South. Univ. 2014; 21:1091-1097.
20. Benavides F, Leiderman R, Souza A, Carneiro G, Bagueira R. Estimating the surface relaxivity as a function of pore size from NMR T2 distributions and micro-tomographic images. Computers & Geosciences 2017; 106:200-208.
21. Zamecnik J, Homola A, Cicanic M, et al. The extracellular matrix and diffusion barriers in focal cortical dysplasias. European Journal of Neuroscience 2012; 36: 2017-2024.
22. Murday J S, Cotts R M.
Self‐Diffusion Coefficient of Liquid Lithium. J. Chem. Phys. 1968l 48, 4938–4945.
Figures