3496
Nonparametric evaluation of diffusion regimes in brain tumours and associated diffusion hyperintensities1INM-4, Research Centre Juelich, Juelich, Germany, 2Centre of Neurosurgery, University Hospital of Cologne, Cologne, Germany, 3RWTH Aachen University, Aachen, Germany, 4INM-11, JARA, Research Centre Juelich, Juelich, Germany, 5JARA - BRAIN - Translational Medicine, Aachen, Germany
Synopsis
Keywords: Microstructure, Microstructure
Motivation: To investigate tumour-associated diffusion hyperintensities
Goal(s): Might provide some insight into tumour environment leading to restricted diffusion.
Approach: Extended diffusion range, with b-values from 0 to 10000 and two echo times, allowing for NNLS decomposition of diffusion spectra and T2 mapping.
Results: Restricted diffusion characterised.
Impact: Possibly relevant to tumour cell migration and associated changes in the extracellular matrix.
Introduction
More than three decades ago, Le Bihan et al.1 showed the existence of an ultrafast diffusion component in addition to the 6 times slower than free water tissue diffusion. Subsequently, Mulkern et al.2 pointed out that the signal decay from brain tissue over an extended range of b-factors (0-6000 s/mm2) showed a further, decidedly non-exponential behavior well-suited to biexponential modeling. A total of (at least) three exponentials should therefore be recovered when investigating brain tissue over a large diffusion regime. The underlying mechanisms of these deviations – whether physical components or not - are far from being well understood and remain controversially discussed in the literature3,4. More recently, the active trans-membrane water cycling (AWC) process has added a metabolic component to the multitude of microstructural factors influencing diffusion in tissue5,6.Brain tumours modify the cellular matrix of normal tissue, are associated with increased vascular permeability, exchange time between intra-extracellular environments and edema7, rendering a rigourous modelling of the diffusion signal as a means of deconvoluting tissue microstructure even more difficult than in healthy tissue.
Data-driven approaches, such as inverse Laplace transform, non-negative least squares decomposition, or non negative matrix factorization offer the advantage of pragmatically characterizing diffusion regimes without predefining a number components to be expected and are being increasingly used8-10.
We investigate in the following a subcategory of brain tumours which display associated diffusion hyperintensities using an extended range of b-values (0-10000s/mm2) and NNLS. The origin of the restricted diffusion lesions in brain tumour patients is still little studied and elusive, but they have been associated with poor prognosis11-13.
Materials and Methods
From February 2016 to July 2019, 51 patients that were referred to our centre from the hospitalsin the region for diagnostic imaging purposes were randomly selected to undergo the dMRI
protocol described below. Ethical approval was obtained from the individual hospitals, in accordance to the requirements of the local ethics committees, and prior written and informed consent was given by the patients. The patients underwent simultaneous PET-MR acquisitions, performed on a hybrid Siemens (Erlangen, Germany) scanner based on a 3T Tim-TRIO MR system with a BrainPET insert (Herzog et al., 2011) and amino acid O-(2-18F-fluoroethyl)-L-tyrosine (18F-FET) PET. The FET-PET hotspot was defined by summing the last 4 frames of the PET dynamic acquisition and applying a threshold of 1.6x the average contralateral WM intensity, as described by (Pauleit et al., 2005).
Two dMRI acquisitions were performed, eith three orthogonal diffusion encoding directions per b-value. 16 low b-values of 0, 50, 100, 200, 300, 500, 700, 1000, 1200, 1500, 1800, 2000, 2200, 2500, 2700, and 3000 s/mm2 were acquired with TE of 92 ms within TA=4 mins 19 secs; and 13 b-values: 0, 1000, 1500, 2000, 2500, 3000, 4000, 5000, 6000, 7000, 8000, 9000, 10000 s/mm2 at TE of 134 ms were acquired within 3 mins 30 secs. Other parameters included: TR = 5000 ms, voxel size 2x2x2 mm3, FOV = 220x156 mm2, 24 slices with a 1.4 mm slice gap, partial fourier of 5/8 and IPAT factor of 2. Data were denoised using a principal component analysis-based approximation, as reported before [Loucao et al] and analysed by NNLS with Tikhonov regularisation, similar to [MacKay]. T2 maps were obtained by jointly analysing diffusion and T2 compartments.
Results, Discussion and Conclusions
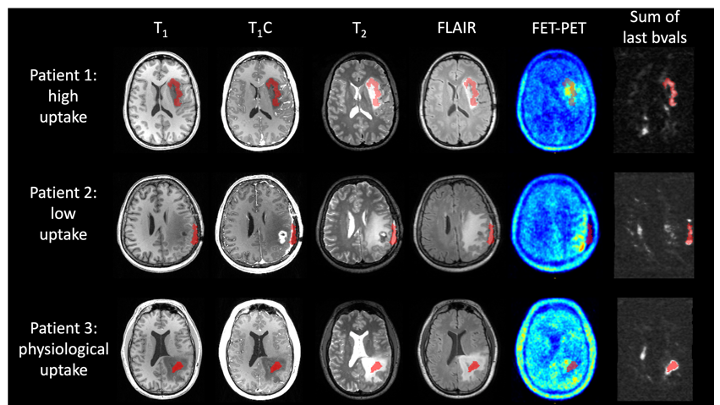
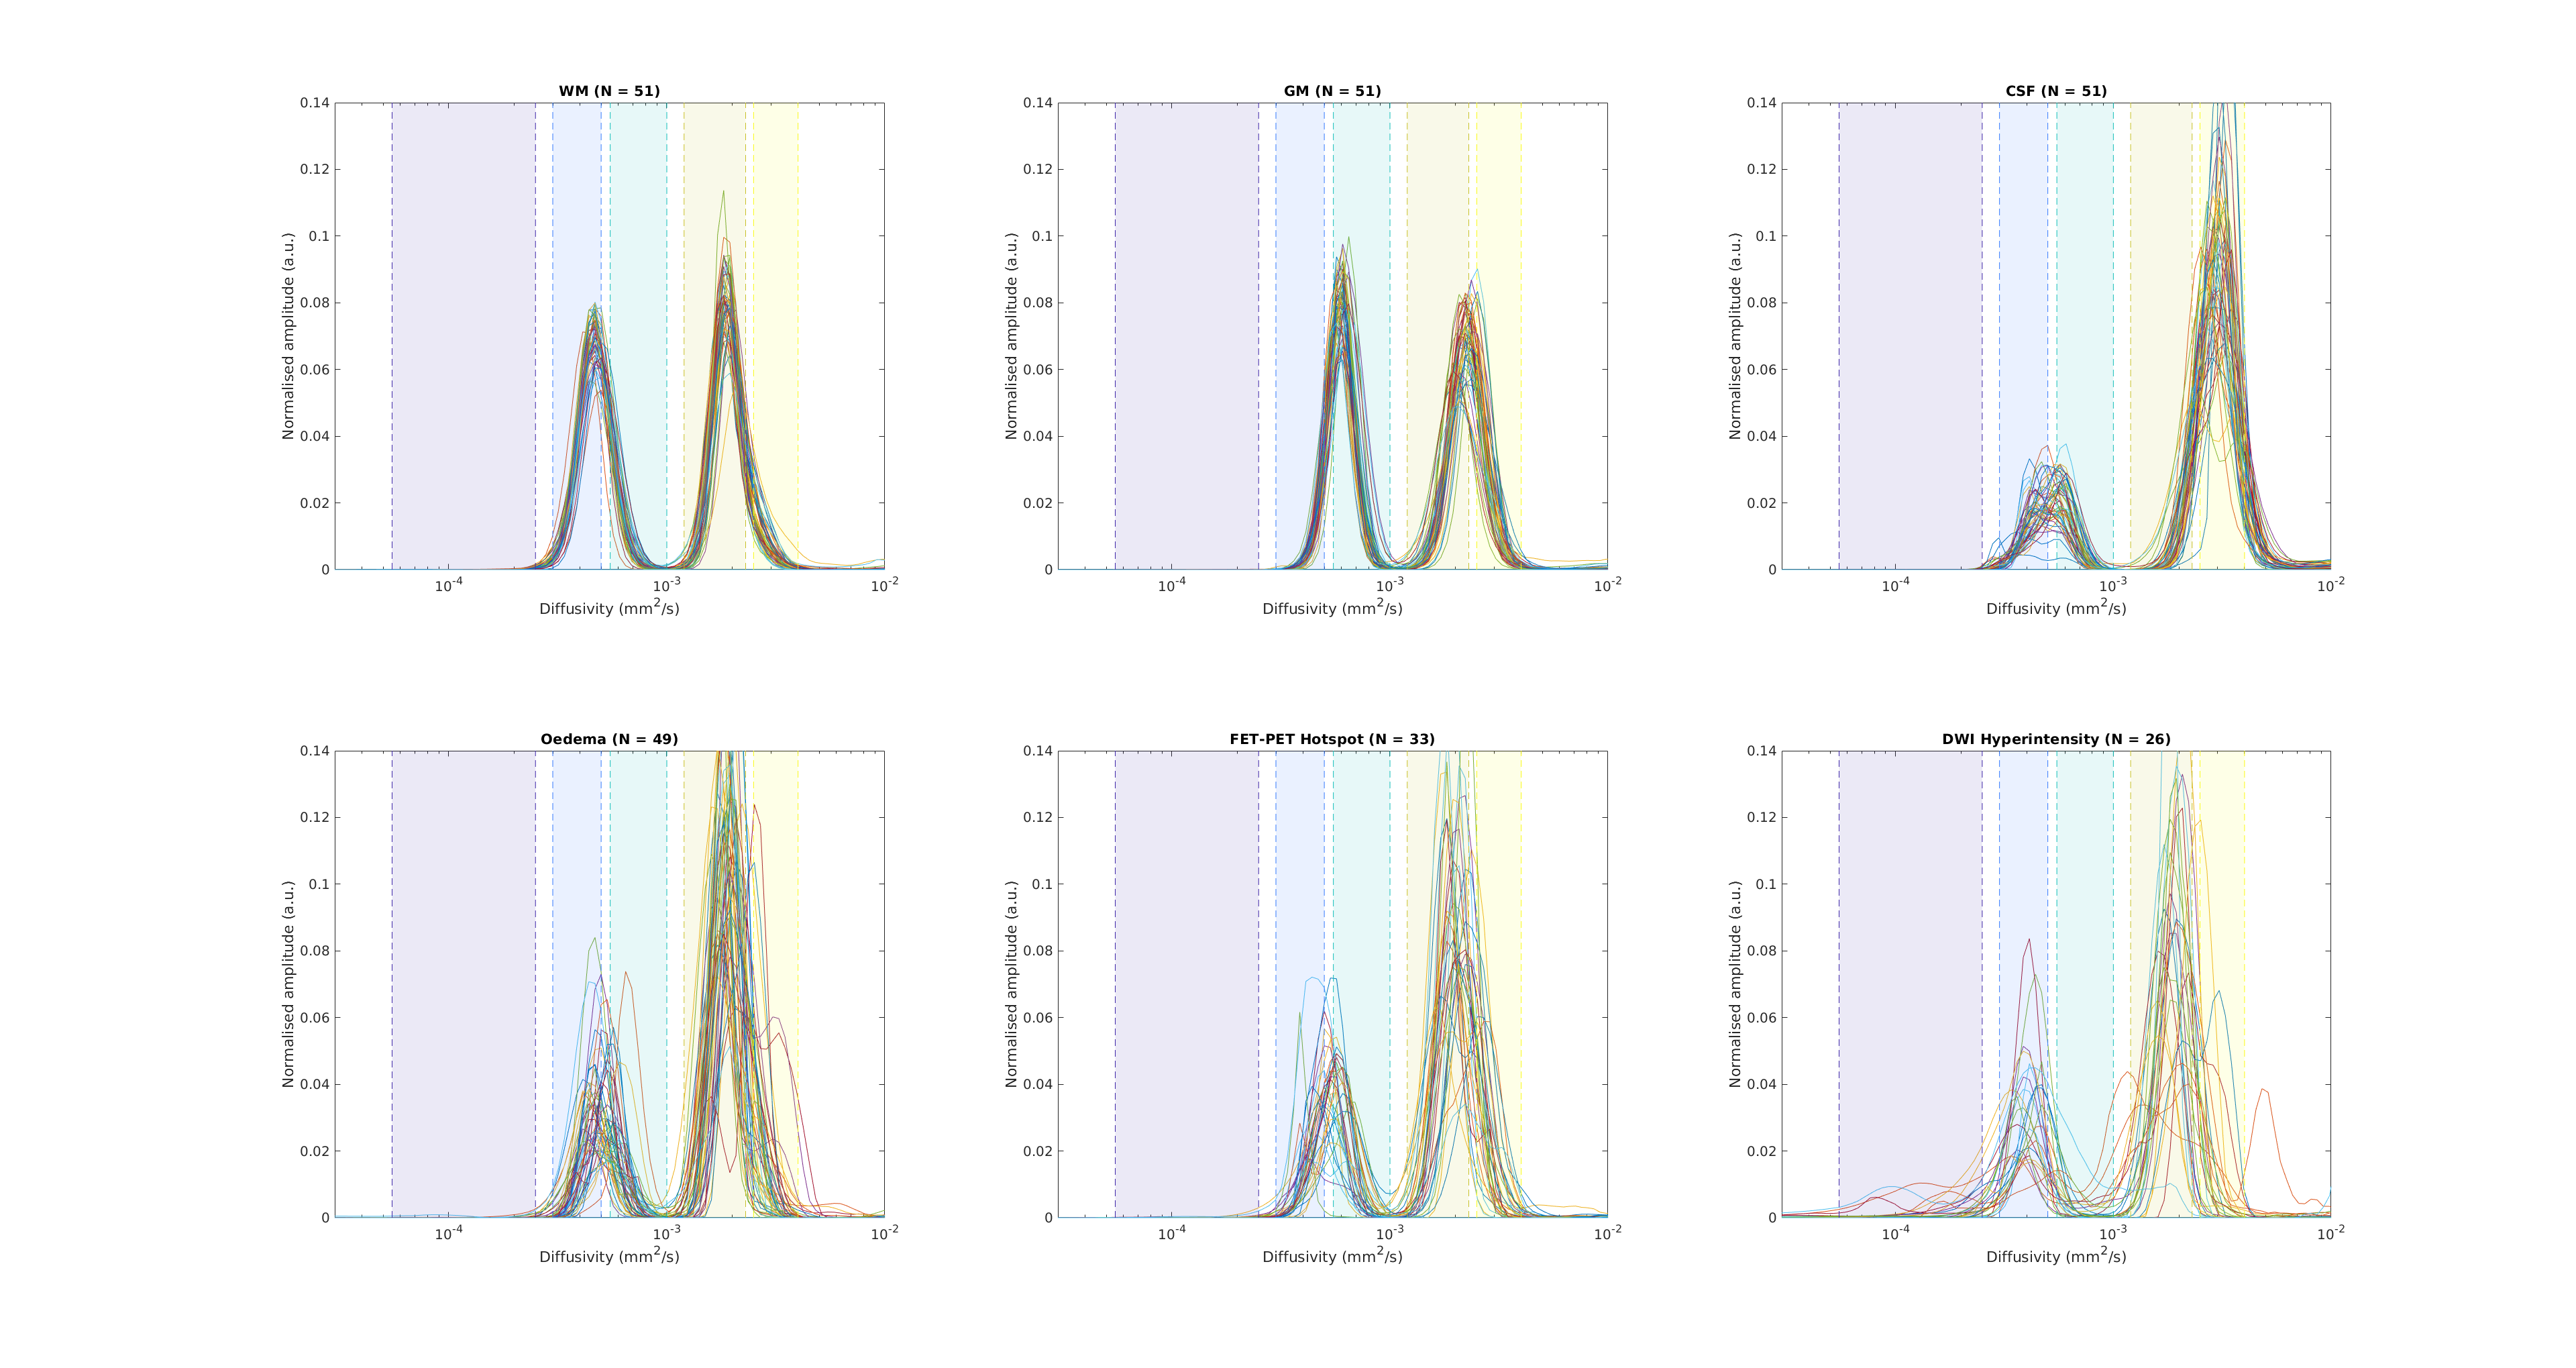
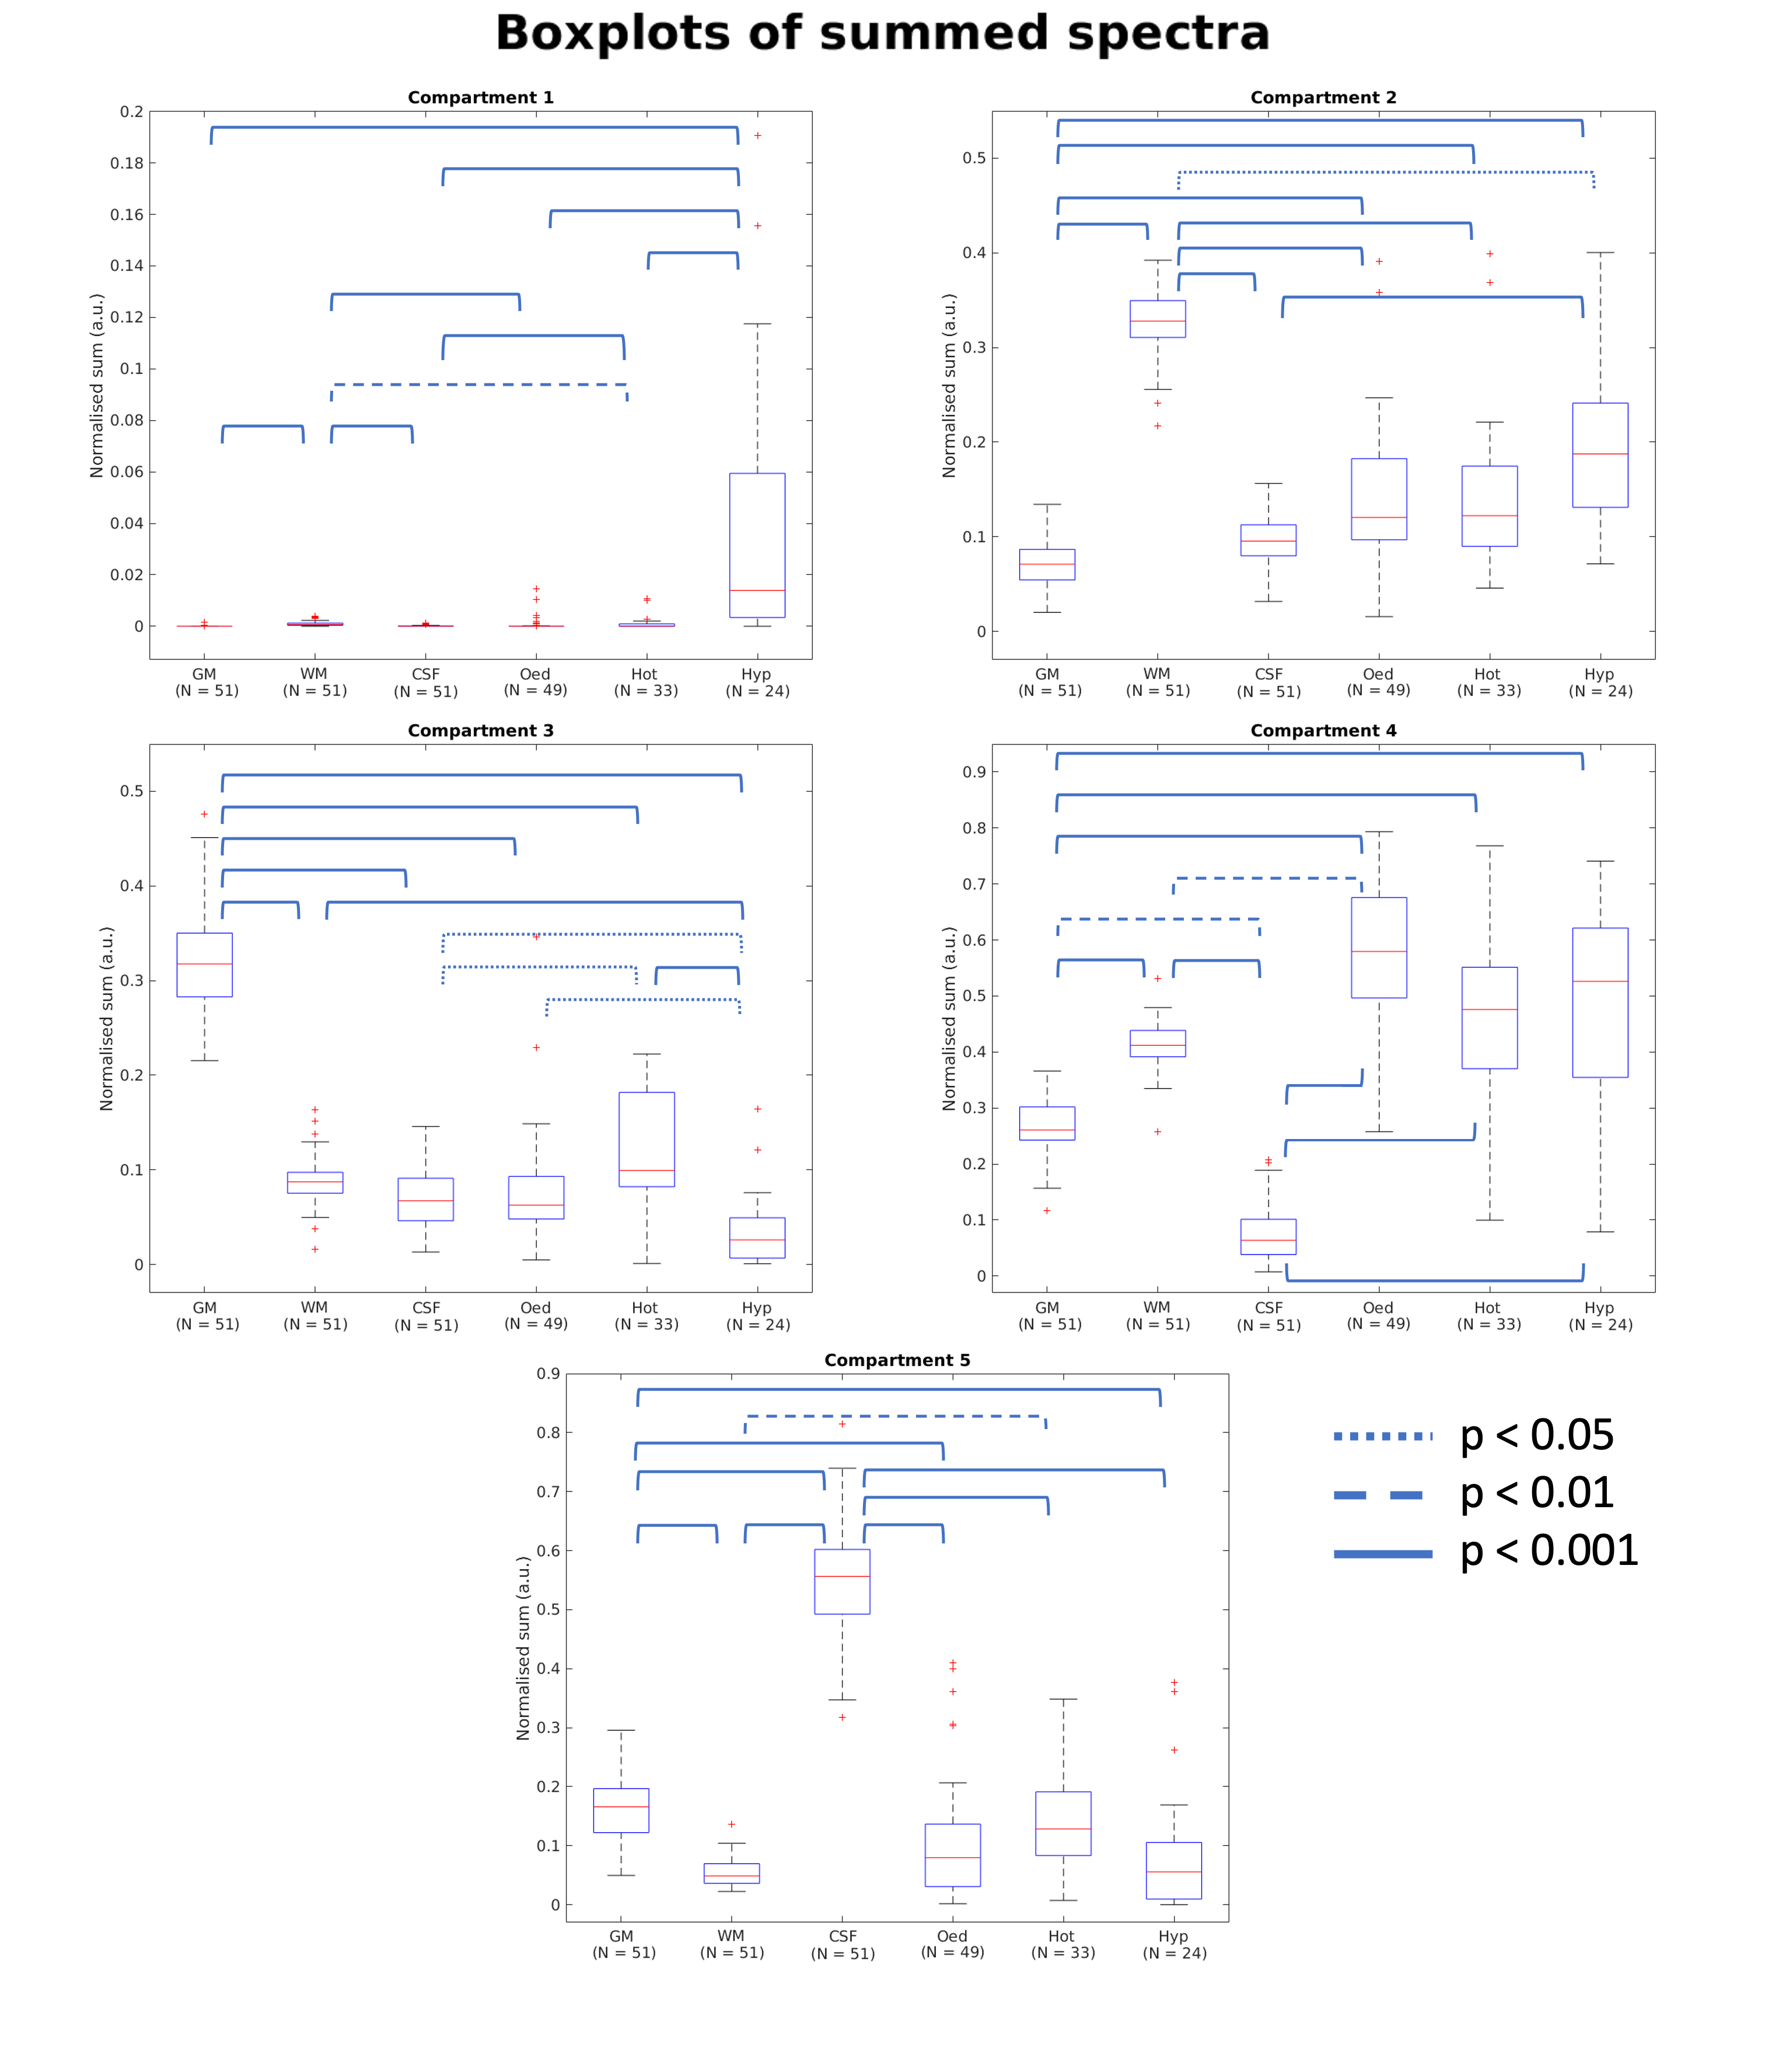
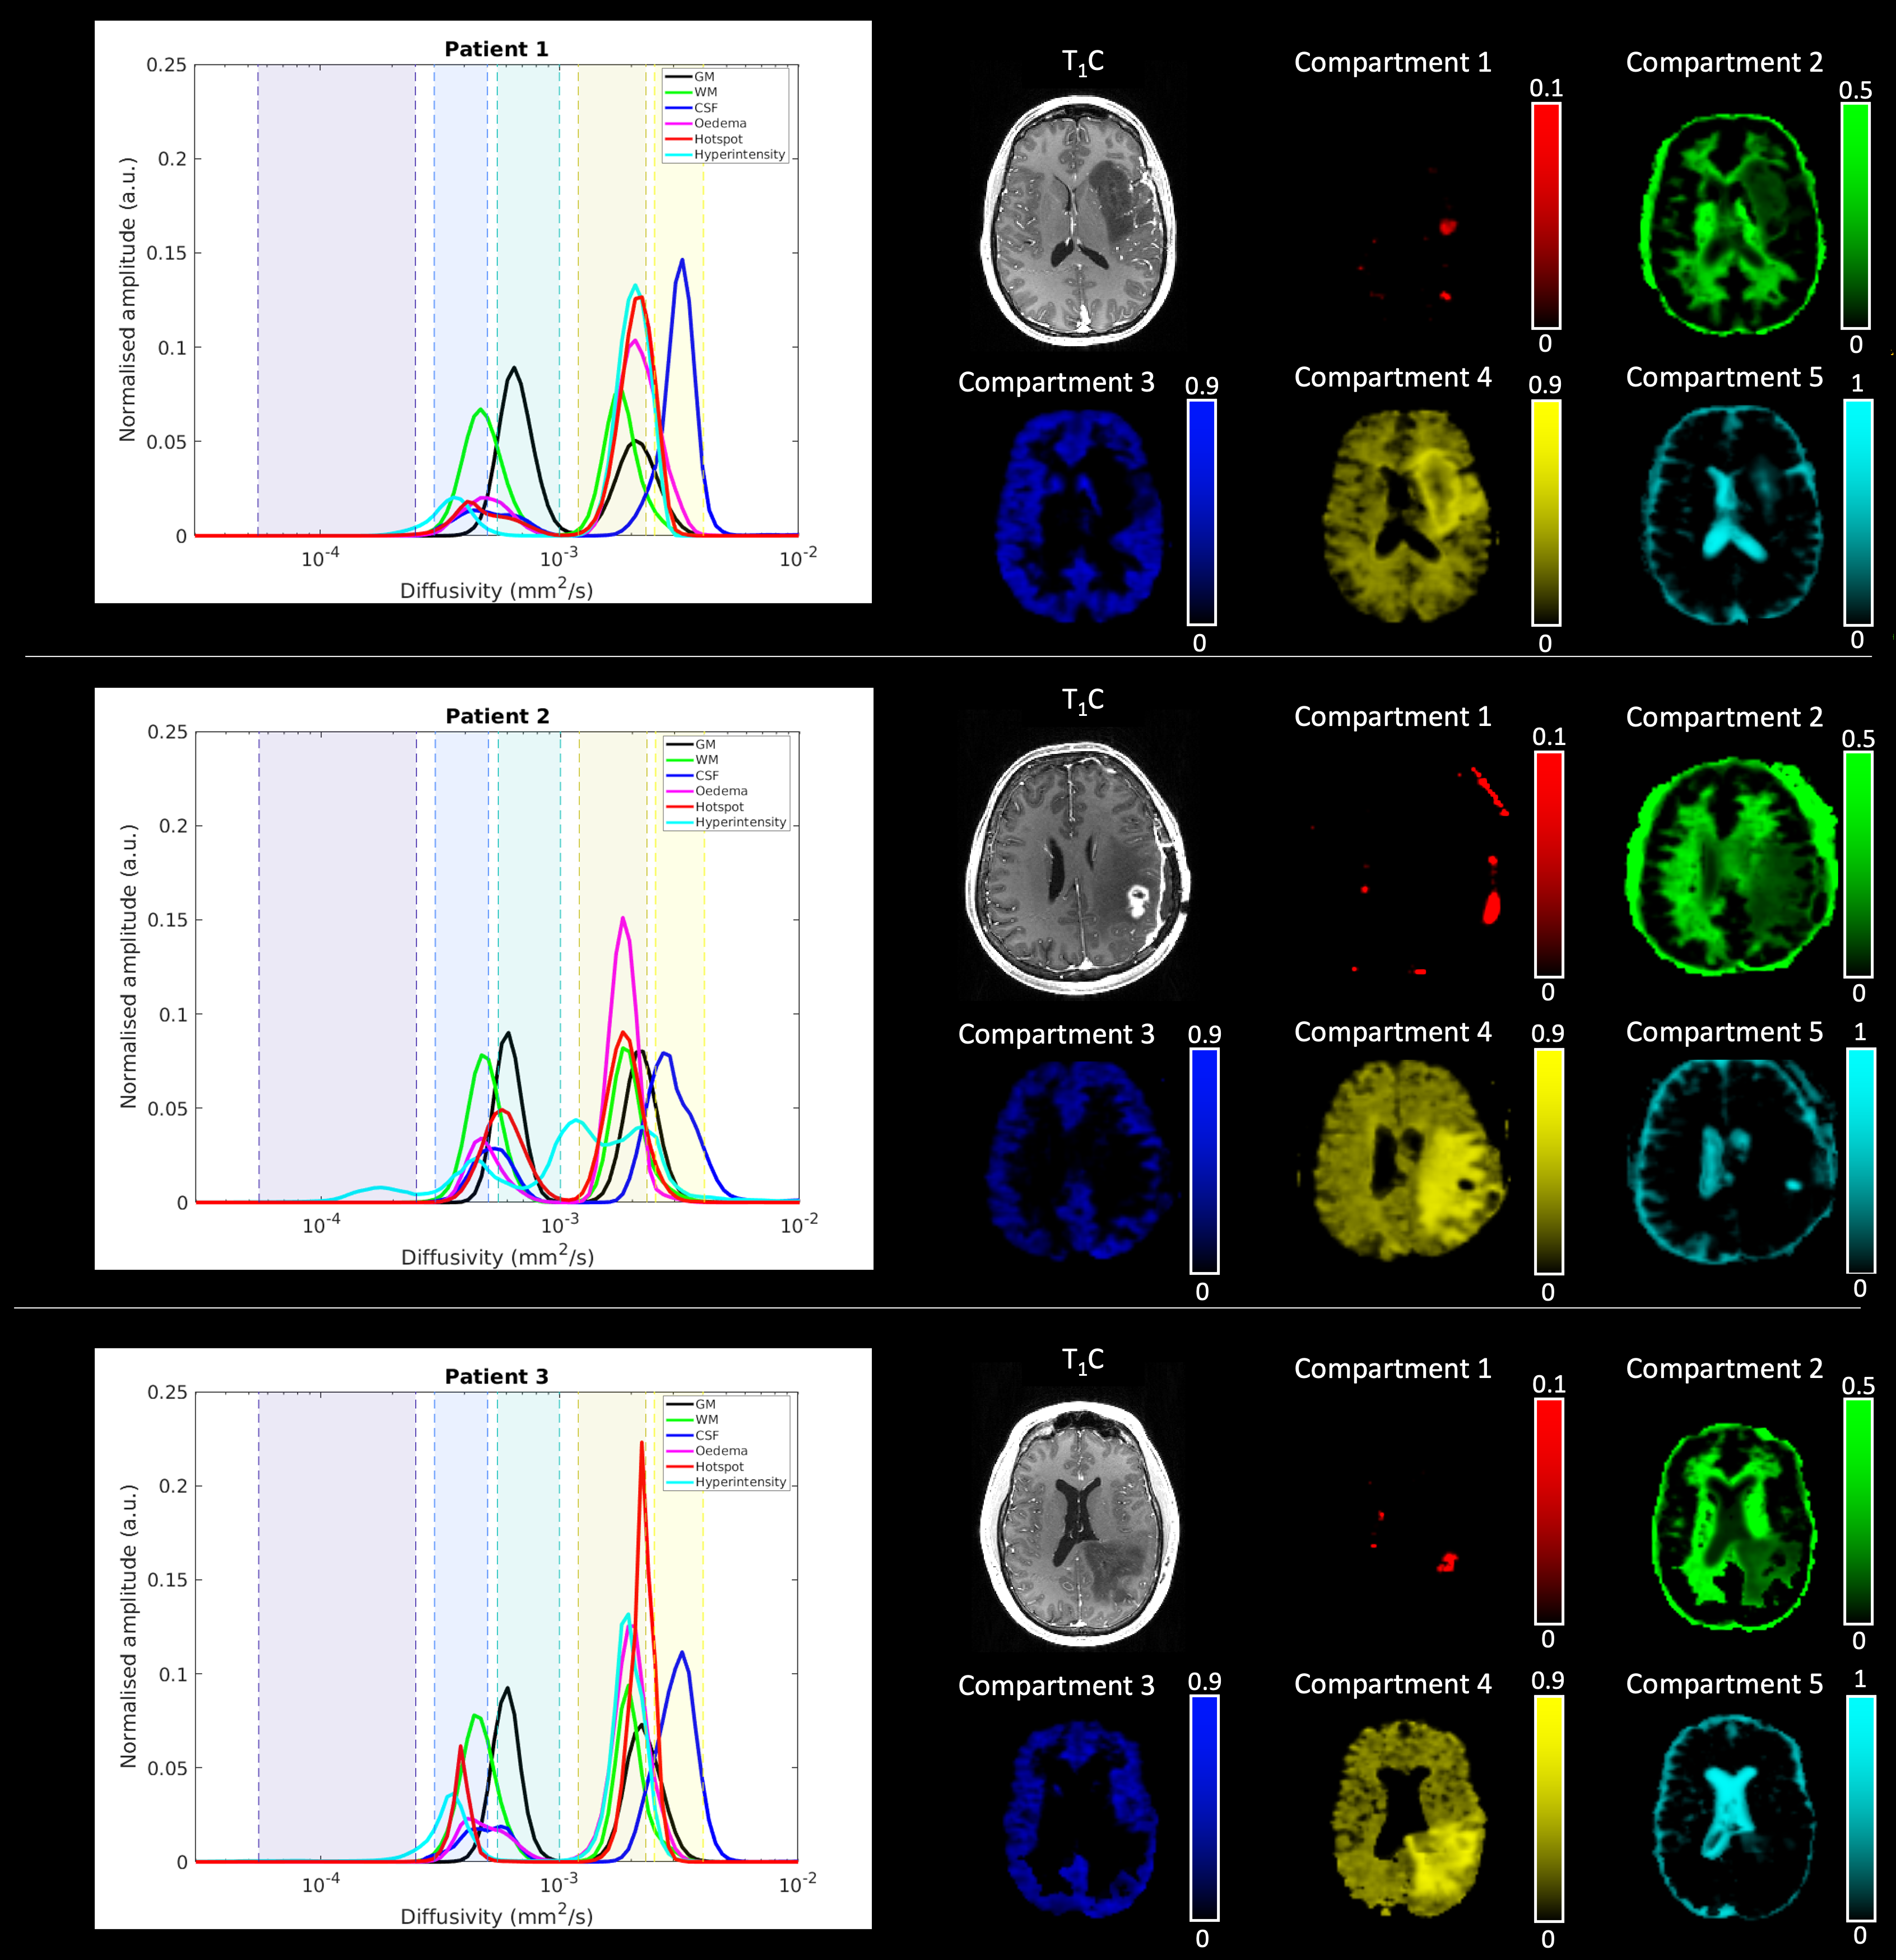
Among the 51 scanning sessions, 24 (47%) showed dMRI hyperintense lesions, 34 (67%) showed FET hotspot, and 16 (31%) sessions had both dMRI hyperintense lesions and FET-PET hotspot. The dMRI hyperintense lesions can be further categorised by their FET-PET uptake: 10 (42%) sessions showed increased FET-uptake dynamics in the region of the dMRI lesion, 10 (42%) sessions showed physiological FET-uptake dynamics in the dMRI lesion, and four (16%) sessions showed very little FET uptake. Examples for each group are shown in Fig.1.The average NNLS spectra for each tissue are presented in Fig. 2. The boxplots with the summed amplitudes in each compartment and their respective Kruskal-Wallis results are shown in Figure 3. Compartment 1 differentiates the dMRI hyperintense lesion from other tissue classes. Fig. 4 shows the fractions of different components for the 3 example patients of Fig. 1.
Tumor-associated hyperintensities arefound to be a common occurrence (roughly 50% of the time) and are shown by NNLS decomposition to display highly restricted diffusion. The mechanism is unknown, but possibly associated with the structure of the stiff and aligned extracellular matrix associated with cell migration14. Tumour tissue identified by PET is found to have a faster slow component diffusion, possibly due to faster intra-extracellular water exchange5,6.
Acknowledgements
We are grateful to Professor Langen and Dr. Stoffels for providing access to patients and facilitating data acquisition.References
[1] Le Bihan D, Breton E, Lallemand D, Aubin ML, Vignaud J, Laval-Jeantet M. Separation of diffusion and perfusion in intravoxel incoherent motion MR imaging. Radiology. 1988 Aug;168(2):497-505. doi: 10.1148/radiology.168.2.3393671. PMID: 3393671.
[2] Mulkern RV, Gudbjartsson H, Westin CF, Zengingonul HP, Gartner W, Guttmann CR, Robertson RL, Kyriakos W, Schwartz R, Holtzman D, Jolesz FA, Maier SE. Multi-component apparent diffusion coefficients in human brain. NMR Biomed. 1999 Feb;12(1):51-62
[3] Beaulieu C. The basis of anisotropic water diffusion in the nervous system - a technical review. NMR Biomed. 2002 Nov-Dec;15(7-8):435-55. doi: 10.1002/nbm.782. PMID: 12489094
[4] F. Grinberg, E. Farrher, J. Kaffanke, A.M. Oros-Peusquens, N.J. Shah. Non-Gaussian diffusion in human brain tissue at high b-factors as examined by a combined diffusion kurtosis and biexponential diffusion tensor analysis. NeuroImage 2011, 1087-1102, https://doi.org/10.1016/j.neuroimage.2011.04.050.
, , , et al. Metabolic activity diffusion imaging (MADI): I. Metabolic, cytometric modeling and simulations. NMR in Biomedicine. 2023; 36(1):e4781. doi:10.1002/nbm.4781
[6] Springer CS Jr, Baker EM, Li X, et al. Metabolic activity diffusion imaging (MADI): II. Noninvasive, high-resolution human brain mapping of sodium pump flux and cell metrics. . NMR in Biomedicine. 2023; 36(1):e4782. doi: 10.1002/nbm.4782.
[7] Papadopoulos MC, Saadoun S, Binder DK, Manley GT, Krishna S, Verkman AS. Molecular mechanisms of brain tumor edema. Neuroscience. 2004;129(4):1011-20. doi: 10.1016/j.neuroscience.2004.05.044. PMID: 15561416.
[8] Vera C. Keil, Burkhard Mädler, Gerrit H. Gielen, Bogdan Pintea, Kanishka Hiththetiya, Alisa R. Gaspranova, Jürgen Gieseke, Matthias Simon, Hans H. Schild, and Dariusch R. Hadizadeh. Intravoxel incoherent motion mri in the brain: Impact of the fitting model on perfusion fraction and lesion differentiability. J. Magn. Reson. Imaging, 46(4): 1187–1199, October 2017. ISSN 1053-1807. doi: 10.1002/jmri.25615. https://doi.org/10.1002/jmri.25615.
[9] Sofie Rahbek, Kristoffer H. Madsen, Henrik Lundell, Faisal Mahmood, Lars G. Hanson,
Data-driven separation of MRI signal components for tissue characterization. JMR 2021, https://doi.org/10.1016/j.jmr.2021.107103.
[10] Alberto De Luca, Alexander Leemans, Alessandra Bertoldo, Filippo Arrigoni, and Martijn Froeling. A robust
deconvolution method to disentangle multiple water pools in diffusion mri. NMR in biomedicine, 31:e3965, Nov 2018.
[11] Oliver Bähr, Patrick N. Harter, Lutz M. Weise, Se-Jong You, Michel Mittelbronn, Michael W. Ronellenfitsch, Johannes Rieger, Joachim P. Steinbach, and Elke Hattingen. Sustained focal antitumor activity of bevacizumab in recurrent glioblastoma. Neurology, 83(3):227, July 2014. doi: 10.1212/WNL.0000000000000594
[12] Peter S. LaViolette, Nikolai J. Mickevicius, Elizabeth J. Cochran, Scott D. Rand, Jennifer Connelly, Joseph A.
Bovi, Mark G. Malkin, Wade M. Mueller, and Kathleen M. Schmainda. Precise ex vivo histological validation of
heightened cellularity and diffusion-restricted necrosis in regions of dark apparent diffusion coefficient in 7 cases of
high-grade glioma. Neuro-oncology, 16:1599–606, Dec 2014
[13] Pradeep Goyal, Mary Tenenbaum, Sonali Gupta, Puneet S. Kochar, Alok A. Bhatt, Manisha Mangla, Yogesh Kumar,
and Rajiv Mangla. Survival prediction based on qualitative mri diffusion signature in patients with recurrent high grade glioma treated with bevacizumab. Quantitative Imaging in Medicine and Surgery; Vol 8, No 3 (April 30, 2018): Quantitative Imaging in Medicine and Surgery, 2018. URL https://qims.amegroups.org/article/view/19278
[14] Petrova, V., Annicchiarico-Petruzzelli, M., Melino, G. et al. The hypoxic tumour microenvironment. Oncogenesis 7, 10 (2018). https://doi.org/10.1038/s41389-017-0011-9
Figures