3495
Apparent Diffusion Coefficient Measures of Metabolite in HIV: A pilot study1Radiological Sciences, University of California, Los Angeles, Los Angeles, CA, United States, 2Medicine, University of California, Los Angeles, Los Angeles, CA, United States, 3Division of HIV Medicine, Lundquist Institute at Harbor-UCLA Medical Center, Torrance, CA, United States, 4School of Nursing, University of California, Los Angeles, Los Angeles, CA, United States, 5College of Health and Human Sciences, Purdue University, West Lafayette, IN, United States
Synopsis
Keywords: DWI/DTI/DKI, Neurodegeneration, HIV
Motivation: Neurocognitive impairment in HIV and compromised neuronal integrity are characterized by varying metabolite levels. However, ADC values of metabolites have not been reported.
Goal(s): To measure the metabolite ADC values at multiple locations in the brain and compare between HIV+ and healthy control groups.
Approach: Use a diffusion weighted radial echo planar spectroscopic imaging technique with single-shot diffusion trace-weighted scheme to measure the metabolite ADC values.
Results: Statistically significant variations were observed in Water and tCr ADCs. Further analysis of metabolite ratios showed significantly reduced tNAA and increased tCr and tCho in HIV patients compared to HC.
Impact: Metabolite ADC values in HIV brain compared to HC is demonstrated using single-shot diffusion trace-weighted DW-REPSI. Statistically significant variations were observed in Water and tCr ADCs. Metabolite ratios showed significantly reduced tNAA and increased tCr and tCho in HIV patients.
Introduction
Diffusion-weighted magnetic resonance spectroscopy (DW-MRS) is a non-invasive imaging technique that combines magnetic resonance spectroscopy (MRS) with diffusion-weighted imaging (DWI). It provides unique cell-specific and compartment-specific microstructural information based on the diffusion properties of intracellular metabolites in brain tissue. DWI (diffusion-weighted imaging) can highlight microscopic modifications by the quantitative analysis of apparent diffusion coefficient (ADC) (1-4, 9). A recent study has shown that ADC was significantly increased in patients with neurocognitive impairment compared to controls, and decreased in patients after intensification of ARV treatment (5). Neurocognitive impairment associated with HIV is generally characterized by increased choline (Ch) and myo-inositol (mI) levels and compromised neuronal integrity signaled by reduced N-acetylaspartate (NAA) levels (6-7). However, ADC values of different metabolites have not been reported in HIV patients. In this study, we use a diffusion weighted radial echo planar spectroscopic imaging (DW-REPSI) technique with single-shot diffusion trace-weighted scheme to measure the metabolite ADC values at multiple locations in the brain and compare between HIV+ and healthy control groups.Materials and Methods
We investigated 11 HIV-infected participants (Age: 51.25±9) and 11 healthy controls (HC) (Age: 39±18). The DW-REPSI data was acquired using a 3T scanner (Prisma, Siemens Healthcare, Munich, Germany) with a 16-channel receive head coil. In vivo acquisitions were performed with TE = 144 ms and TR = 2.25 s, field-of-view (FOV) = 320×320 mm2, matrix size = 32×32 and voxel resolution = 1×1×2 cm3. Non-water suppressed (NWS) data was acquired for coil sensitivity estimation, eddy current phase correction, and for computing water ADC maps. T1-weighted localization MRI images were acquired with TR/TE = 250 ms/2.49 ms, FOV = 240×240 mm2, voxel resolution = 1.25×1.25×4 mm3 with 35 slices. Two b-values were acquired: low b-value at 51 s/mm2 (6 and 1 average for water-suppressed and NWS) and a high b-value at 1,601 s/mm2 (13 and 2 average for water-suppressed and NWS), corresponding to DSG amplitudes of 11 mT/m and 64 mT/m, respectively. The total scan time was approximately 45 minutes. Non-uniform FFT (NUFFT) (17) was used for reconstruction and the spectra were quantified using LC Model. Localization images were used to segment gray and white matter and the voxel vise ADCs were computed for gray and white matter. In addition to ADCs, we also computed the metabolite ratios with respect to a sum of total Creatine (tCr), total Choline (tCho) and total NAA (tNAA) using the low b-value spectrum. A 2-sample t-test with a significance level of p<0.05 was used for statistical analysis of the data.Results
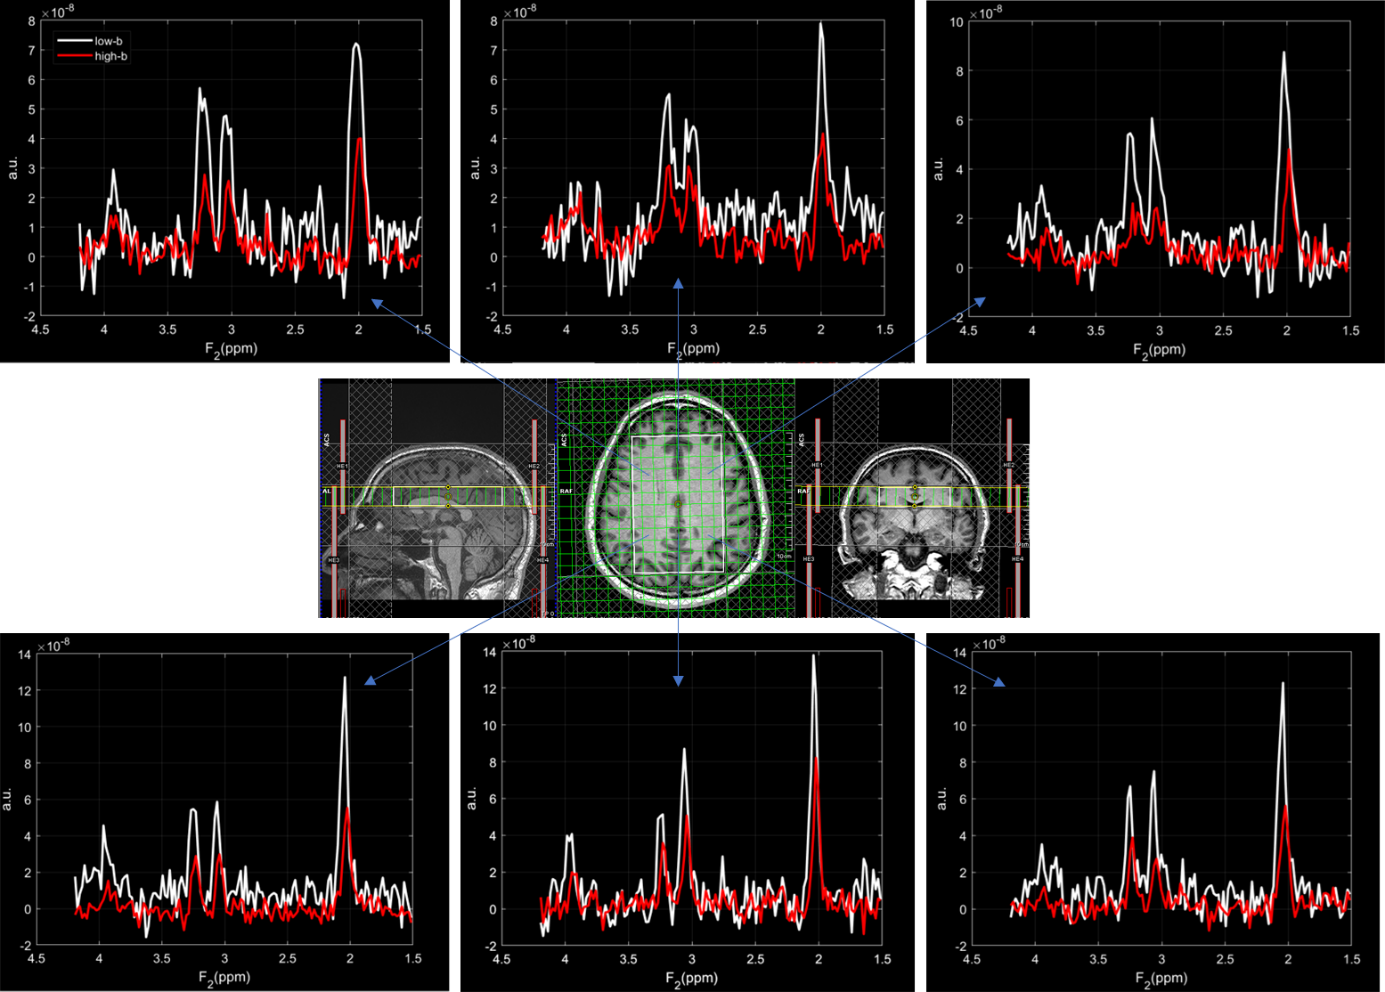
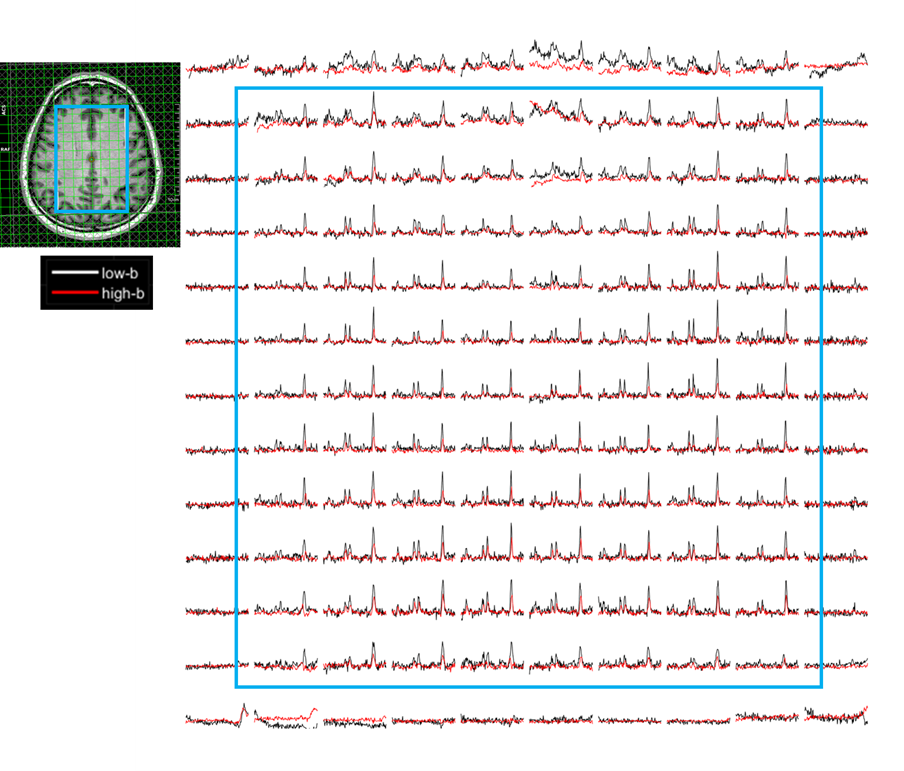
Figure 1 shows the localization image and a set of extracted images from white and gray matter locations. Both low b-value and high b-value plots are overlaid in the same plot. Figure 2 shows the multivoxel spectra from within the entire volume-of-interest(VOI). Black color plots represent low b-value and red color plots represent high b-value. Mean and standard deviations of ADC values from different locations for tCr, tCho and tNAA are shown in table 1. Locations are RACC: right anterior cingulate cortex, LACC: left anterior cingulate cortex, RSP: right superior precuneus, LSP: left superior precuneus, RACR: right anterior corona radiata, RPCR: right posterior corona radiata, LACR: left anterior corona radiata and LPCR: left posterior corona radiata. Corresponding metabolite ratios from low-b-value spectrum for tCr, tCho and tNAA with respect to the sum of the three is shown in table 2. In both tables the regions with significant difference between HIV and HC are bolded and italicized.Discussion
Significant differences in the ADC values of water and tCr were observed between HIV and HC groups. The ADC values were significantly elevated in HIV in the gray matter regions RACC and LACC. This agrees with previously reported trend of water ADC in HIV (10). In LPCR, the water ADC was significantly reduced in HIV compared to HC. However, it has been reported that the presence of HIV associated neurocognitive disorder could result in non-uniform structural patterns between patients, and can show very different individual results (8). Therefore, this need to be further analyzed on a larger cohort of subjects. Metabolites ratios showed significantly reduced tNAA, as opposed to increased tCr and tCho in HIV compared to HC. This could be due to the neuronal injury resulting from HIV infection.Conclusion
Metabolite ADC values in HIV brain compared to HC is demonstrated in the study using single-shot diffusion trace-weighted DW-REPSI. Statistically significant variations were observed in Water and tCr ADCs. Further analysis of metabolite ratios showed significantly reduced tNAA and increased tCr and tCho in HIV patients compared to HC.Acknowledgements
Authors acknowledge grant support from NIH/NIMH: (1R21MH125349-02).References
1. Palombo M, Shemesh N, Ronen I, Valette J. Insights into brain microstructure from in vivo DW-MRS. NeuroImage. 2018;182:97-116.
2. Ligneul C, Palombo M, Hernández-Garzón E, et al. Diffusion-weighted magnetic resonance spectroscopy enables cell-specific monitoring of astrocyte reactivity in vivo. NeuroImage. 2019;191:457-469.
3. Harada M, Uno M, Hong F, Hisaoka S, Nishitani H, Matsuda T. Diffusion-weighted in vivo localized proton MR spectroscopy of human cerebral ischemia and tumor. NMR in Biomedicine. 2002;15(1):69-74.
4. Zheng DD, Liu ZH, Fang J, Wang XY, Zhang J. The Effect of Age and Cerebral Ischemia on Diffusion-Weighted Proton MR Spectroscopy of the Human Brain. AJNR Am J Neuroradiol. 2012;33(3):563-568.
5. Dinoso JB, Kim SY, Wiegand AM, Palmer SE, Gange SJ, Cranmer L, O'shea A, Callender M, Spivak A, Brennan T, Kearney MF. Treatment intensification does not reduce residual HIV-1 viremia in patients on highly active antiretroviral therapy. Proceedings of the National Academy of Sciences. 2009 Jun 9;106(23):9403-8.
6. Chelala L, O'Connor EE, Barker PB, Zeffiro TA. Meta-analysis of brain metabolite differences in HIV infection. NeuroImage: Clinical. 2020 Jan 1;28:102436.
7. Iqbal Z, Wilson NE, Keller MA, Michalik DE, Church JA, Nielsen-Saines K, Deville J, Souza R, Brecht ML, Thomas MA. Pilot assessment of brain metabolism in perinatally HIV-infected youths using accelerated 5D echo planar J-resolved spectroscopic imaging. PloS one. 2016 Sep 13;11(9):e0162810.
8. Stubbe-Drger B, Deppe M, Mohammadi S, Keller SS, Kugel H, Gregor N, Evers S, Young P, Ringelstein EB, Arendt G, Knecht S. Early microstructural white matter changes in patients with HIV: a diffusion tensor imaging study. BMC neurology. 2012 Dec;12:1-0.
9. Saucedo A. Radial Echo Planar Spectroscopic Imaging: Acceleration and Applications for Diffusion-Weighted Acquisitions (Doctoral dissertation, University of California, Los Angeles).
10. Cloak CC, Chang L, Ernst T. Increased frontal white matter diffusion is associated with glial metabolites and psychomotor slowing in HIV. Journal of neuroimmunology. 2004 Dec 1;157(1-2):147-52.
Figures