3493
Exploring the Potential Applications of Relaxation-Diffusion Spectrum Imaging in Neurosurgical Studies1School of Computer Science and Technology, Nanjing University of Science and Technology, Nanjing, China, 2Department of Radiology, Union Hospital, Tongji Medical College, Huazhong University of Science and Technology, Wuhan, China, 3Hubei Province Key Laboratory of Molecular Imaging, Wuhan, China, 4Philips Healthcare, Wuhan, China
Synopsis
Keywords: Microstructure, Microstructure
Motivation: Relaxation-Diffusion Spectrum Imaging (RDSI) characterizes tissue apparent relaxation coefficients and factors out the effects of intra-voxel orientation heterogeneity. However, it needs to be clarified how RDSI has potential in neurosurgical research.
Goal(s): We aim to investigate how RDSI can be conducive to characterizing tissue abnormalities in various neurosurgical patients.
Approach: We presented two RDSI-derived indices, R2RF and RICR, to characterize tissue abnormalities. We examined the indices with an in vivo dataset, acquired using a clinical scanner, involving eight different health conditions.
Results: R2RF and RICR have potential in lesion grading and treatment response evaluation.
Impact: Our study promises to improve its clinical applicability and enhance our understanding of glioma biology and treatment response.
Introduction
Relaxation-diffusion MRI (rdMRI) is an advanced technique that combines measurements of tissue relaxation times and diffusion imaging to investigate the microstructural and physiological characteristics of tissues1–4. With rdMRI, Relaxation-Diffusion Spectrum Imaging (RDSI)5 was recently provided to characterize tissue apparent relaxation coefficients for a spectrum of diffusion length scales and factor out the effects of intra-voxel orientation heterogeneity. RDSI caters to heterogeneous tissue microstructure for the direct estimation of relaxation-independent volume fractions and compartment-specific relaxation times. However, it needs to be clarified how RDSI has potential in neurosurgical research, including tumor grading, edema assessment, necrotic areas, and treatment response assessment. Our study aims to examine the model with an in vivo dataset acquired using a clinical scanner involving eight different health conditions. We will demonstrate how RDSI can delineate heterogeneous tissue microstructure and provide information that is conducive to characterizing tissue abnormalities.Materials and Methods
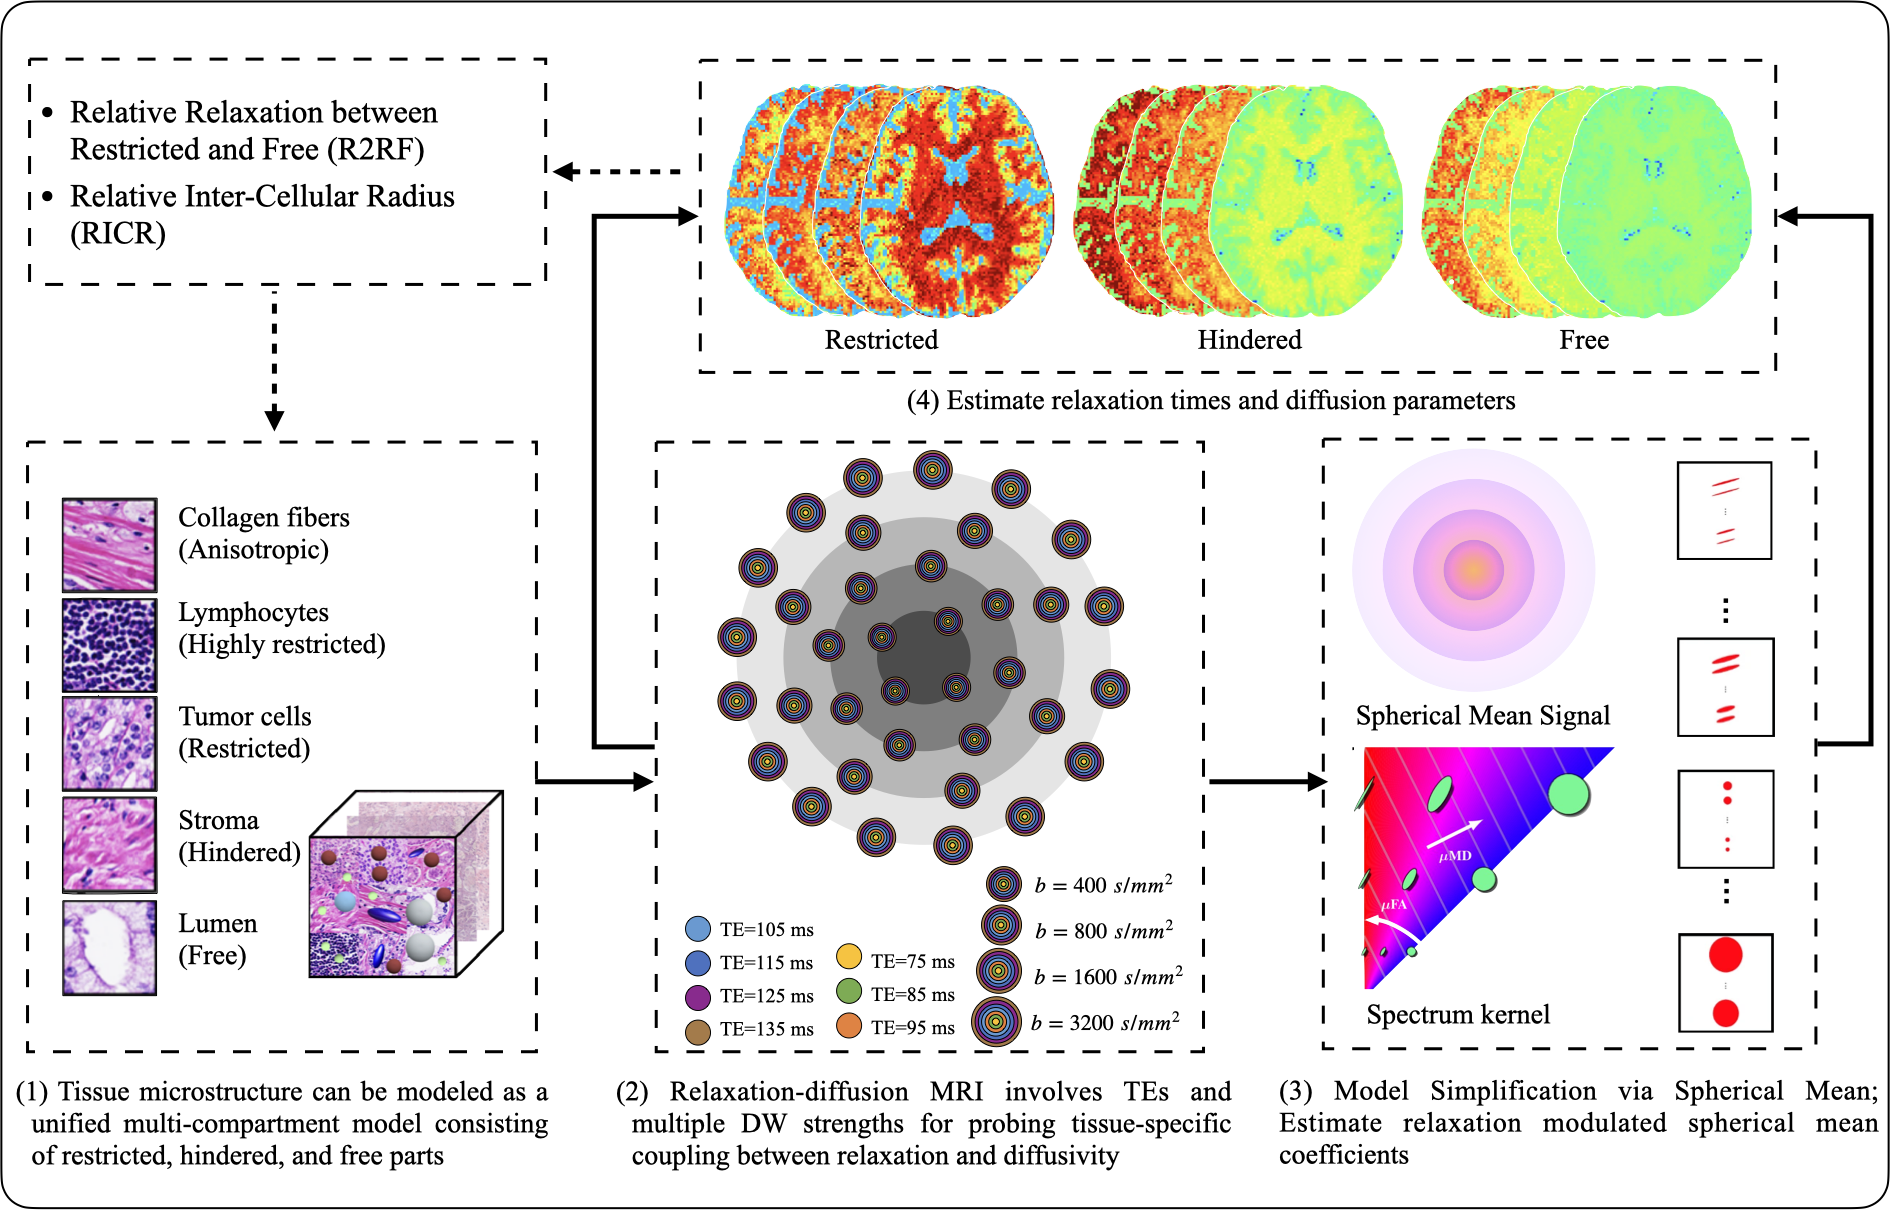
Dataset: A high-quality rdMRI dataset from a cohort of 8 neurosurgical patients with different types (lesions, including glioma, meningioma, diffuse large B-cell, multiple sclerosis, cortical cerebral infarction, and brain abscess) was acquired using a Philips 3T MRI scanner. The rdMRI data is scanned using a multi-shell, multi-echo dMRI sequence with fixed diffusion time, [4, 4, 8, 8, 16] diffusion-encoding directions at each of b=[0, 400, 800, 1600, 3200] s/mm2 respectively, TE=[75, 85, 95, 105, 115, 125, 135] ms, TR=4000 ms, 1.5 mm isotropic voxel size. Each rdMRI scan is well-processed for artifact and distortion corrections using a well-designed rdMRI-specific processing pipeline.Methods: RDSI was implemented using https://github.com/dryewu/RDSI to characterize tissue apparent relaxation coefficients for a spectrum of diffusion length scales (Fig. 1). Then, RDSI allows for the direct estimation of non-T2w volume fractions ($$$w_{D_r}$$$, $$$w_{D_h}$$$, and $$$w_{D_f}$$$) and T2 relaxation times ($$$T_{2r}$$$, $$$T_{2h}$$$, and $$$T_{2f}$$$) of three tissue compartments (restricted, hindered, and free).
The cell membrane acts as a barrier, limiting the movement of water molecules into and out of the cell. However, if the cell is smaller or has a longer relaxation time, collisions with the cell membrane can cause a mismatch between the actual and apparent diffusion6. Here, we propose a new measurement called Relative Relaxation between Restricted and Free (R2RF) $$$\text{R2RF} = \frac{T_{2r}}{T_{2f}}$$$, which can characterize the relative restriction of water molecule diffusion inside the cell's membrane.
The large fraction of free and hindered water in areas of necrosis and edema. RDSI allows isolating areas of truly restricted diffusion by separating and removing the hindered diffusion signal and offers a more direct measure of tumor cells. Based on the non-T2w volume fractions, axonal morphology indices were derived based on7,8 to compute the Relative Inter-Cellular Radius (RICR). $$$\text{RICR} =\text{cov}((\epsilon(\delta,\Delta)w_{D_h}\lambda_{\parallel}\lambda_{\perp})^{1/4})\equiv\text{cov}((w_{D_h}\lambda_{\parallel}\lambda_{\perp})^{1/4}),\quad 1 \prec \frac{\lambda_{\parallel}}{\lambda_{\perp}} \prec \phi^2$$$where $$$\epsilon \succ 0$$$ is a pulse scale that only depends on the pulse width $$$\delta$$$ and diffusion time $$$\Delta$$$ of the diffusion gradients. where $$$D_h$$$ is parameterized by parallel diffusivity $$$\lambda_\parallel$$$ and perpendicular diffusivity $$$\lambda_\perp$$$ for the hindered compartments. RICR is independent on $$$\epsilon$$$. $$$\phi$$$ is the geometric tortuosity9.
Results and Discussion
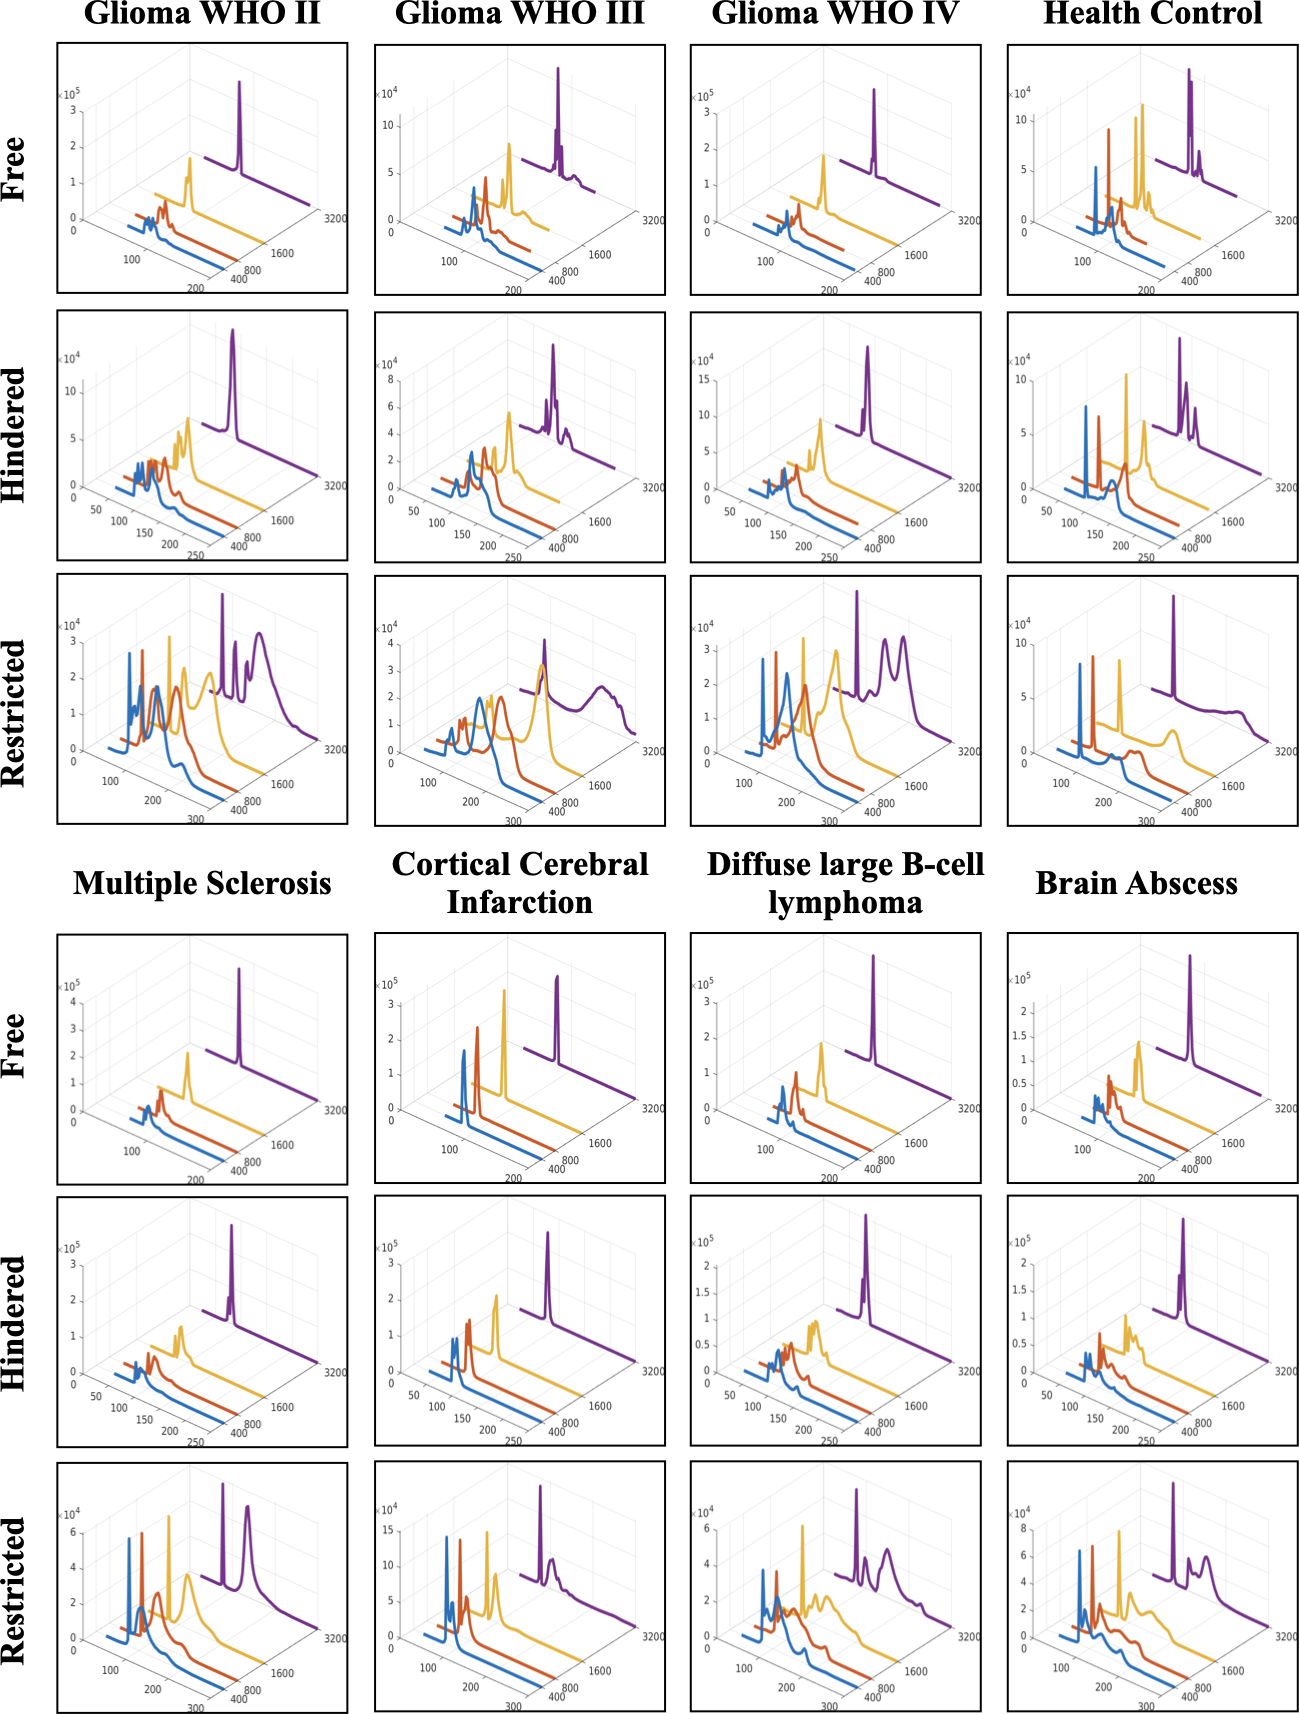
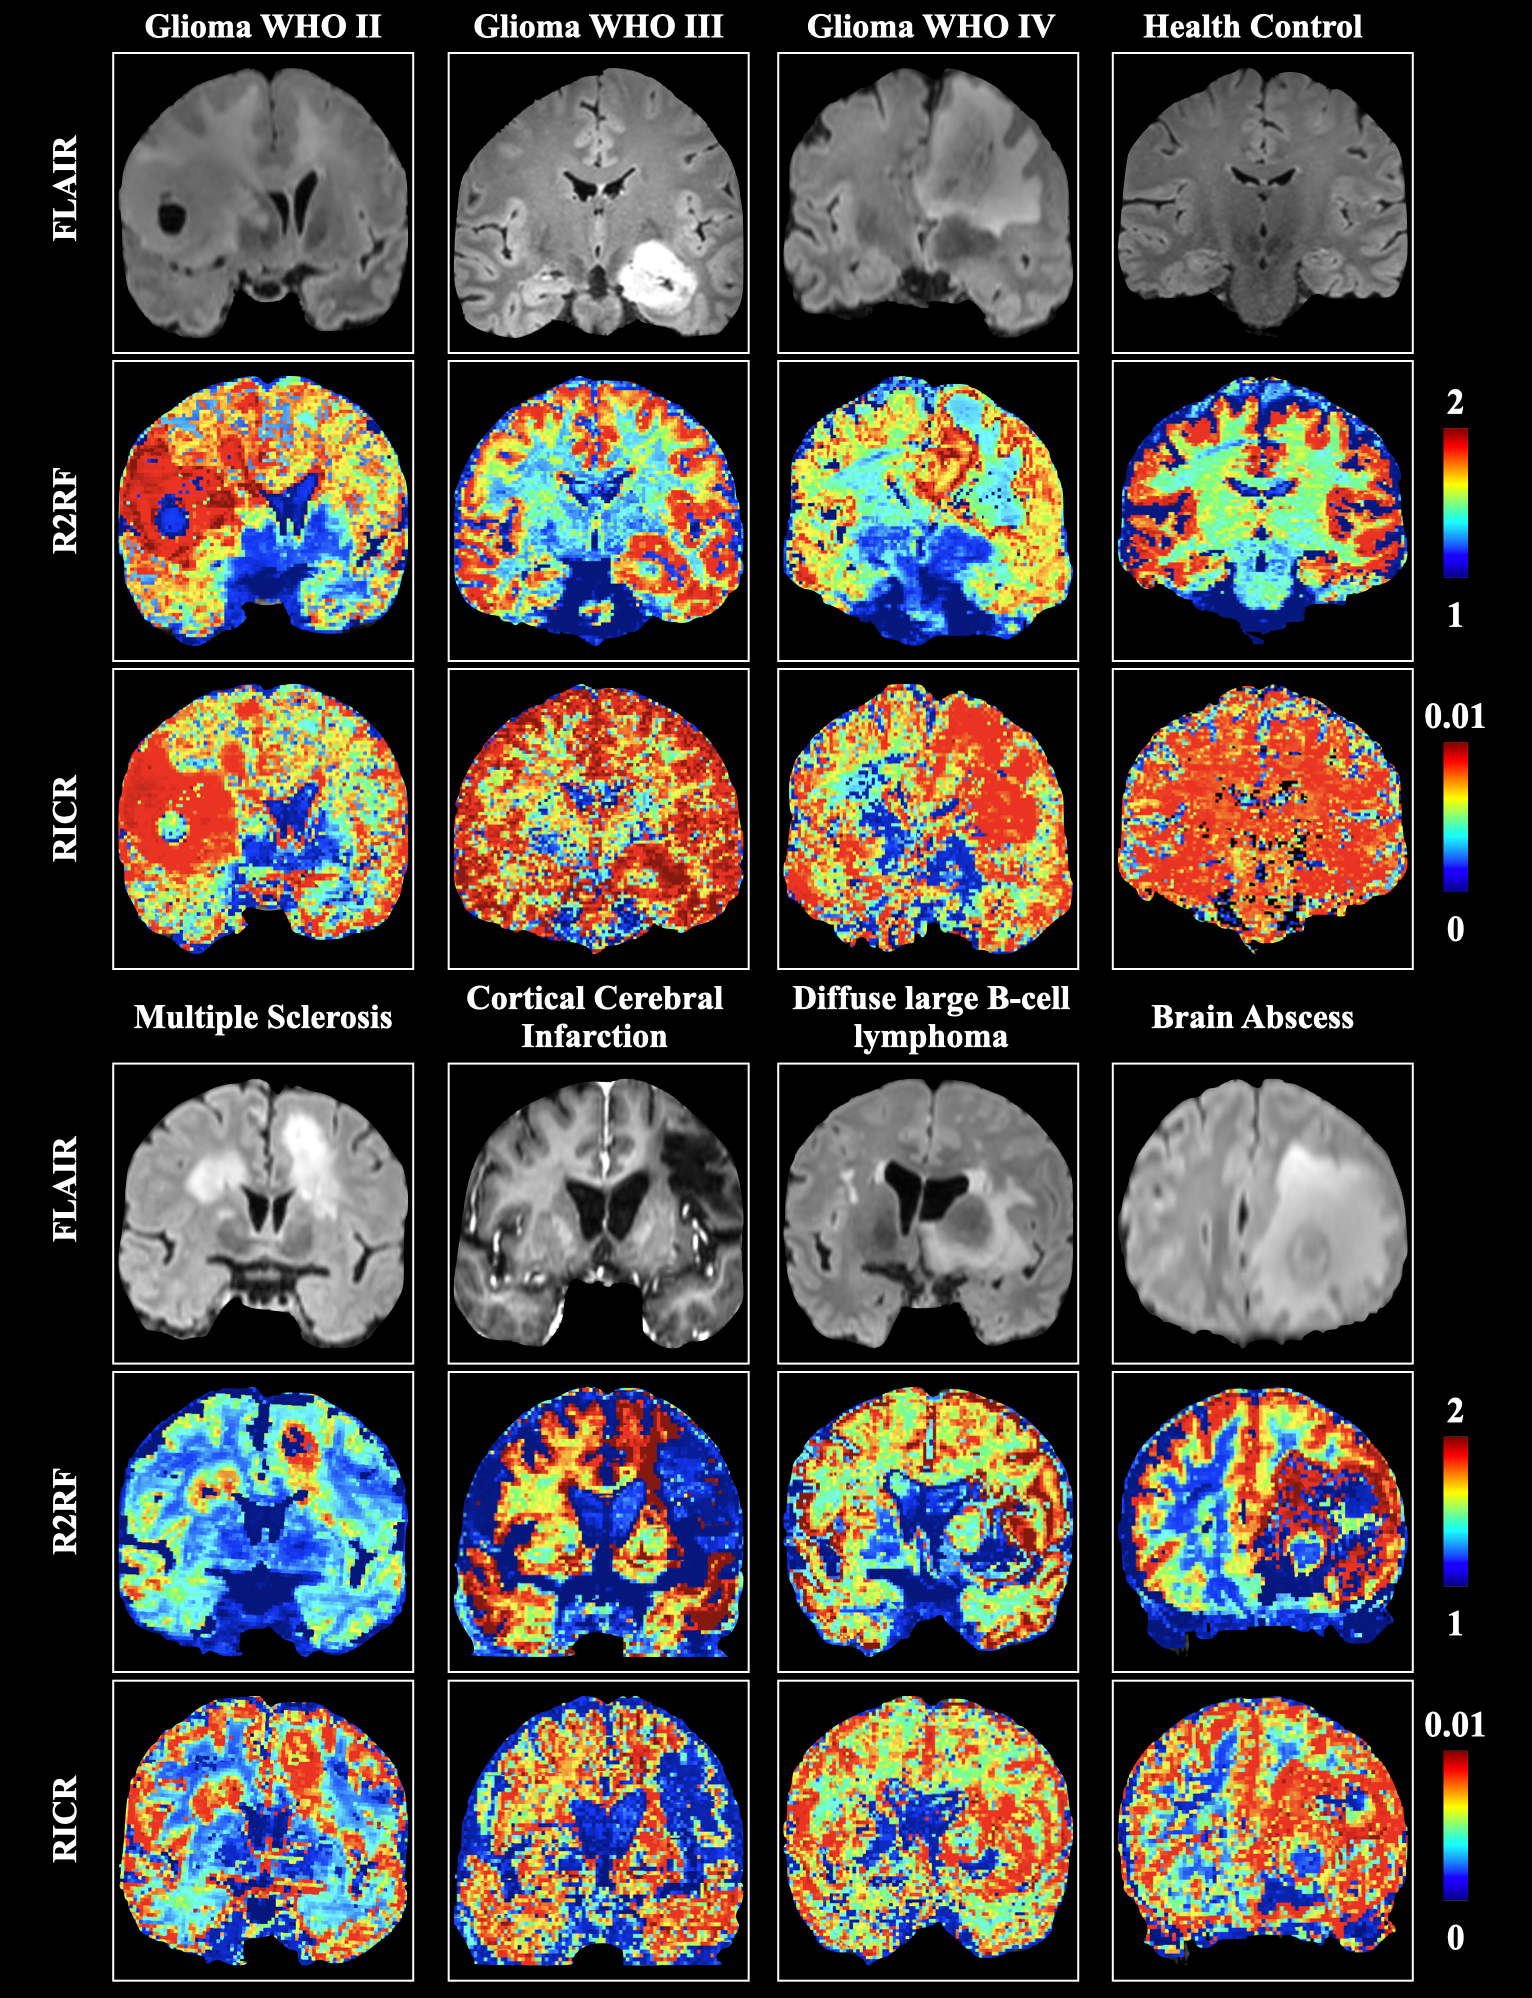
Fig. 2 shows the distribution of voxels in relation to relaxation times and b-values, indicating that relaxation times are longer in gliomas than in ordinary white matter tissue10–12. The higher T2 in grade 4 glioma is associated with changes in metabolite compositions, resulting in remarkable changes in neurite morphology in lesioned tissues13,14. This could be due to longer transverse relaxation time caused by increased water content within the tumor, which is helpful in visualizing peritumoral edema.Tumor-active areas are known for having a higher proliferation rate of tumor cells, resulting in a higher proportion of restricted water. In Fig. 3, this increase in restricted water leads to an increase in R2RF and RICR, which can reflect the density and proliferation rate of tumor tissue. These indicators are helpful in the preoperative diagnosis of tumor aggressiveness and clinical grade. They can also differentiate the active tumor area from the water area with high sensitivity, which is helpful in preoperative planning for surgical margins. R2RF and RICR can also distinguish between the tumor erosion area and the reactive edema in the edema area. This enables the differentiation of the erosion edge of the tumor, the active area of multiple sclerosis, the ischemic area of cerebral infarction, and so on, making it useful for clinical dynamic monitoring. RDSI improves the detection of small metastases, delineation of tumor extent, and characterization of the intratumoral microenvironment in comparison to the FLAIR image, and provides valuable information on microvascularity and necrosis, which is helpful for the early stratification of patients with gliomas.
Acknowledgements
This work was supported by the National Natural Science Foundation of China (Nos. 62201265, 62101365, 62172228) and the Natural Science Foundation of Hubei Province of China (No. 2021CFB442).References
1. Cowan B, Cowan BP. Nuclear Magnetic Resonance and Relaxation. Vol 427. Cambridge University Press Cambridge; 1997.
2. Kleinberg RL, Horsfield MA. Transverse relaxation processes in porous sedimentary rock. J Magn Reson 1969. 1990;88(1):9-19.
3. Thulborn KR, Waterton JC, Matthews PM, Radda GK. Oxygenation dependence of the transverse relaxation time of water protons in whole blood at high field. Biochim Biophys Acta BBA-Gen Subj. 1982;714(2):265-270.
4. Weisskoff R, Zuo CS, Boxerman JL, Rosen BR. Microscopic susceptibility variation and transverse relaxation: theory and experiment. Magn Reson Med. 1994;31(6):601-610.
5. Wu Y, Liu X, Zhang X, Huynh KM, Ahmad S, Yap PT. Relaxation-Diffusion Spectrum Imaging for Probing Tissue Microarchitecture. In: Greenspan H, Madabhushi A, Mousavi P, et al., eds. Medical Image Computing and Computer Assisted Intervention – MICCAI 2023. Vol 14227. Lecture Notes in Computer Science. Springer Nature Switzerland; 2023:152-162. doi:10.1007/978-3-031-43993-3_15
6. Morozov S, Sergunova K, Petraikin A, et al. Diffusion processes modeling in magnetic resonance imaging. Insights Imaging. 2020;11(1):60. doi:10.1186/s13244-020-00863-w
7. Ning L, Westin CF, Rathi Y. Characterization of b-value dependent T2 relaxation rates for probing neurite microstructure. bioRxiv. Published online 2022.
8. Veraart J, Nunes D, Rudrapatna U, et al. Noninvasive quantification of axon radii using diffusion MRI. eLife. 2020;9:e49855. doi:10.7554/eLife.49855
9. White NS, Leergaard TB, D’Arceuil H, Bjaalie JG, Dale AM. Probing tissue microstructure with restriction spectrum imaging: histological and theoretical validation. Hum Brain Mapp. 2013;34(2):327-346. doi:10.1002/hbm.21454
10. Upadhyay N, Waldman A. Conventional MRI evaluation of gliomas. Br J Radiol. 2011;84(special_issue_2):S107-S111.
11. Hu LS, Hawkins-Daarud A, Wang L, Li J, Swanson KR. Imaging of intratumoral heterogeneity in high-grade glioma. Cancer Lett. 2020;477:97-106.
12. Ellingson BM, Wen PY, Cloughesy TF. Modified criteria for radiographic response assessment in glioblastoma clinical trials. Neurotherapeutics. 2017;14(2):307-320.
13. Tavakoli MB, Khorasani A, Jalilian M. Improvement grading brain glioma using T2 relaxation times and susceptibility-weighted images in MRI. Inform Med Unlocked. 2023;37:101201. doi:10.1016/j.imu.2023.101201
14. Li Y, Srinivasan R, Ratiney H, Lu Y, Chang SM, Nelson SJ. Comparison of T1 and T2 metabolite relaxation times in glioma and normal brain at 3T. J Magn Reson Imaging. 2008;28(2):342-350. doi:10.1002/jmri.21453
Figures