3491
Investigating the potential of tensor-valued diffusion encoding to detect and characterise Focal Cortical Dysplasia in paediatric epilepsy1GOS Institute of Child Health, UCL, London, United Kingdom, 2Great Ormond Street Hospital, London, United Kingdom, 3Medical Radiation Physics, Lund University, Lund, Sweden
Synopsis
Keywords: Microstructure, Epilepsy
Motivation: Radiological assessment of focal cortical dysplasia (FCD), the most common form of drug-resistant paediatric epilepsy, remains challenging on conventional MRI.
Goal(s): Our goal was to test whether tensor-valued diffusion encoding, which provides metrics related to size variance and microscopic anisotropy, can be used to detect and characterise FCD.
Approach: Paediatric patients were scanned with a prototype tensor-valued diffusion encoding sequence and parameter estimates were visually and statistically compared.
Results: While the diffusion maps provide no strong contrast compared to structural images, our statistical results reflect FCD microstructural heterogeneity when comparing FCD and homotopic grey matter regions.
Impact: Comparison of tensor-valued diffusion encoding parameters reflects FCD heterogeneity, potentially relating to lesion subtype. Despite weak contrast for FCD detection at present, this method could aid in vivo FCD characterisation in radiological assessment workflow prior to surgery.
Introduction
Focal cortical dysplasia (FCD) are malformations of cortical development1 and the most common cause of drug-resistant focal epilepsy in children2. They are characterised by abnormal tissue organisation and dysmorphic neurons, such as unusually large balloon cells in Type IIb3,4. Many FCDs are ‘MR-negative’ on conventional MRI (i.e., T1-weighted and FLAIR) making radiological assessment a challenge5,6. Yet lesion detection and characterisation are crucial for surgical treatment planning and ultimately seizure freedom7. Tensor-valued diffusion encoding using different b-tensor shapes enables the separation of different sources of kurtosis (i.e., size variance and microscopic anisotropy)8,9. Single diffusion encoding is unable to resolve this. Given the known histopathology of FCDs, and the ability of tensor-valued diffusion encoding to estimate diffusion tensor size variance and microscopic anisotropy, we investigate whether this method enables easier identification of FCDs to aid radiological assessment.Methods
Data Acquisition. 5 paediatric patients (ages 13.4 ± 2.3 years) with suspected FCD were scanned on a Siemens 3T Magnetom Prisma (Siemens Medical Systems, Erlangen, Germany) using a prototype spin-echo sequence that supports tensor-valued diffusion encoding10 and multi-band acquisition11. The gradient waveforms were numerically optimised12 and maxwell-compensated13. The b-value was 0.5, 1, and 2 ms/μm2 rotated along 12, 12, and 20 gradient directions for both linear and planar b-tensors. TR = 4200 ms, TE = 82 ms, FOV = 220 mm x 220 mm, voxel size = 2.0 x 2.0 x 2.0 mm. Six b=0 images were acquired, with one acquired in the opposite phase encoding direction. The diffusion scan time took approximately 10 minutes, which is clinically feasible. High resolution structural images (T1-weighted and FLAIR) were acquired during routine clinical practice. Figure 1 summarises the data preprocessing and analysis.Data Preprocessing. Diffusion data was denoised14 and Gibbs ringing artefacts were reduced15. Eddy current distortions and susceptibility artefacts were corrected for using FSL’s TOPUP and EDDY16,17. Diffusion and FLAIR images were linearly registered to the T1-weighted image using NiftyReg18. Diffusion images were also up-sampled to 1mm size voxels. FCD lesions were identified and delineated as regions of interest (ROIs) on the T1w and FLAIR by an expert paediatric neuro-radiologist. Delineation only included cortical abnormalities. Two additional ROIs were delineated on the contralateral side, for grey matter (GM) and white matter (WM) respectively.
Data Analysis. Mean diffusivity (MD), fractional anisotropy (FA), mean kurtosis (MK), isotropic size variance (CMD) and microscopic anisotropy (Cμ or μFA2) were estimated using Q-space Trajectory Imaging (QTI)19 in DIPY20. The diffusion parameter maps were qualitatively assessed and compared to structural images, to see whether FCD lesion detection was possible. FCD and GM regions were statistically compared using the Wilcoxon Rank-Sum Test.
Results
Qualitatively examining the maps with prior knowledge of the FCD and transmantle sign location (Figure 2), there is a decrease in FA, MK and Cμ but not in CMD along the transmantle sign. This decreased signal is likely due to disrupted axonal alignment and density by the intrusion of neuronal cell bodies from grey matter. However, when comparing the structural and diffusion maps, FLAIR, the current gold standard in radiological assessment, still provides the strongest contrast to identify lesions.Our statistical results show the diffusion parameters can capture FCD heterogeneity, through different parameter profiles when comparing FCD and contralateral GM ROIs. For MK, we see that statistical differences are apparent across all patients, however CMD and Cμ differ. This suggests there are differences in underlying microstructure that both contribute to kurtosis. For example, differences in both CMD and Cμ may indicate the presence of balloon cells, characteristic of Type IIb (Patient 2, 3 and 5) while differences only in Cμ may indicate disrupted cortical organisation without balloon cells, characteristic of Type IIa (Patient 1 and 4).
Discussion
While the current diffusion parameter maps do not provide strong contrast to support radiological assessment, statistical comparison of FCDs and contralateral grey matter show indications of FCD heterogeneity. This could support in vivo FCD characterisation and inform surgical treatment planning. Histological confirmation and advanced quantitative analysis, such as surface-based approaches that quantify changes across cortical and subcortical depths20, are needed to further assess these metrics for characterising FCD subtypes. A clear limitation here is low resolution and loss of precision during registration and up-sampling. FCDs are generally much smaller compared to, for example, tumours. In the future, overcoming these limitations and other microstructural models, particularly Neural Soma Imaging21, will be investigated.Conclusion
Tensor-valued diffusion encoding has the potential to provide specific details that characterise FCD subtype and heterogeneity, but quantitative analysis and technical developments are needed to increase translatability and aid presurgical radiological assessment.Acknowledgements
This study was funded by the Child Health Research CIO.References
1. Blümcke, I., Thom, M., Aronica, E., Armstrong, D.D., Vinters, H.V., Palmini, A., Jacques, T.S., Avanzini, G., Barkovich, A.J., Battaglia, G., Becker, A., Cepeda, C., Cendes, F., Colombo, N., Crino, P., Cross, J.H., Delalande, O., Dubeau, F., Duncan, J. and Guerrini, R. (2010). The clinicopathologic spectrum of focal cortical dysplasias: A consensus classification proposed by an ad hoc Task Force of the ILAE Diagnostic Methods Commission1. Epilepsia, [online] 52(1), pp.158–174.
2. Palmini, A. and Holthausen, H. (2013). Focal malformations of cortical development: a most relevant etiology of epilepsy in children. Handbook of Clinical Neurology, [online] 111, pp.549–565. doi:https://doi.org/10.1016/B978-0-444-52891-9.00058-0.
3. Taylor, D.C., Falconer, M.A., Bruton, C.J. and Corsellis, J.A.N. (1971). Focal dysplasia of the cerebral cortex in epilepsy. Journal of Neurology, Neurosurgery, and Psychiatry, [online] 34(4), pp.369–387. Available at: https://www.ncbi.nlm.nih.gov/pmc/articles/PMC493805/.
4. Najm, I., Lal, D., Alonso Vanegas, M., Cendes, F., Lopes‐Cendes, I., Palmini, A., Paglioli, E., Sarnat, H.B., Walsh, C.A., Wiebe, S., Aronica, E., Baulac, S., Coras, R., Kobow, K., Cross, J.H., Garbelli, R., Holthausen, H., Rössler, K., Thom, M. and El‐Osta, A. (2022). The ILAE consensus classification of focal cortical dysplasia: An update proposed by an ad hoc task force of the ILAE diagnostic methods commission. Epilepsia, 63(8), pp.1899–1919. doi:https://doi.org/10.1111/epi.17301.
5. Guerrini, R., Sicca, F. and Parmeggiani, L. (2003). Epilepsy and malformations of the cerebral cortex. Epileptic Disorders: International Epilepsy Journal with Videotape, [online] 5 Suppl 2, pp.S9-26. Available at: https://pubmed.ncbi.nlm.nih.gov/14617417/
6. Widdess-Walsh, P., Diehl, B. and Najm, I. (2006). Neuroimaging of Focal Cortical Dysplasia. Journal of Neuroimaging, 16(3), pp.185–196. doi:https://doi.org/10.1111/j.1552-6569.2006.00025.x.
7. Téllez-Zenteno, J.F., Ronquillo, L.H., Moien-Afshari, F. and Wiebe, S. (2010). Surgical outcomes in lesional and non-lesional epilepsy: A systematic review and meta-analysis. Epilepsy Research, 89(2-3), pp.310–318. doi:https://doi.org/10.1016/j.eplepsyres.2010.02.007.
8. Topgaard, D. (2017). Multidimensional diffusion MRI. Journal of Magnetic Resonance, 275, pp.98–113. doi:https://doi.org/10.1016/j.jmr.2016.12.007.
9. Novikov, D.S., Fieremans, E., Jespersen, S.N. and Kiselev, V.G. (2018). Quantifying brain microstructure with diffusion MRI: Theory and parameter estimation. NMR in Biomedicine, 32(4). doi:https://doi.org/10.1002/nbm.3998.
10. Szczepankiewicz, F., Sjölund, J., Ståhlberg, F., Lätt, J. and Nilsson, M. (2019). Tensor-valued diffusion encoding for diffusional variance decomposition (DIVIDE): Technical feasibility in clinical MRI systems. PLOS ONE, 14(3), p.e0214238. doi:https://doi.org/10.1371/journal.pone.0214238.
11. Setsompop, K., Cohen-Adad, J., Gagoski, B.A., Raij, T., Yendiki, A., Keil, B., Wedeen, V.J., Wald, L.L., 2012. Improving diffusion MRI using simultaneous mulz-slice echo planar imaging. NeuroImage 63, 569–580. h{ps://doi.org/10.1016/j.neuroimage.2012.06.033.
12. Sjölund, J., Szczepankiewicz, F., Nilsson, M., Topgaard, D., Westin, C.-F. and Knutsson, H. (2015). Constrained optimization of gradient waveforms for generalized diffusion encoding. Journal of Magnetic Resonance, [online] 261, pp.157–168. doi:https://doi.org/10.1016/j.jmr.2015.10.012.
13. Filip Szczepankiewicz, Westin, C.-F. and Nilsson, M. (2019). Maxwell‐compensated design of asymmetric gradient waveforms for tensor‐valued diffusion encoding. Magnetic Resonance in Medicine, 82(4), pp.1424–1437. doi:https://doi.org/10.1002/mrm.27828.
14. Veraart, J., Novikov, D.S., Christiaens, D., Ades-aron, B., Sijbers, J. and Fieremans, E. (2016). Denoising of diffusion MRI using random matrix theory. NeuroImage, 142, pp.394–406. doi:https://doi.org/10.1016/j.neuroimage.2016.08.016.
15. Kellner, E., Dhital, B., Kiselev, V.G. and Reisert, M. (2015). Gibbs-ringing artifact removal based on local subvoxel-shifts. Magnetic Resonance in Medicine, [online] 76(5), pp.1574–1581. doi:https://doi.org/10.1002/mrm.26054.
16. Andersson, J.L.R. and Sotiropoulos, S.N. (2016). An integrated approach to correction for off-resonance effects and subject movement in diffusion MR imaging. NeuroImage, [online] 125, pp.1063–1078. doi:https://doi.org/10.1016/j.neuroimage.2015.10.019.
17. Smith, S.M., Jenkinson, M., Woolrich, M.W., Beckmann, C.F., Behrens, T.E.J., Johansen-Berg, H., Bannister, P.R., De Luca, M., Drobnjak, I., Flitney, D.E., Niazy, R.K., Saunders, J., Vickers, J., Zhang, Y., De Stefano, N., Brady, J.M. and Matthews, P.M. (2004). Advances in functional and structural MR image analysis and implementation as FSL. NeuroImage, 23, pp.S208–S219. doi:https://doi.org/10.1016/j.neuroimage.2004.07.051.
18. Modat, M., McClelland, J., Ourselin, S. 2010. Lung registrazon using the NiuyReg package. Medical Image Analysis for the Clinic: A Grand Challenge, Workshop Proc. from MICCAI 2010.
19. Westin, C.-F., Knutsson, H., Pasternak, O., Szczepankiewicz, F., Özarslan, E., van Westen, D., Mattisson, C., Bogren, M., O’Donnell, L.J., Kubicki, M., Topgaard, D. and Nilsson, M. (2016). Q-space trajectory imaging for multidimensional diffusion MRI of the human brain. NeuroImage, 135, pp.345–362.
20. Garyfallidis, E., Bre{, M., Amirbekian, B., Rokem, A., Van Der Walt, S., Descoteaux, M., Nimmo-Smith, I., Dipy Contributors, 2014. Dipy, a library for the analysis of diffusion MRI data. Front. Neuroinform. 8. https://doi.org/10.3389/fninf.2014.00008.
20. Lorio, S., Adler, S., Gunny, R., D’Arco, F., Kaden, E., Konrad Wagstyl, Jacques, T.S., Clark, C.A., J. Helen Cross, Torsten Baldeweg and Carmichael, D.W. (2020). MRI profiling of focal cortical dysplasia using multi‐compartment diffusion models. Epilepsia, 61(3), pp.433–444. doi:https://doi.org/10.1111/epi.16451.
21. Gyori, N.G., Clark, C.A., Alexander, D.C. and Kaden, E. (2021). On the potential for mapping apparent neural soma density via a clinically viable diffusion MRI protocol. NeuroImage, 239, p.118303. doi:https://doi.org/10.1016/j.neuroimage.2021.118303.
Figures
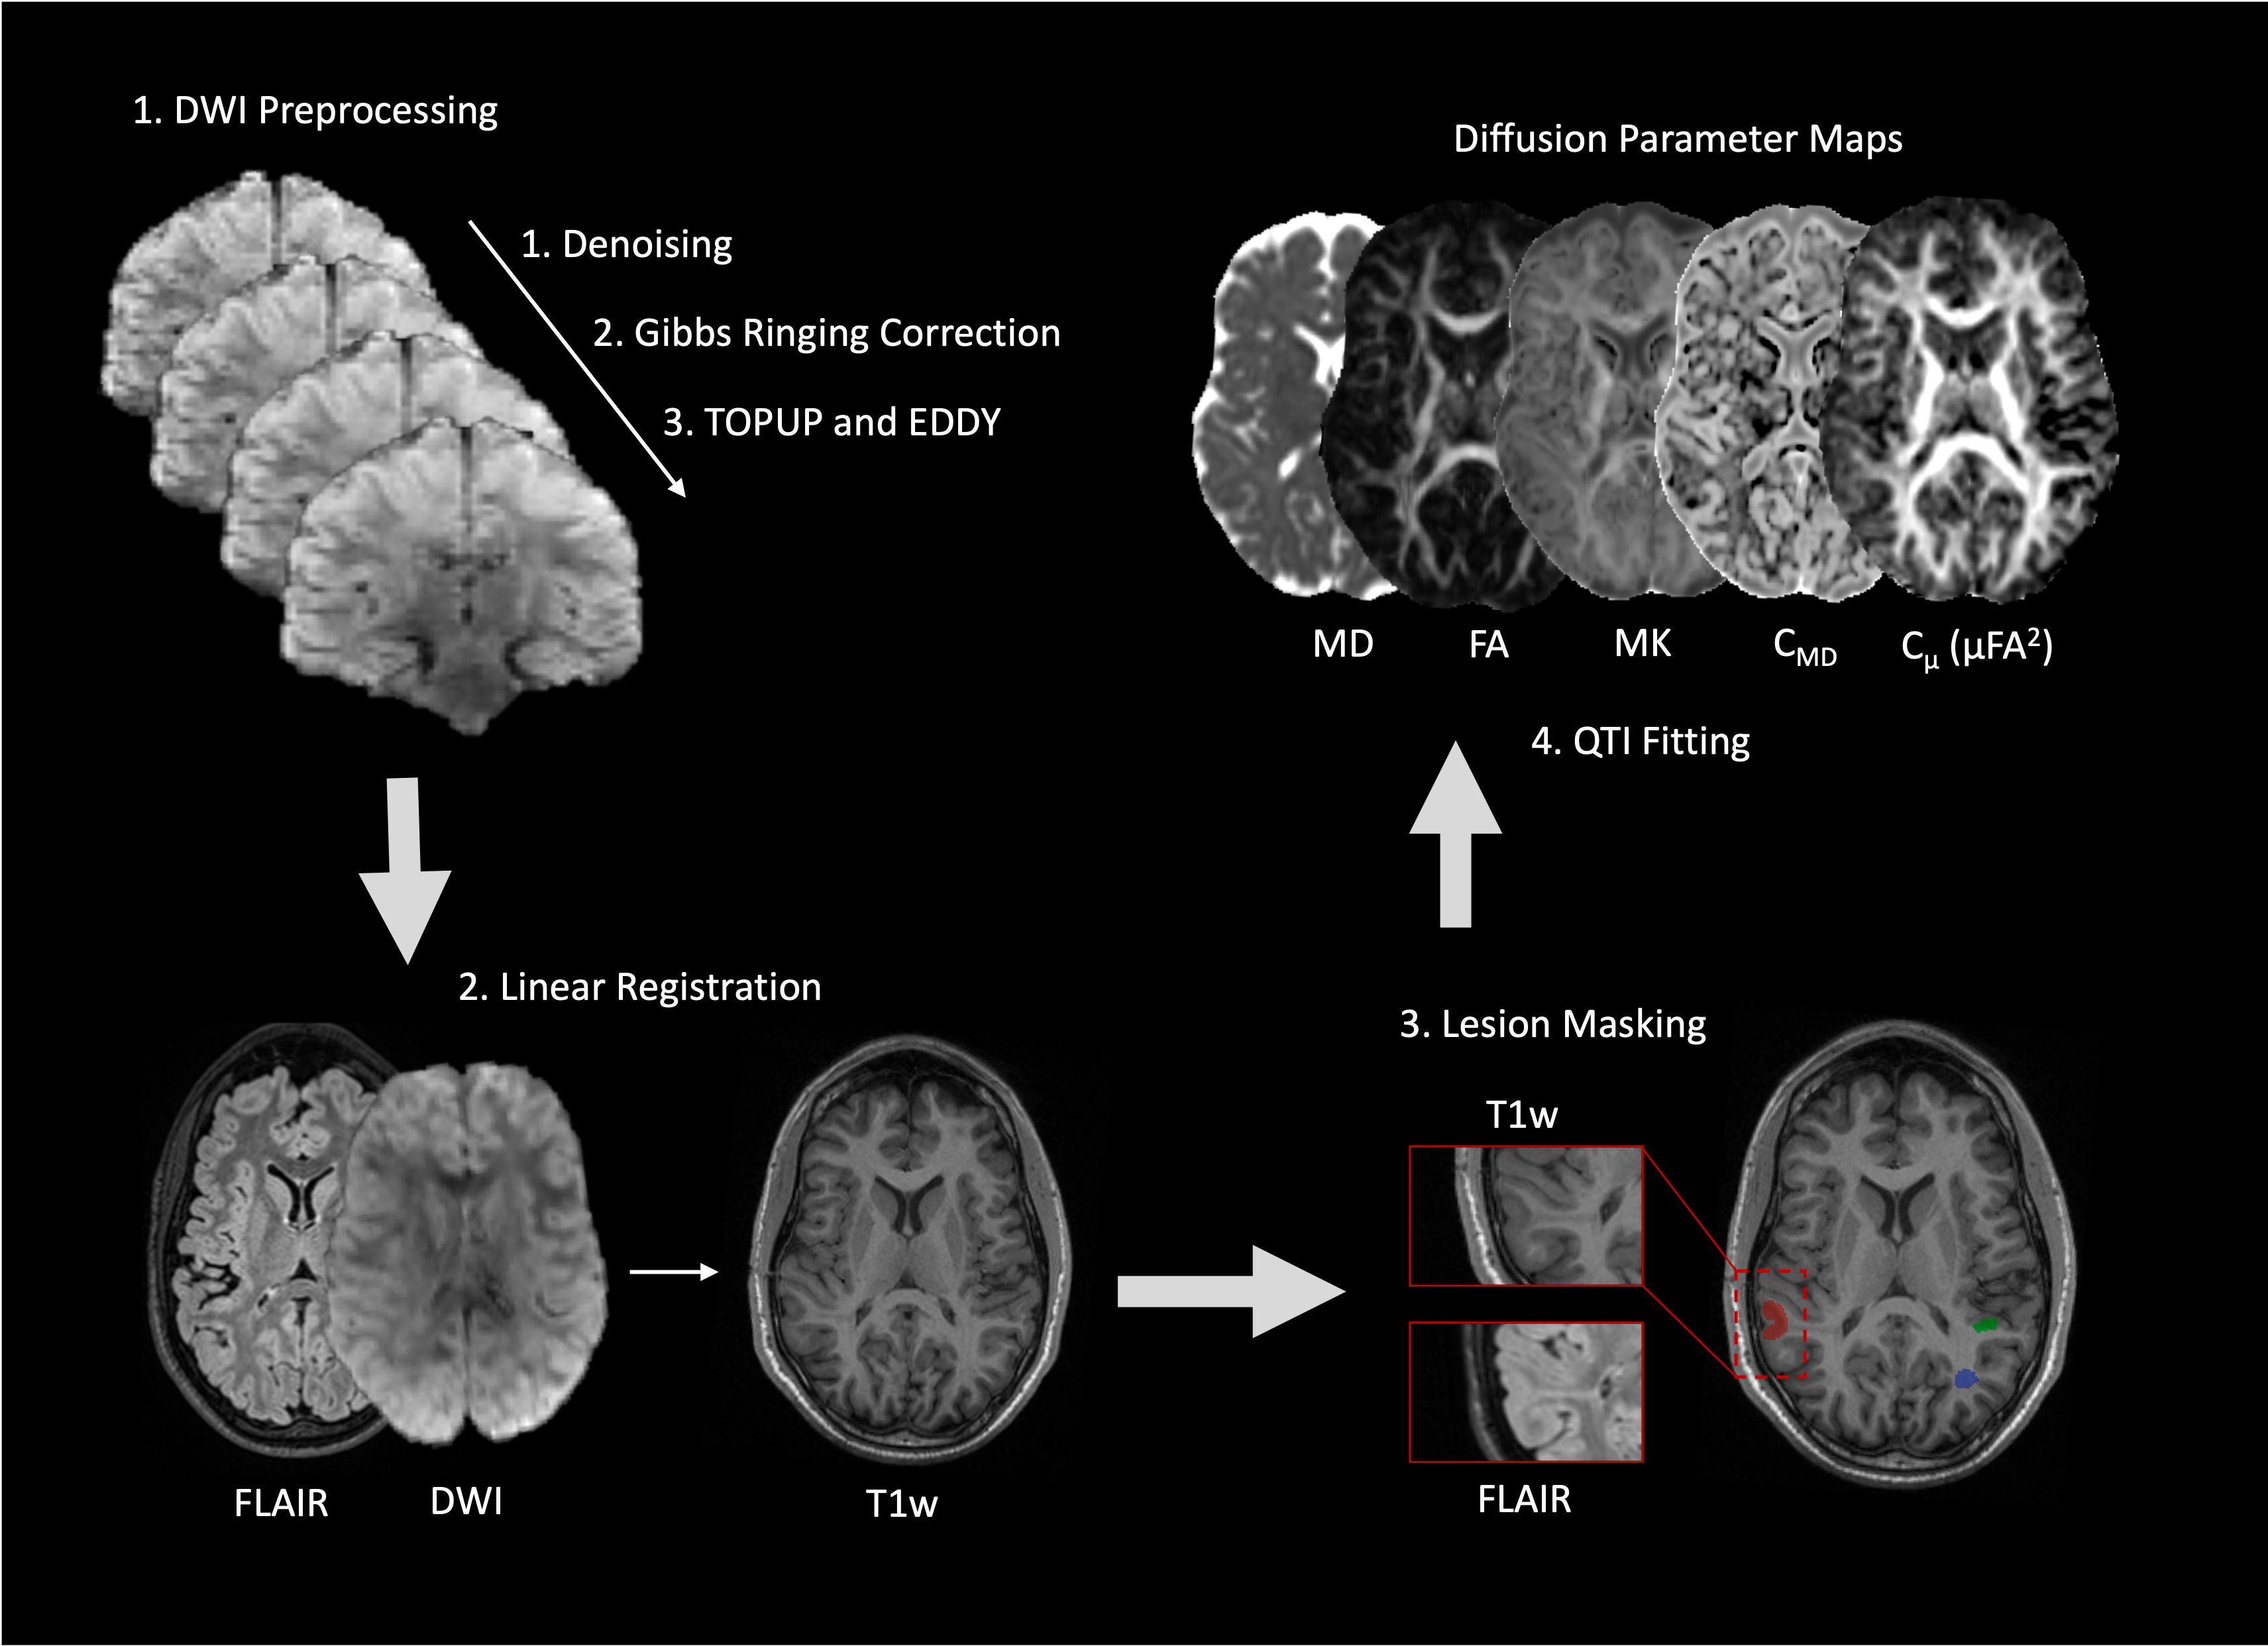
Figure 1. Data analysis pipeline. 1) Diffusion-weighted images were denoised, corrected for gibbs artefacts, eddy current distortions and susceptibility artefacts. 2) The diffusion and FLAIR images were linearly registered to the T1-weighted image. Diffusion images were then up-sampled to 1mm size voxels. 3) FCD lesion (red), grey matter (GM, green) and white matter (WM, blue) were delineated as regions of interest (ROIs) on the T1w and FLAIR by an experienced paediatric neuro-radiologist. 4) Diffusion parameters, MD, FA, MK, CMD, Cμ (or μFA2) were fitted using the QTI model.
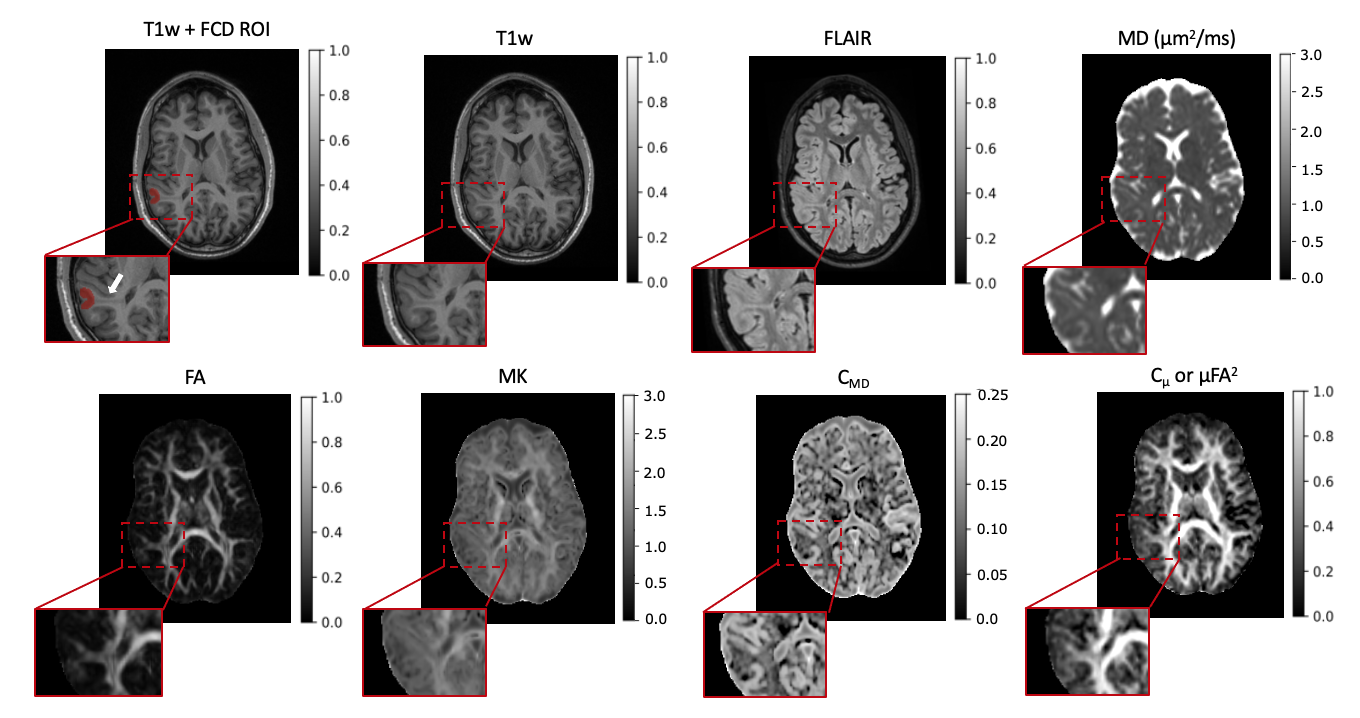
Figure 2. Structural images and diffusion parameter maps in one example patient with suspected FCD and a transmantle sign. The first T1w image shows the FCD ROI (red) and an arrow pointing to the transmantle sign, which is a result of disrupted neuronal migration of grey matter cell bodies into white matter. Other maps show FLAIR, MD, FA, MK, CMD and Cμ (or μFA2), all with a magnified area corresponding to the FCD ROI.
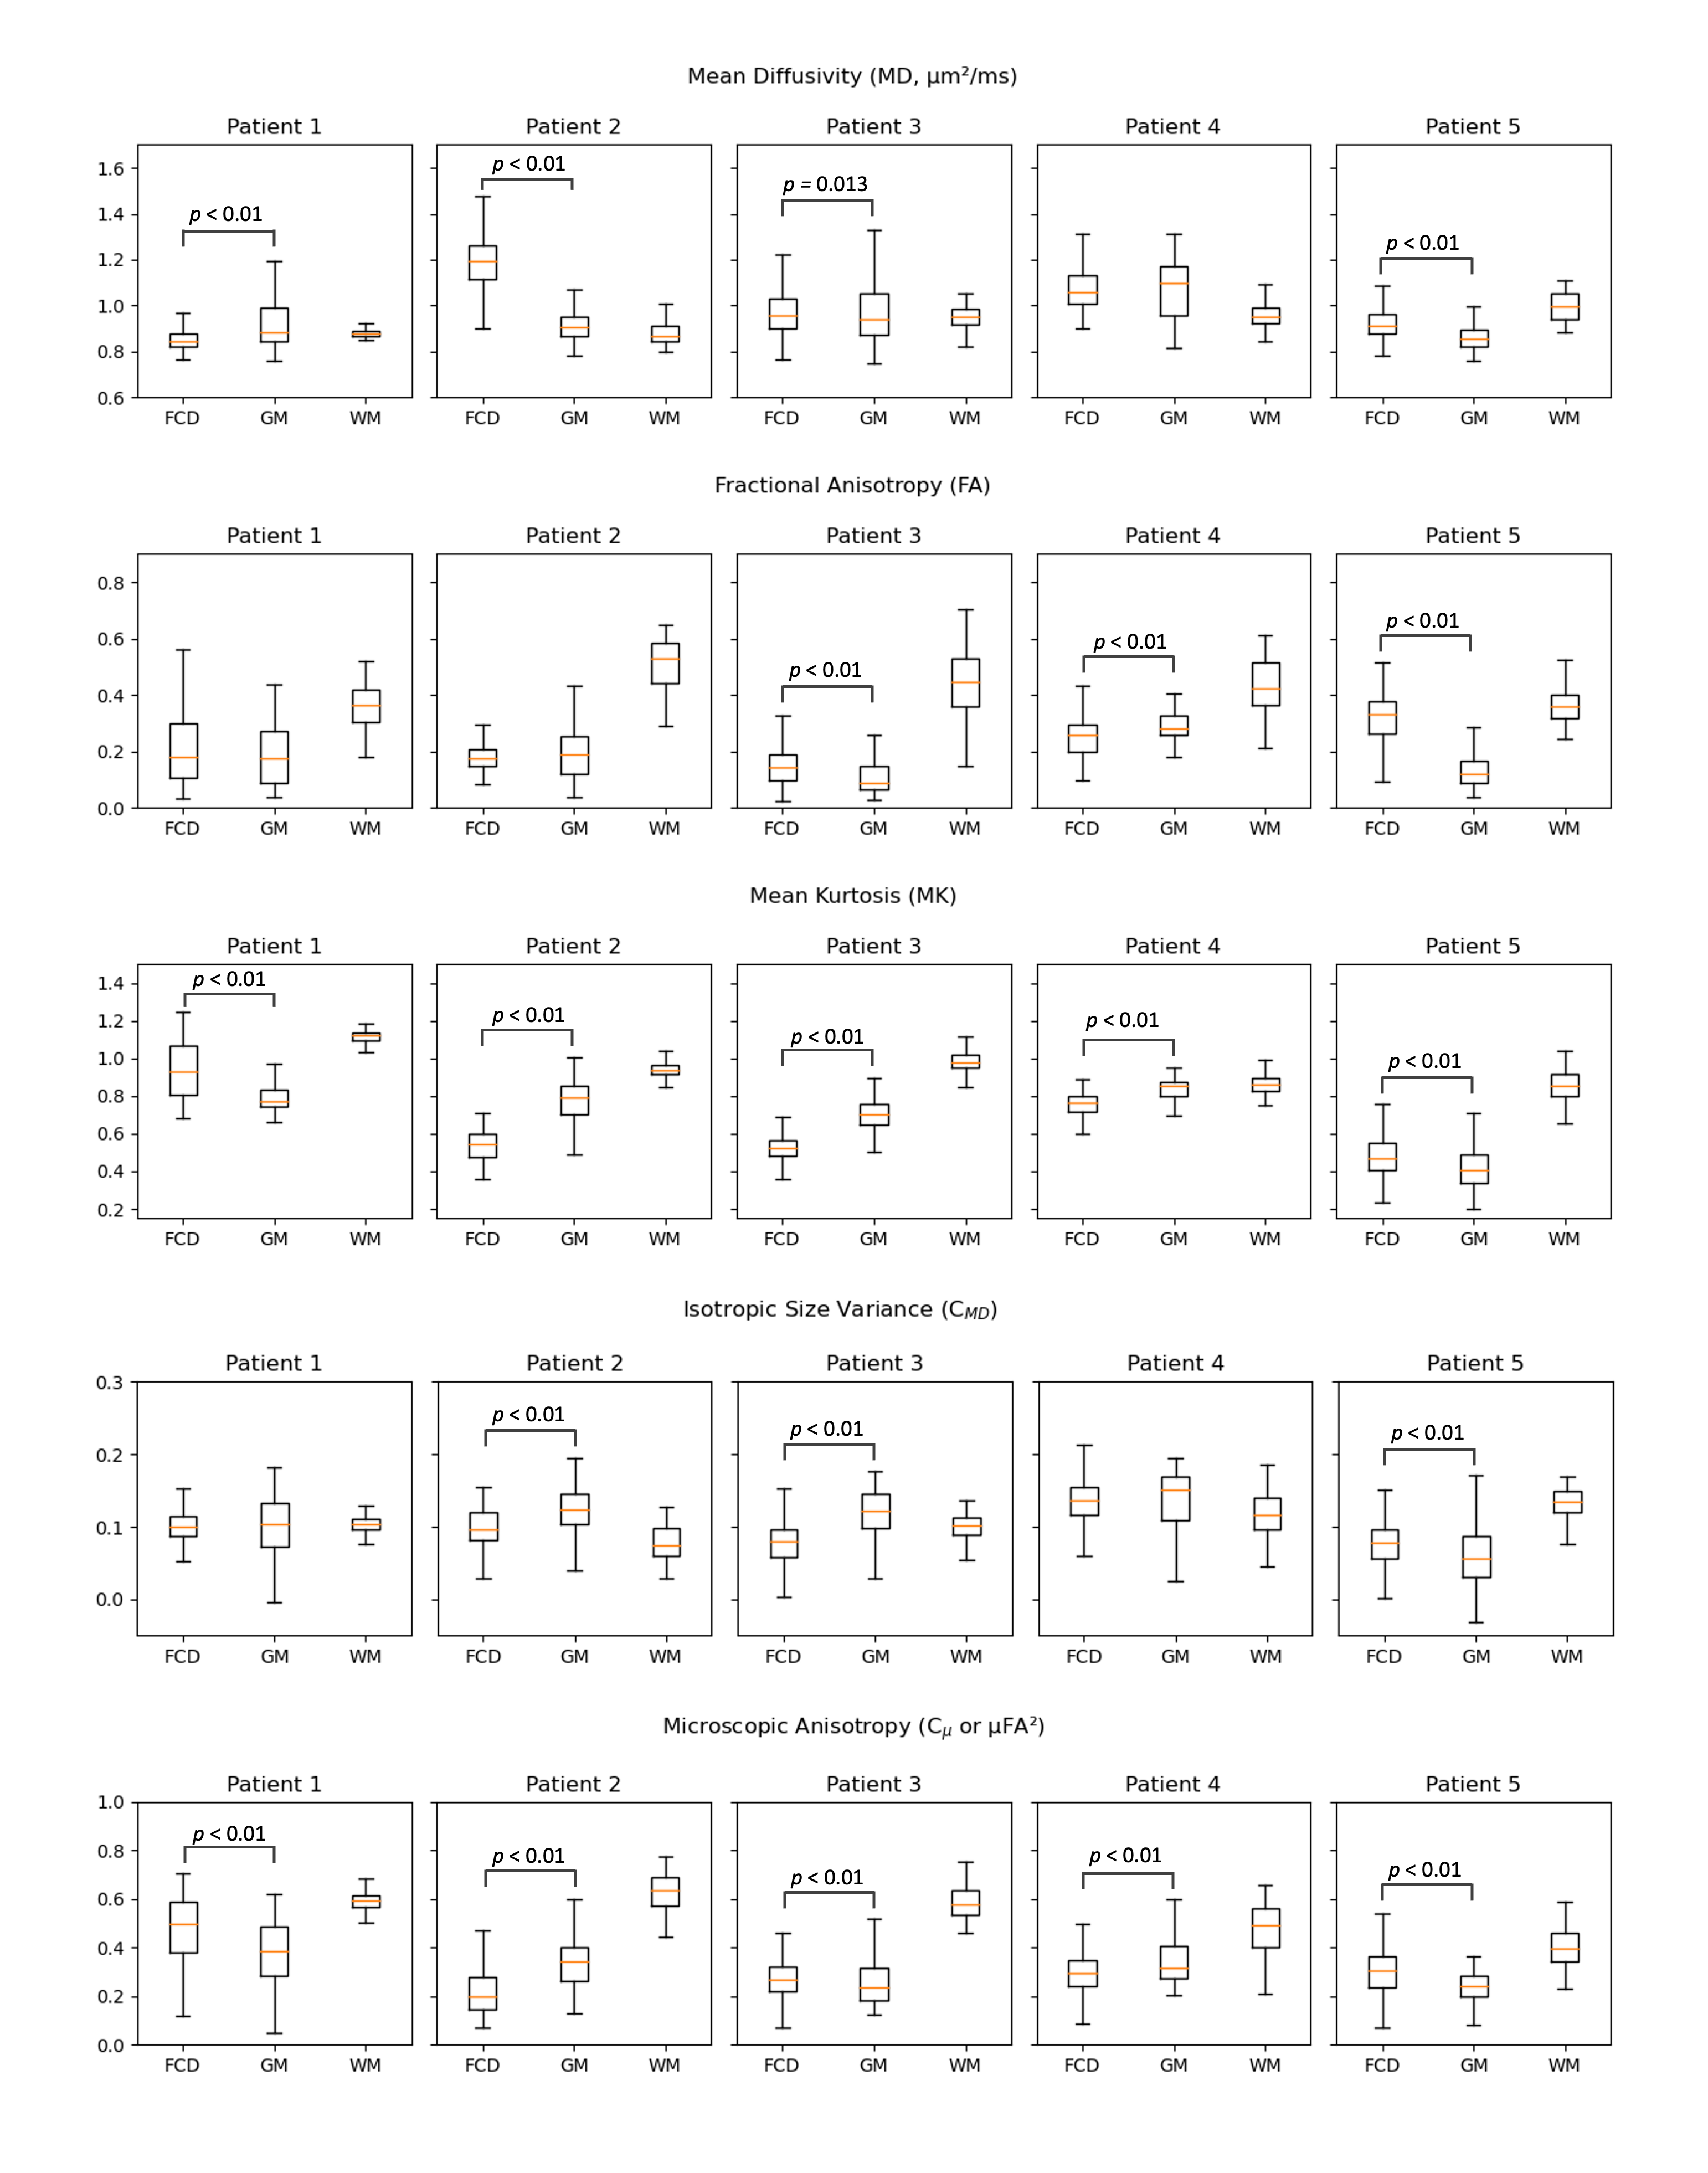
Figure 3. Box-plots of the diffusion parameters across the 5 patients. MD, FA, MK, CMD, Cμ (or μFA2) are shown. Orange line indicates the voxel mean for each ROI (FCD, GM and WM). Statistical significance between FCD and GM was tested using the Wilcoxon Rank-Sum Test (p < 0.5).