3489
Correlation Between Longitudinal Changes in Substructure DTI and Neurocognitive Outcomes for Pediatric Brain Tumor Patients1Radiation Oncology and Molecular Radiation Sciences, Johns Hopkins Medicine, Baltimore, MD, United States, 2Radiology and Radiological Science, Johns Hopkins Medicine, Baltimore, MD, United States, 3Biostatistics, Johns Hopkins University, Baltimore, MD, United States, 4Psychiatry and Behavioral Sciences, Johns Hopkins Medicine, Baltimore, MD, United States, 5Neuropsychology, Kennedy Krieger Institute, Baltimore, MD, United States
Synopsis
Keywords: DWI/DTI/DKI, Diffusion Tensor Imaging
Motivation: The five-year survival of pediatric CNS tumors has increased from 57% in 1975 to 77% in 2015. Despite these improvements, survivors are at risk for cognitive sequelae resulting from disease and treatment exposures.
Goal(s): Evaluate the correlations between substructure white matter integrity and neurocognitive outcomes.
Approach: The current study examined associations between longitudinal change in substructure DTI and neurocognitive outcomes in 61 pediatric brain tumor patients.
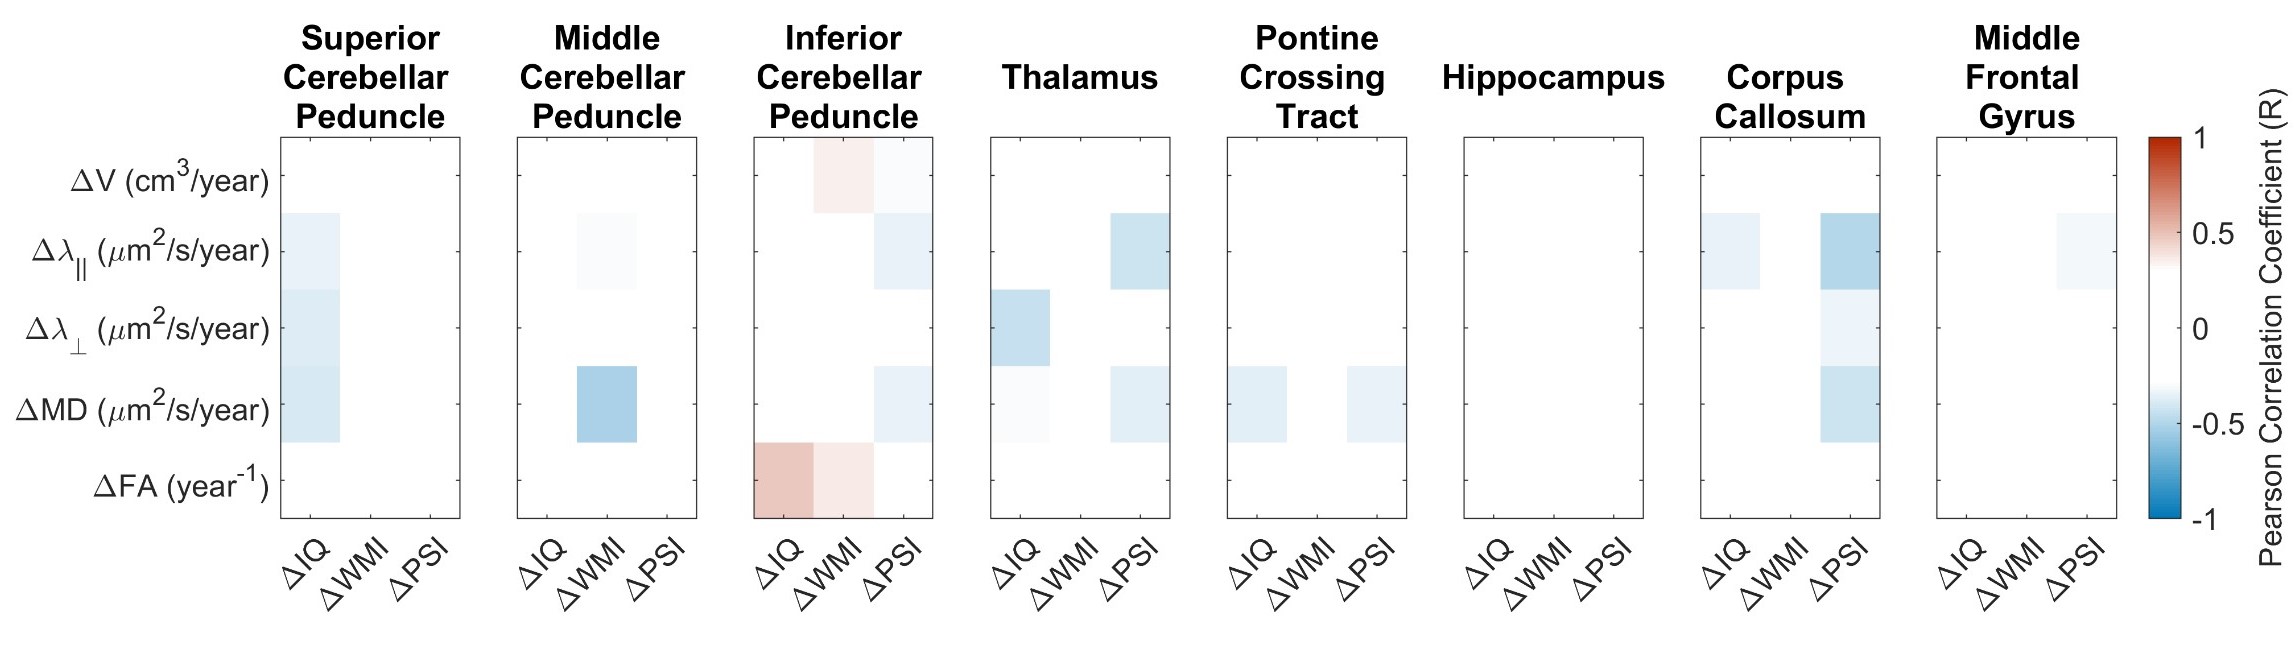
Results: Moderate correlations were found between mean diffusivity in the middle cerebellar peduncle and working memory, fractional anisotropy in the inferior cerebellar peduncle and intelligence quotient, and axial diffusivity in the corpus callosum and processing speed.
Impact: Quantifying the correlation between longitudinal change in substructure DTI and cognitive outcomes in pediatric brain tumor patients will aid radiation oncologists in the pursuit of substructure-informed treatment planning by limiting dose to brain substructures sensitive to specific neurocognitive domains.
Introduction
Central nervous system (CNS) tumors are the second most common pediatric malignancy and the most common solid tumor in children.1 The overall five-year survival of pediatric CNS tumors has increased from 57% in 1975 to 77% in 2015,2 highlighting the need to improve quality of life during the survivorship period. Survivors of pediatric CNS tumors are at risk for neuropsychological sequelae resulting from the disease and treatment.3 To better understand the mechanisms of treatment-induced neurocognitive impairment, the white matter integrity of neuroanatomical substructures related to cognition ought to be evaluated before and after treatment. DTI metrics are valuable in the evaluation of white matter integrity and have previously been shown to correlate with cognitive outcome.4,5 The goal of this study was to examine associations between longitudinal change in substructure DTI and neurocognitive outcome in 61 pediatric brain tumor patients over the course of treatment and follow-up.Methods
Patient population:The Institutional Review Board at Johns Hopkins University and Kennedy Krieger Institute approved this retrospective study. Patients (<18 years old) at our institutions who were diagnosed with a brain tumor between 2002 – 2022 and underwent at least two neurocognitive assessments were eligible for inclusion. The median time between MRI acquisition and neurocognitive assessment was 41 days. Patient demographics and clinical characteristics were summarized in Table 1.
Neurocognition assessment:
Neurocognitive assessment included Full Scale Intelligence Quotient (IQ), Working Memory Index (WMI), and Processing Speed Index (PSI). IQ was evaluated using the Weschler Intelligence Scale for Children (WISC-IV or WISC-V) or the Weschler Adult Intelligence Scale (WAIS-IV) depending on the patient’s age at assessment. The WMI consisted of the Digit Span, Picture Span, and/or Letter-Number Sequencing subtests depending on which Wechsler version was administered. The PSI included Coding and Symbol Search subtests. Neurocognitive scores for IQ, WMI, and PSI were age-standardized with a mean of 100 and standard deviation of 15.
Image acquisition and analysis:
Retrospective data was acquired over 20+ years, meaning that MRI scanners and sequences used for image acquisition differ marginally in their hardware and protocols. The quantification of MD and FA are relatively constant with magnetic field strength6 and b-values less than 1000 s/mm2,7 therefore image data was homogenized as follows: vendor = Siemens (Munich, Germany), B0 = 1.5 or 3T, b-value = 800 or 1000 s/mm2, and voxel size = 1.25 × 1.25 × 2.5 cm3. Individual patient scans were homogenized for comparison to include only one field strength and b-value. The Siemens MRI scanners included: Skyra (3T), Prisma (3T), Verio (3T), Trio (3T), Sola (1.5T), Aera (1.5T), Avanto (1.5T), and Espree (1.5T). The DWI were processed using MRICloud software.8 Image pre-processing included de-identification, linear eddy current and motion correction. DTI derived scalar measures – axial diffusivity (AD or λ‖), radial diffusivity (RD or λ⊥), mean diffusivity (MD), and fractional anisotropy (FA) – were computed using least squares-based tensor fitting in combination with the Geman-McClure M-estimator9 and corrected inter-slice intensity discontinuity weighting terms for pixel-by-pixel outlier rejection.10 A multi-contrast multi-atlas likelihood-fusion algorithm was used to automatically segment the brain into 193 neuroanatomical substructures based on the DTI data.11 Tumors were contoured manually in 3D Slicer (v5.2.2, slicer.org)12 by a qualified radiation oncologist and subtracted from all automatically segmented substructures to avoid overlap. A representative dataset illustrating a segmentation map and each DTI metric was shown in Figure 1.
Statistical analysis:
Longitudinal change in substructure DTI and neurocognitive measures were quantified by the slope of a least squares linear fit for each patient. The correlation between longitudinal change in substructure DTI and neurocognitive measures were quantified by a Pearson correlation coefficient. Figures were generated and statistics computed using MATLAB (R2022b, The MathWorks, Natick, MA, USA).
Results
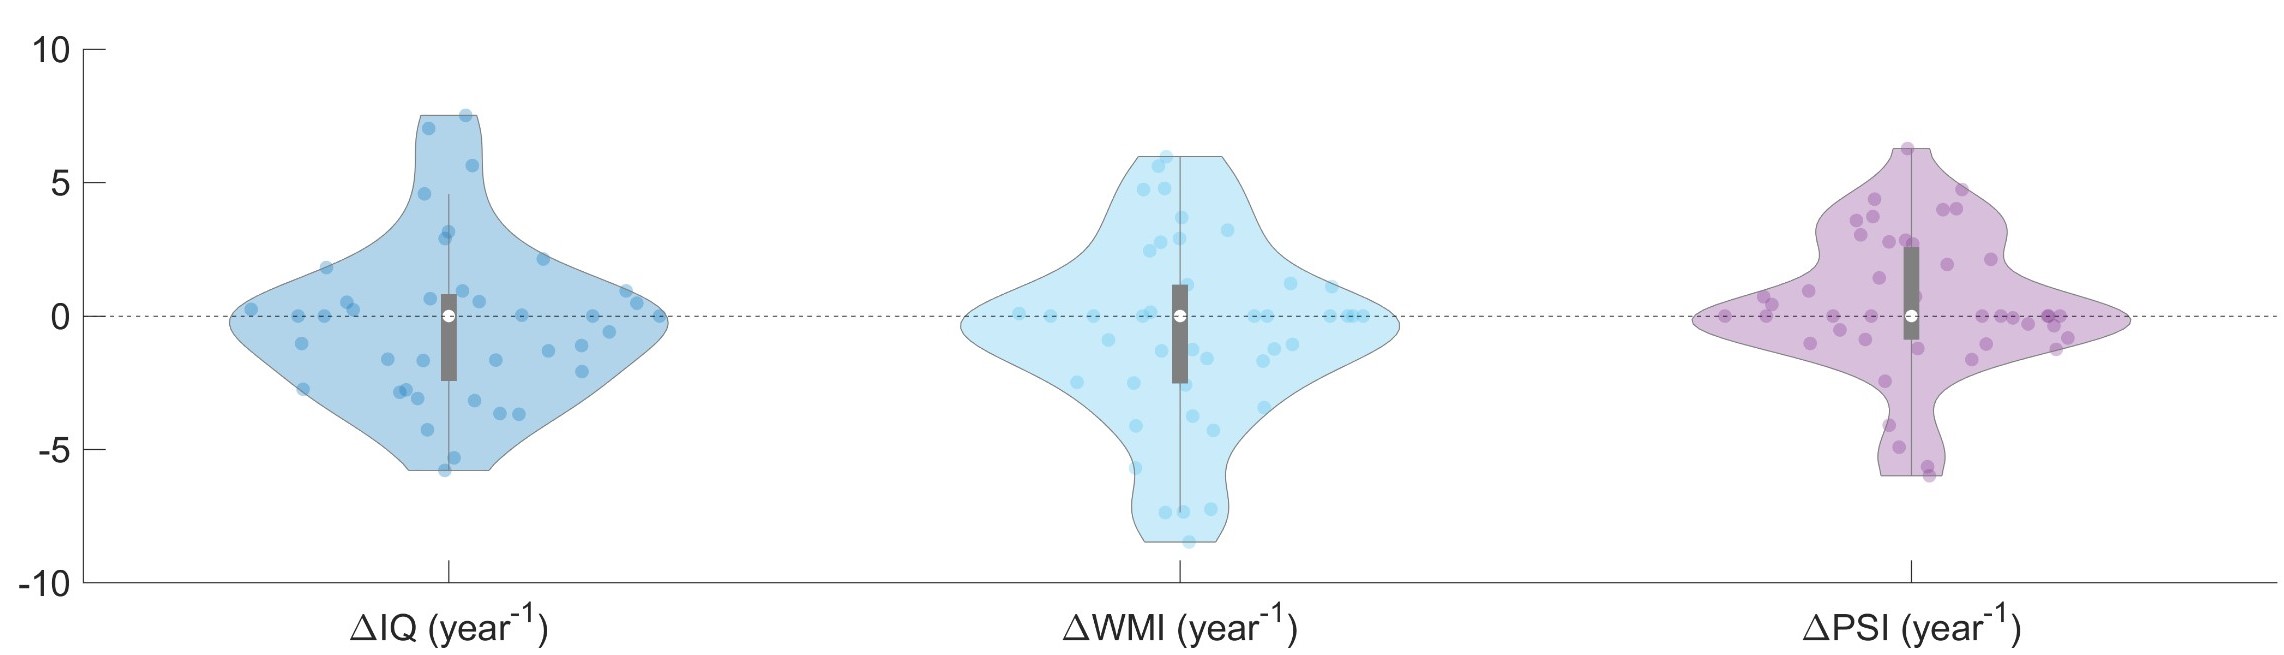
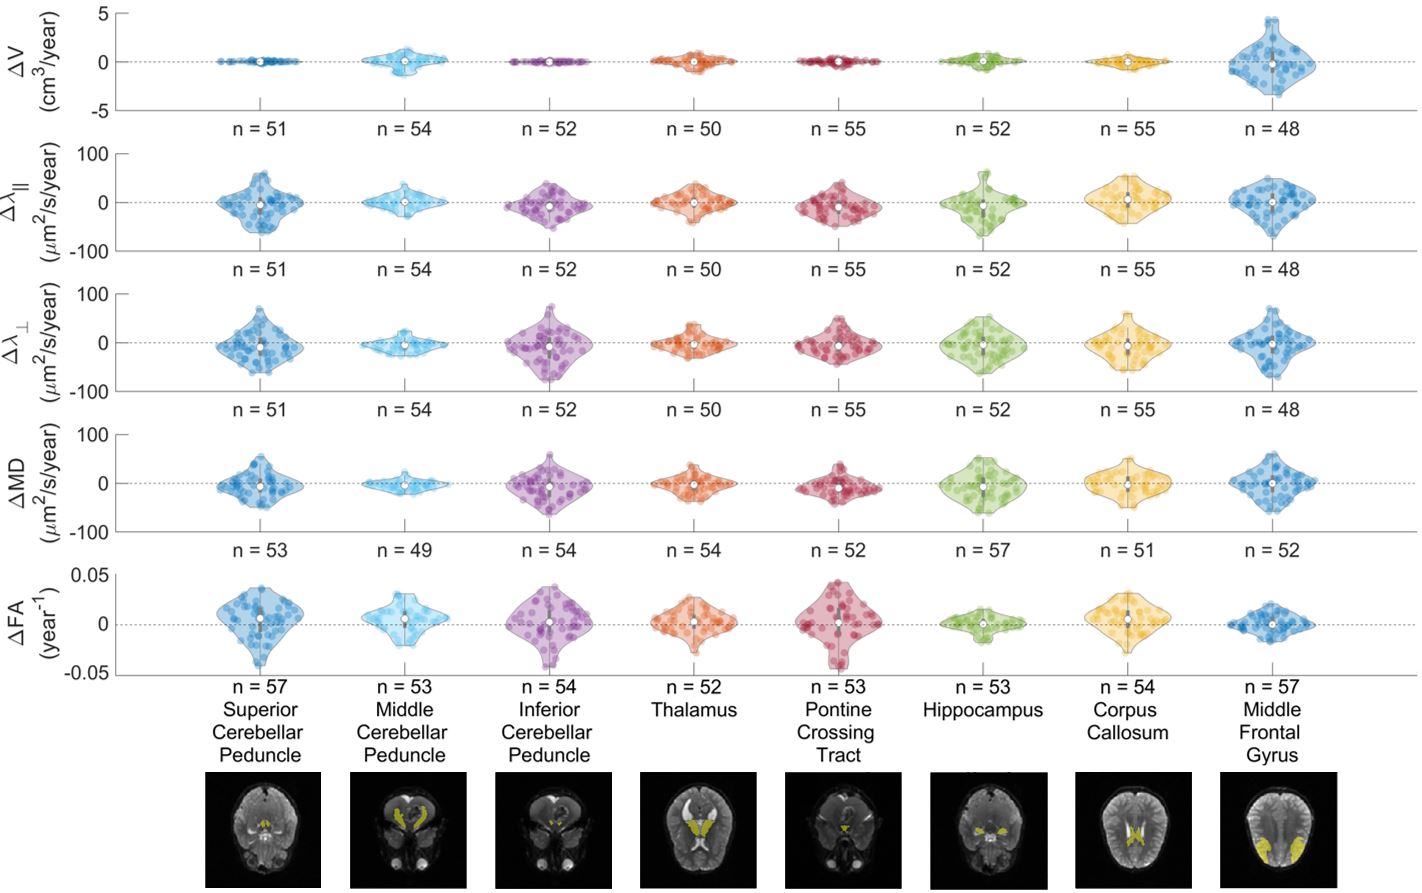
Longitudinal change in all cognitive measures demonstrated a mean slope of zero ranging between -5.7 to 7.5 for ΔIQ, -8.5 to 6.0 for ΔWMI, and -6.0 to 6.3 for ΔPSI (Figure 2). In general, longitudinal change in substructure DTI (Figure 3) demonstrated a mean positive slope for ΔFA and mean negative slope for ΔMD. The strongest correlations between longitudinal change in substructure DTI and neurocognitive outcomes (Figure 4) were calculated between ΔMD in the middle cerebellar peduncle and ΔWMI (R= -0.51), between ΔFA in the inferior cerebellar peduncle and ΔIQ (R=0.47), and between Δλ‖ in the corpus callosum and ΔPSI (R= -0.49).Conclusion
The correlations quantified in this work suggest moderate negative correlations between MD in the middle cerebellar peduncle and WMI, as well as AD in the corpus callosum and PSI, and a positive correlation between FA in the inferior cerebellar peduncle and IQ.Acknowledgements
The authors thank the U.S. Department of Defense (CA220820) and ASTRO-AAPM Physics Residents / Postdoctoral Fellows Seed Grant 2023 for financial support.References
1. Udaka YT, Packer RJ. Pediatric Brain Tumors. Neurol Clin 2018;36:533–556.
2. National Cancer Institution - SEER. Cancer Stat Facts: Childhood Brain and Other Nervous System Cancer (Ages 0–19). https://seer.cancer.gov/statfacts/html/childbrain.html. Accessed February 5, 2023.
3. Oyefiade A, Paltin I, de Luca CR, et al. Cognitive Risk in Survivors of Pediatric Brain Tumors. Journal of Clinical Oncology 2021;39:1718–1726.
4. Aleksonis HA, Wier R, Pearson MM, et al. Associations among diffusion tensor imaging and neurocognitive function in survivors of pediatric brain tumor: A pilot study. Appl Neuropsychol Child 2021;10:111–122.
5. Chapman CH, Zhu T, Nazem-Zadeh M, et al. Diffusion tensor imaging predicts cognitive function change following partial brain radiotherapy for low-grade and benign tumors. Radiotherapy and Oncology 2016;120:234–240.
6. Choi S, Cunningham DT, Aguila F, et al. DTI at 7 and 3 T: systematic comparison of SNR and its influence on quantitative metrics. Magn Reson Imaging 2011;29:739–751.
7. Han C, Zhao L, Zhong S, et al. A comparison of high b-value vs standard b-value diffusion-weighted magnetic resonance imaging at 3.0 T for medulloblastomas. Br J Radiol 2015;88:20150220.
8. Mori S, Wu D, Ceritoglu C, et al. MRICloud: Delivering High-Throughput MRI Neuroinformatics as Cloud-Based Software as a Service. Comput Sci Eng 2016;18:21–35.
9. Mangin J-F, Poupon C, Clark C, Le Bihan D, Bloch I. Distortion correction and robust tensor estimation for MR diffusion imaging. Med Image Anal 2002;6:191–198.
10. Li Y, Shea SM, Lorenz CH, Jiang H, Chou M-C, Mori S. Image Corruption Detection in Diffusion Tensor Imaging for Post-Processing and Real-Time Monitoring. PLoS One 2013;8:e49764.
11. Tang X, Yoshida S, Hsu J, et al. Multi-Contrast Multi-Atlas Parcellation of Diffusion Tensor Imaging of the Human Brain. PLoS One 2014;9:e96985.
12. Fedorov A, Beichel R, Kalpathy-Cramer J, et al. 3D Slicer as an image computing platform for the Quantitative Imaging Network. Magn Reson Imaging 2012;30:1323–1341.
Figures
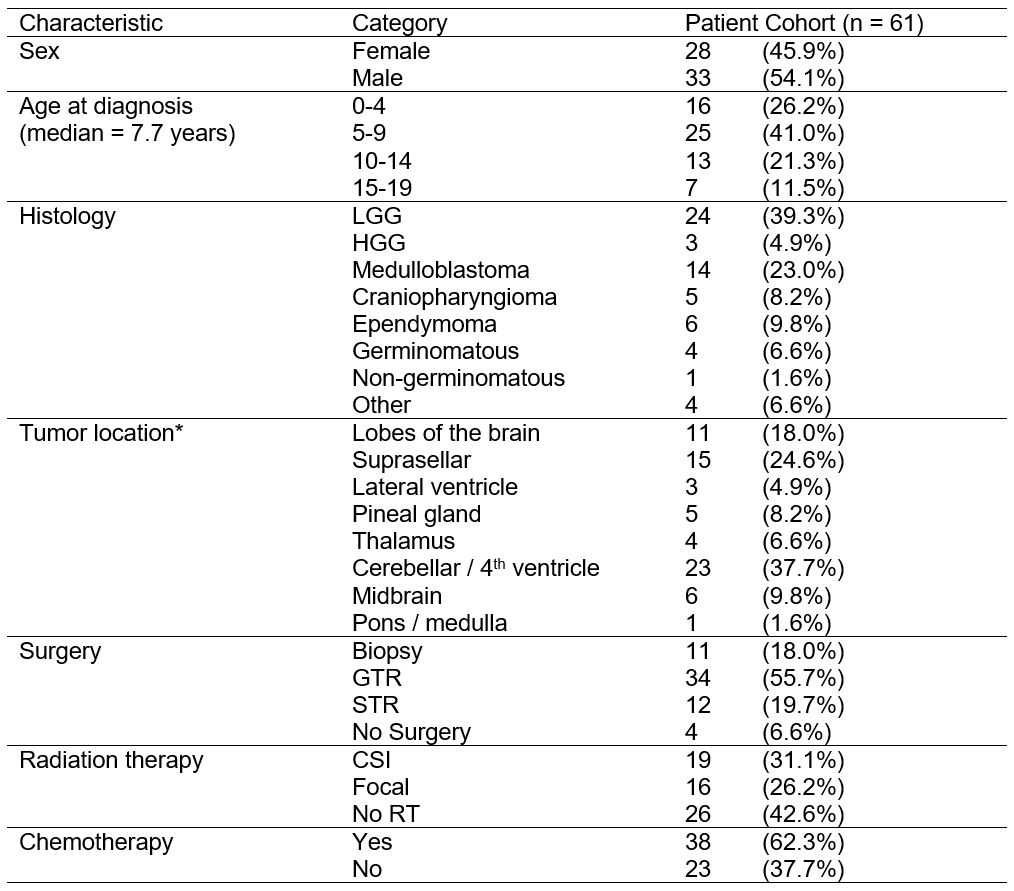
Table 1: Patient demographics and clinical characteristics.
LGG, low-grade glioma; HGG, high-grade glioma; GTR, gross total resection; STR, subtotal resection; CSI, craniospinal irradiation; RT, radiation therapy.
*Note patients with diffuse metastatic disease may have been categorized into multiple tumor location categories.