3486
Linking sub-diffusion model parameters and brain cell morphometrics1School of Mathematical Sciences, Queensland University of Technology, Brisbane, Australia, 2Centre for Biomedical Technologies, Queensland University of Technology, Brisbane, Australia, 3Centre for Data Science, Queensland University of Technology, Brisbane, Australia, 4Centre for Advanced Imaging, University of Queensland, Brisbane, Australia, 5ARC Training Centre for Innovation in Biomedical Imaging Technology, Brisbane, Australia, 6Cardiff University Brain Research Imaging Centre, School of Psychology, Cardiff University, Cardiff, United Kingdom, 7School of Computer Science and Informatics, Cardiff University, Cardiff, United Kingdom
Synopsis
Keywords: Simulation/Validation, Signal Representations, sub-diffusion model, brain cell morphology
Motivation: The diffusion MRI signal in brain tissues can be modelled as a sub-diffusion process. The connection between sub-diffusion model parameters and microstructure of brain cells is yet to be explored.
Goal(s): The research aims to investigate the link between sub-diffusion model parameters and brain cell morphometrics.
Approach: Monte Carlo simulations are performed for representative brain cell types. The sub-diffusion model are then fitted to the simulated diffusion MRI data for each cell type.
Results: Results reveal that the sub-diffusion model parameters are sensitive to the branch order of the cell, with higher parameter values indicating higher branch order.
Impact: This is the first study to investigate how the sub-diffusion model parameters link to brain cell morphometrics. Our findings may provide new opportunities in diffusion MRI, where cell morphology and potentially cell type are of interest.
Introduction
In biological tissue, the motion of water molecules is restricted and hindered by microstructures with different characteristic length scales, and hence, the apparent diffusion is considerably slower than that of free diffusion. This sub-diffusive behaviour can be mathematically described by the continuous time random walk (CTRW) theory1. In diffusion MRI, the sub-diffusion model has been studied as a signal representation by many researchers2-13. In this work, using numerical simulations, we investigate the link between the sub-diffusion model parameters and brain cell morphology.Methods
Sub-diffusion modelIn diffusion MRI, the sub-diffusion model can be expressed in terms of $$$q$$$-values ($$$q=\gamma \delta G$$$, where $$$\gamma$$$ is the hydrogen gyromagnetic ratio, $$$\delta$$$ is diffusion gradient pulse duration and $$$G$$$ is its amplitude) and effective diffusion time $$$\bar\Delta=\Delta-\delta/3$$$ (where $$$\Delta$$$ is diffusion gradient pulse separation)
$$S(q,\bar\Delta)=S_0E_\beta(-D_\beta q^2\bar\Delta^\beta), \quad 0<\beta\leq1, \quad\quad (1)$$
or equivalently as a function of b-values
$$S(b)=S_0E_\beta(-bD_{SUB}), \quad 0<\beta\leq1. \quad\quad (2)$$
Here, $$$S_0$$$ is the signal intensity when $$$b=0$$$, $$$E_\beta(z)=\sum^\infty_{k=0}\frac{z^k}{\Gamma(1+\beta k)}$$$ is the Mittag-Leffler function (the exponential function is produced when $$$\beta=1$$$), $$$\beta$$$ characterises the distribution of waiting times between jumps in the CTRW theory, $$$D_\beta$$$ is the generalised diffusion coefficient in units of mm2/s$$$\beta$$$, and $$$D_{SUB}=D_\beta\bar\Delta^{\beta-1}$$$ is the apparent diffusivity in units of mm2/s.
Simulated diffusion-weighted MRI data
Monte Carlo simulations are performed using CAMINO14-16 with 10,000 spins and 2000 time steps. Diffusion MRI data is generated for five representative brain cell types (granule, microglia, astrocytes, oligodendrocytes, and Purkinje), using the following parameters: G = [0 10 20 30 40 50 60 70 80 100 200 300 400 500] mT/m, 128 diffusion encoding directions, $$$\delta=2$$$ ms, producing two datasets one based on $$$\Delta=10$$$ ms and the other on $$$\Delta=15$$$ ms. Cell structures are obtained from neuromorpho.org.
Parameter estimation
We use the lsqcurvefit function in MATLAB (Mathworks, Version 2023b) to fit Eq.(1) to the directionally averaged signal for each cell. For the fitting strategy and benefits of fitting multiple diffusion time data the reader is referred to Farquhar et al. (2023). To estimate the parameters for each cell type, we first calculate the volume-weighted averaged signal as
$$S_{cell~ type}=\frac{\sum^4_{i=1}S_{cell_i}V_{cell_i}}{\sum^4_{i=1}V_{cell_i}}, \quad\quad (3)$$
and then fit Eq.(1) to the signal (3) for each cell type.
To estimate the parameters for a voxel in cerebellar cortex, we use the following equation to generate signals for a range of volume fractions for intra-cellular spaces ($$$f_{intra}$$$), granule cells ($$$f_{granule}$$$) and Purkinje cells ($$$1-f_{granule}$$$)
$$S_{voxel}=f_{intra}(f_{granule} S_{granule} + (1-f_{granule})S_{Purkinje}) + (1-f_{intra}) S_{extra}, \quad\quad (4)$$
where $$$S_{granule}$$$ and $$$S_{Purkinje}$$$ are computed from (3), and $$$S_{extra}=\exp(-bD_{extra})$$$ with $$$D_{extra}=0.8$$$ mm2/s.
Morphometrics
The morphometrics of each brain cell (including branch order, branch length, branch tortuosity and total length along paths) are estimated using the TREES toolbox17.
Results
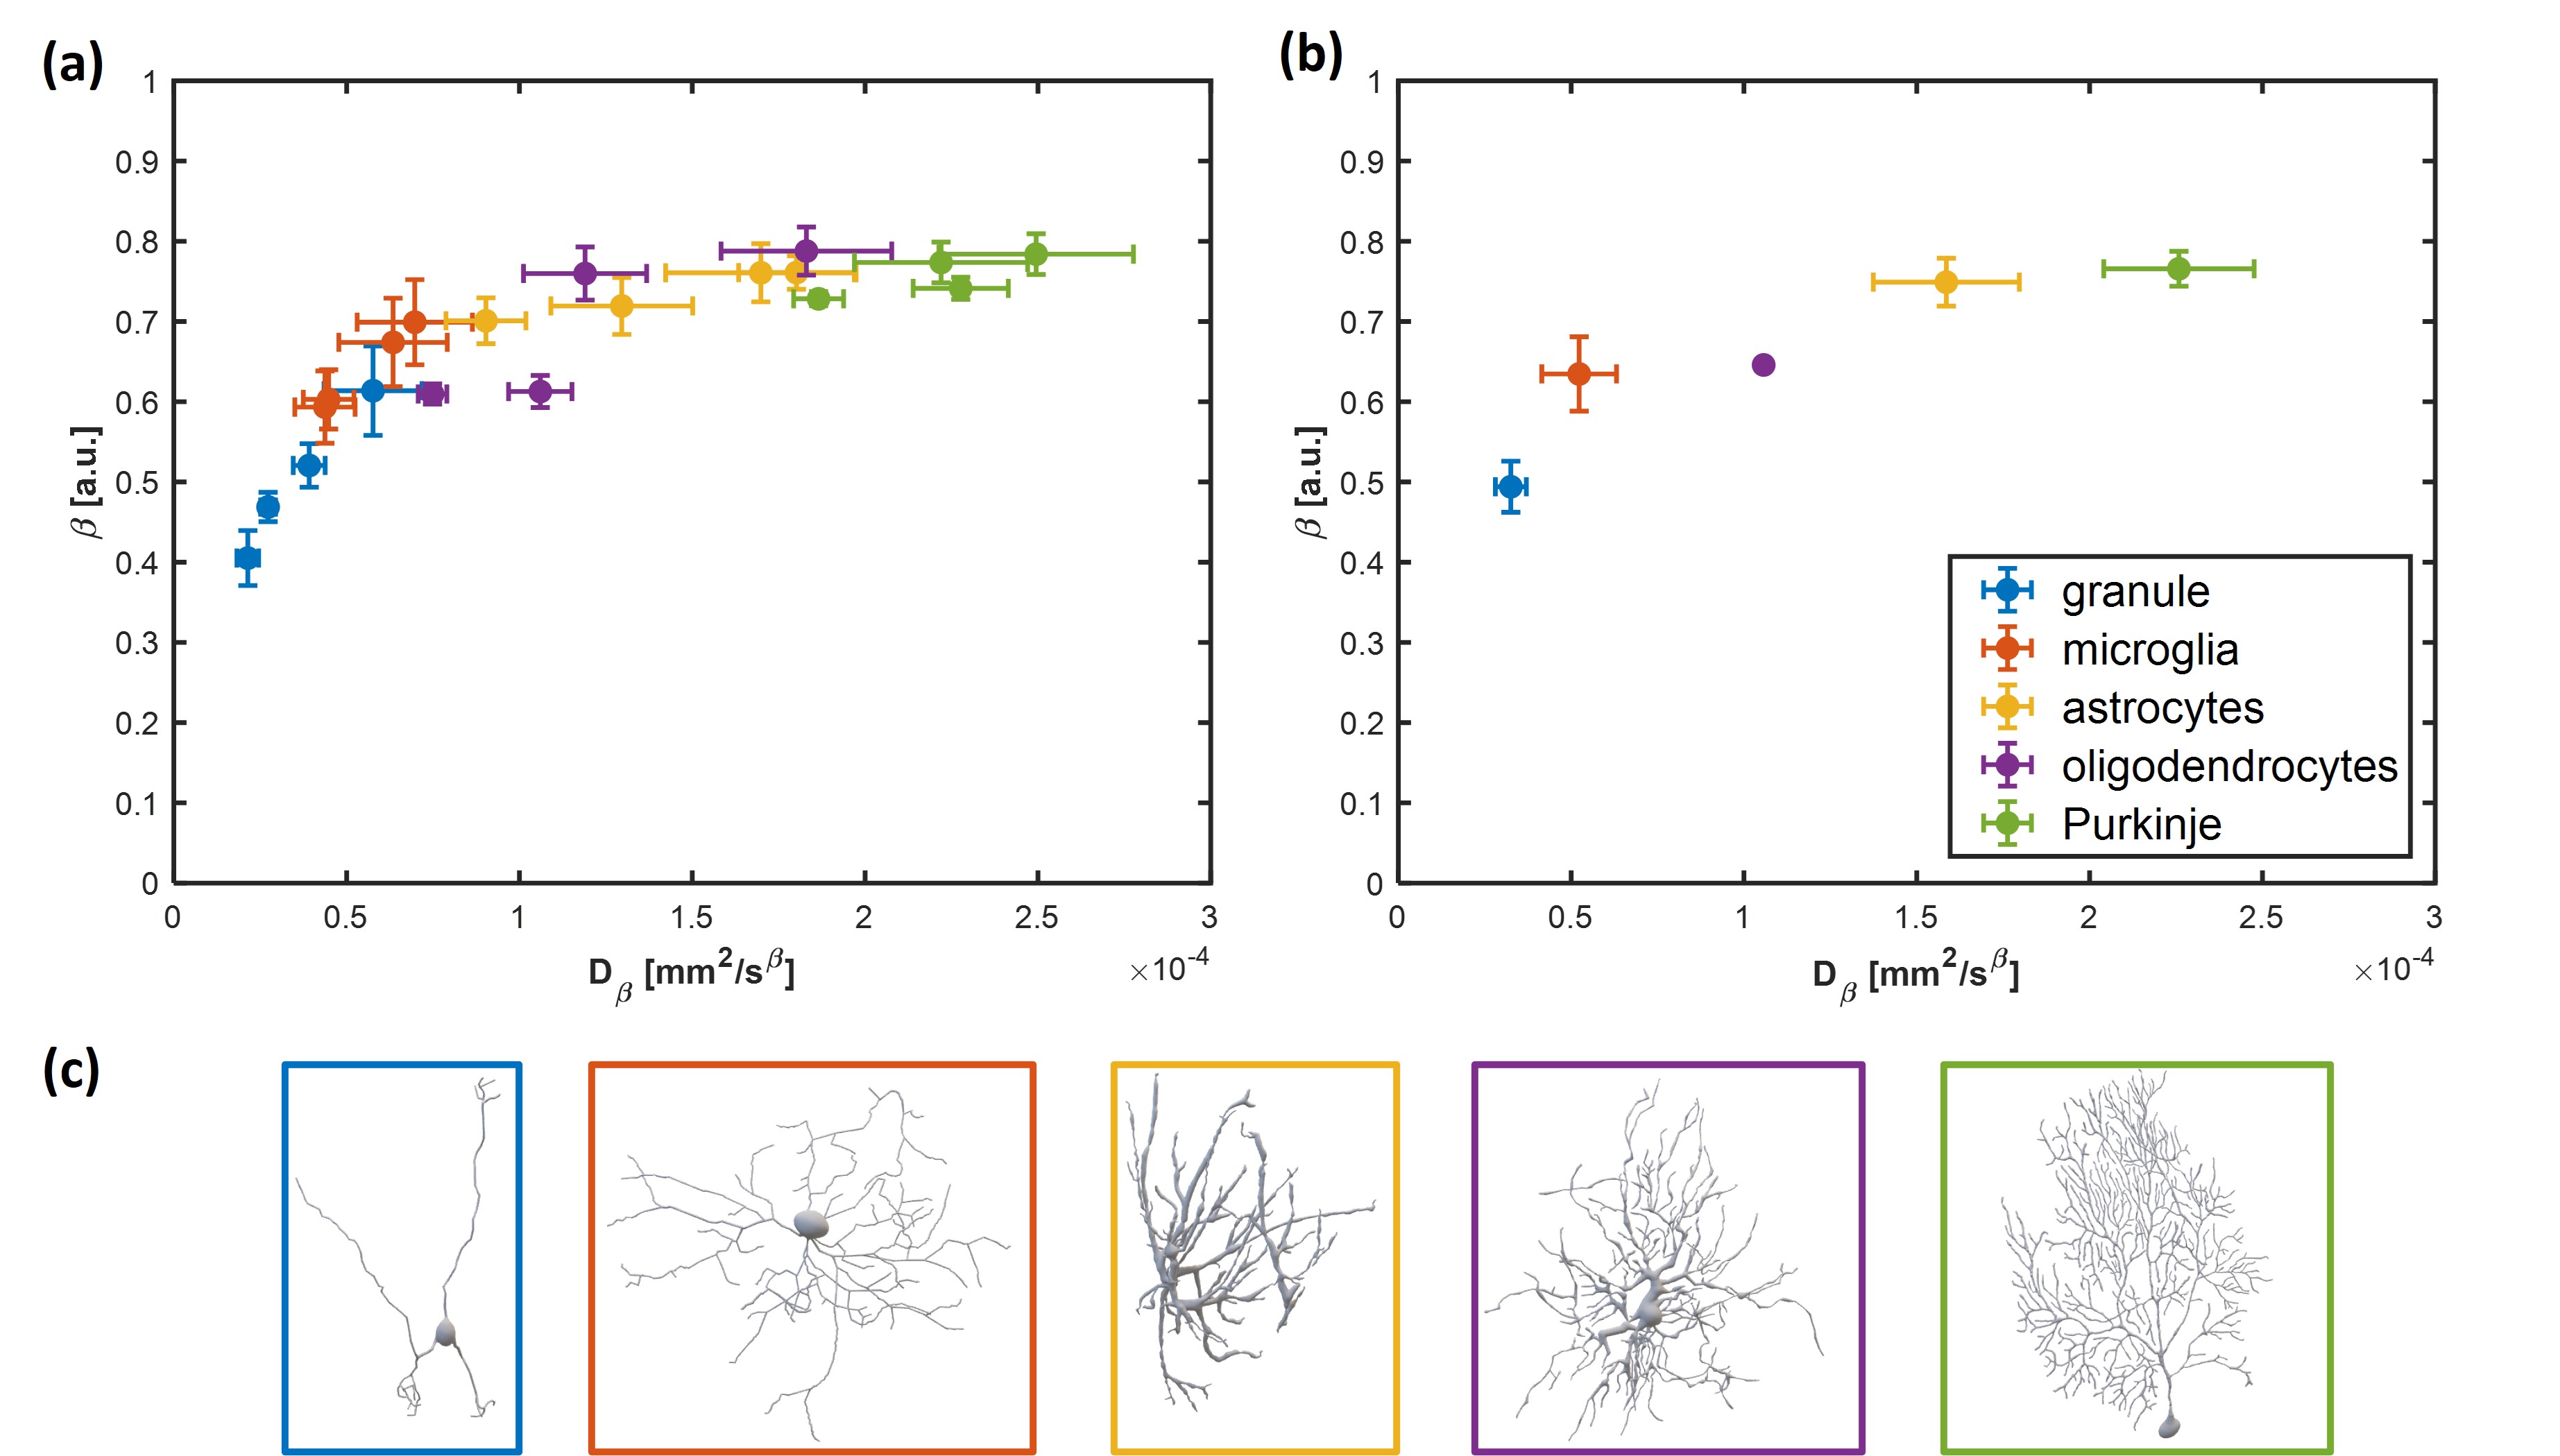
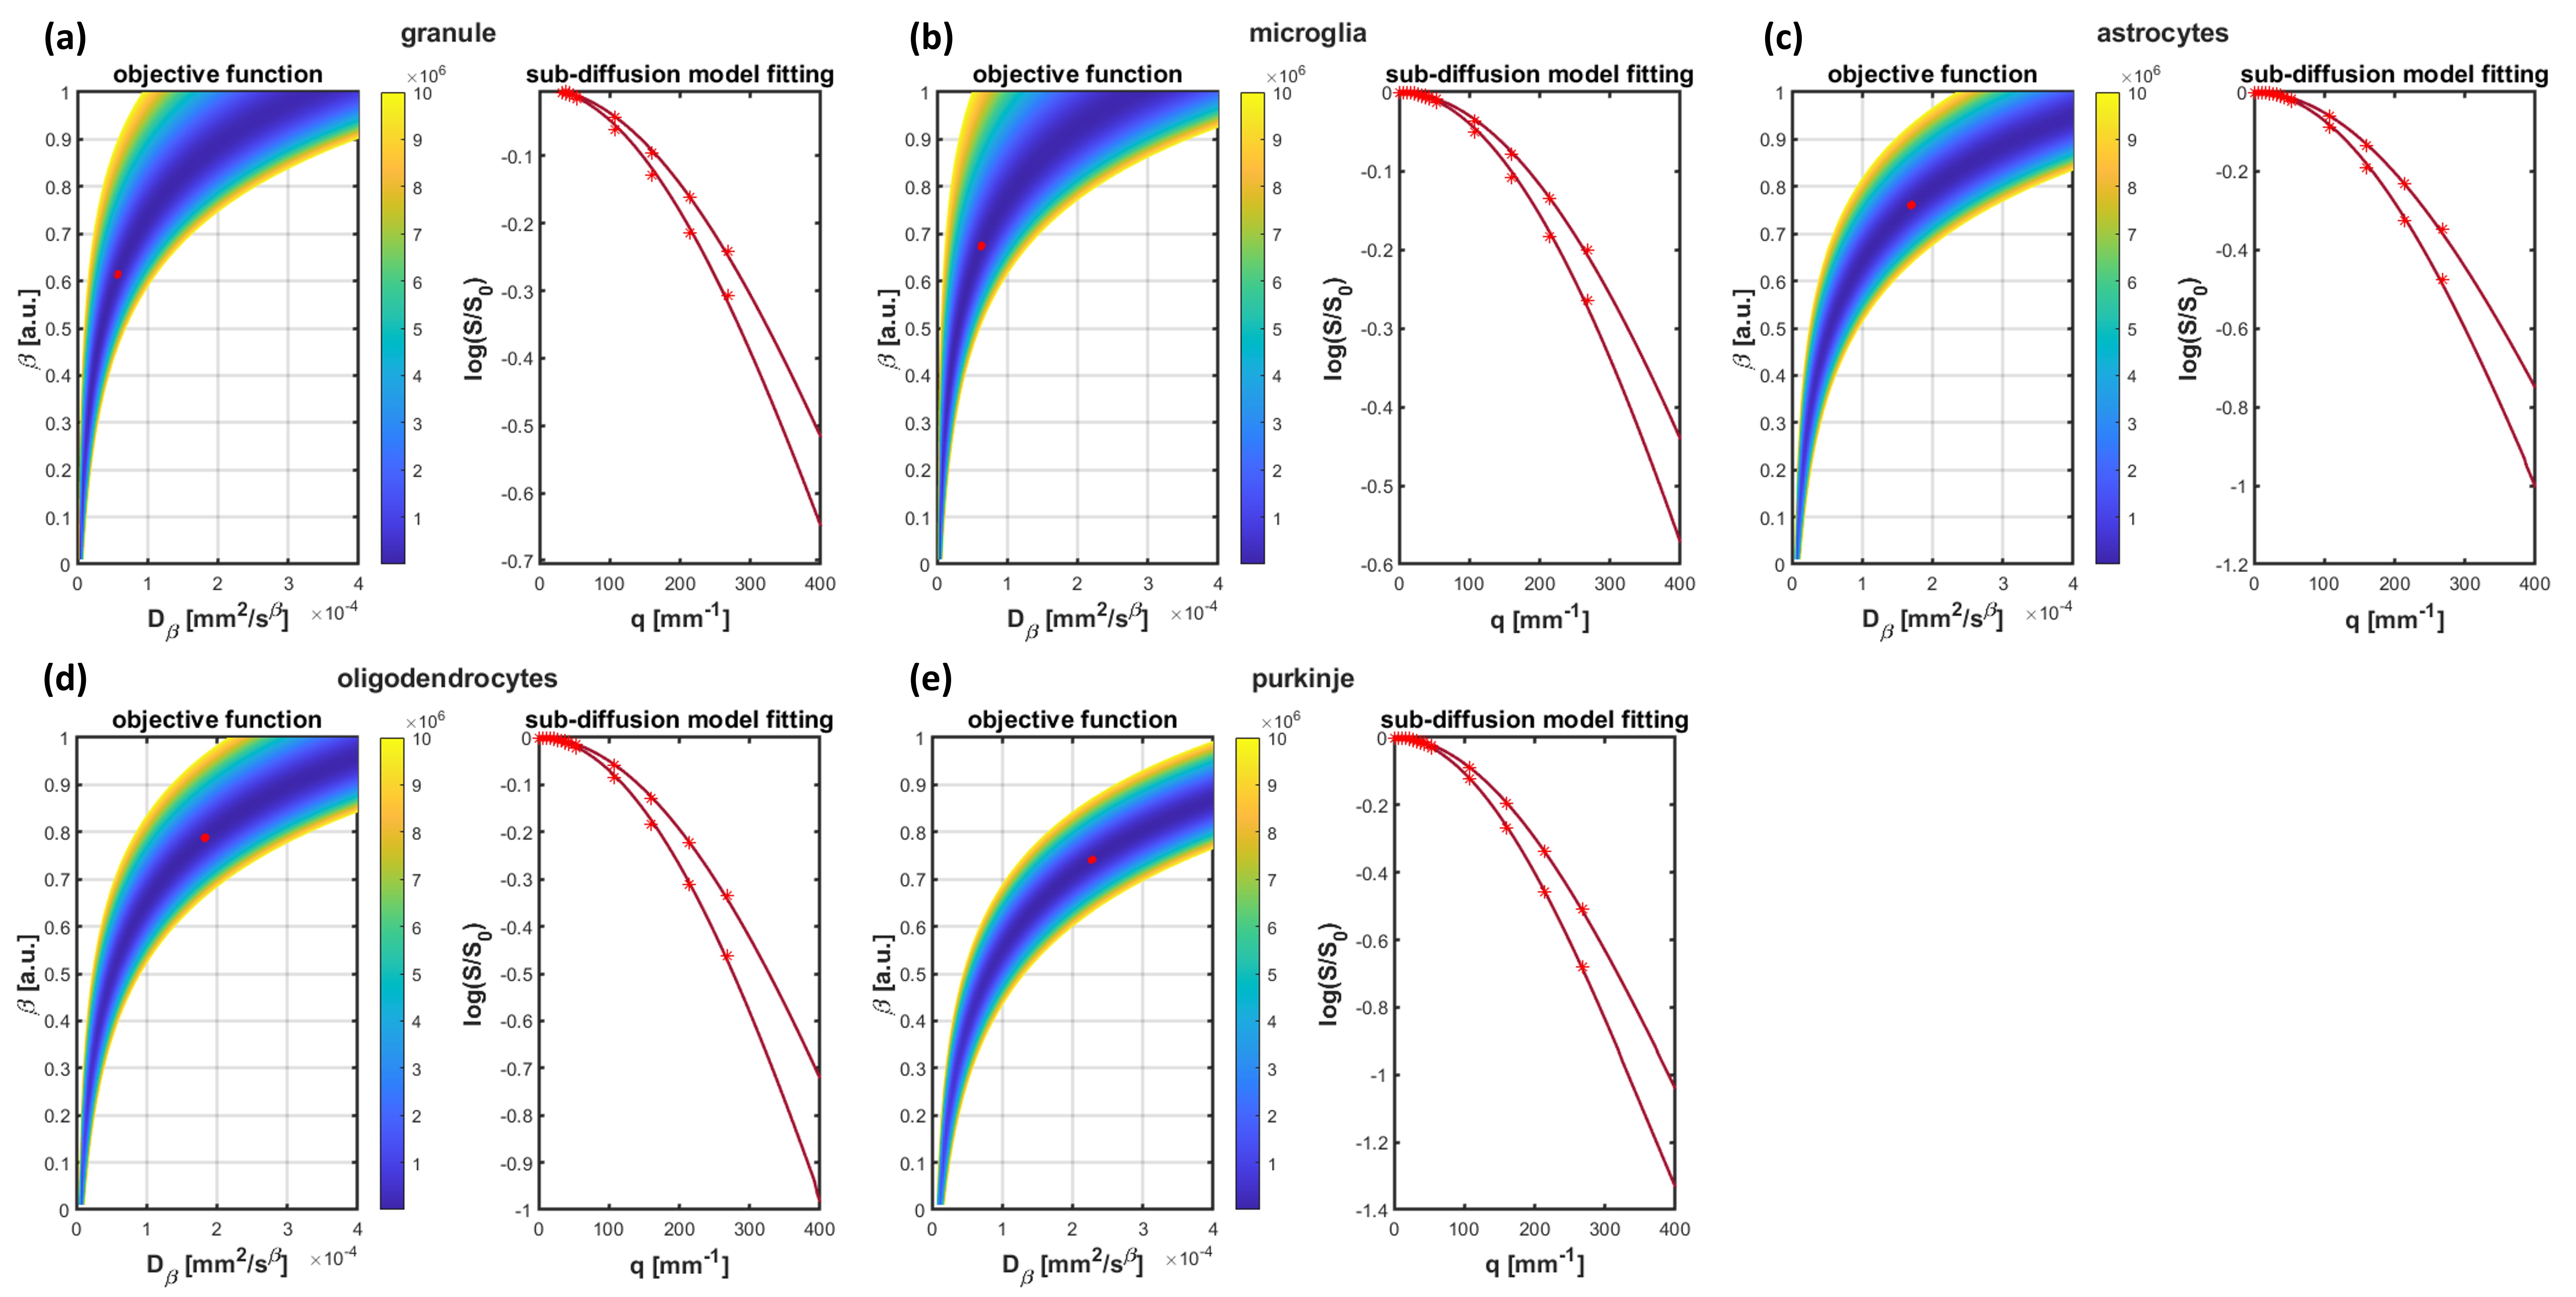
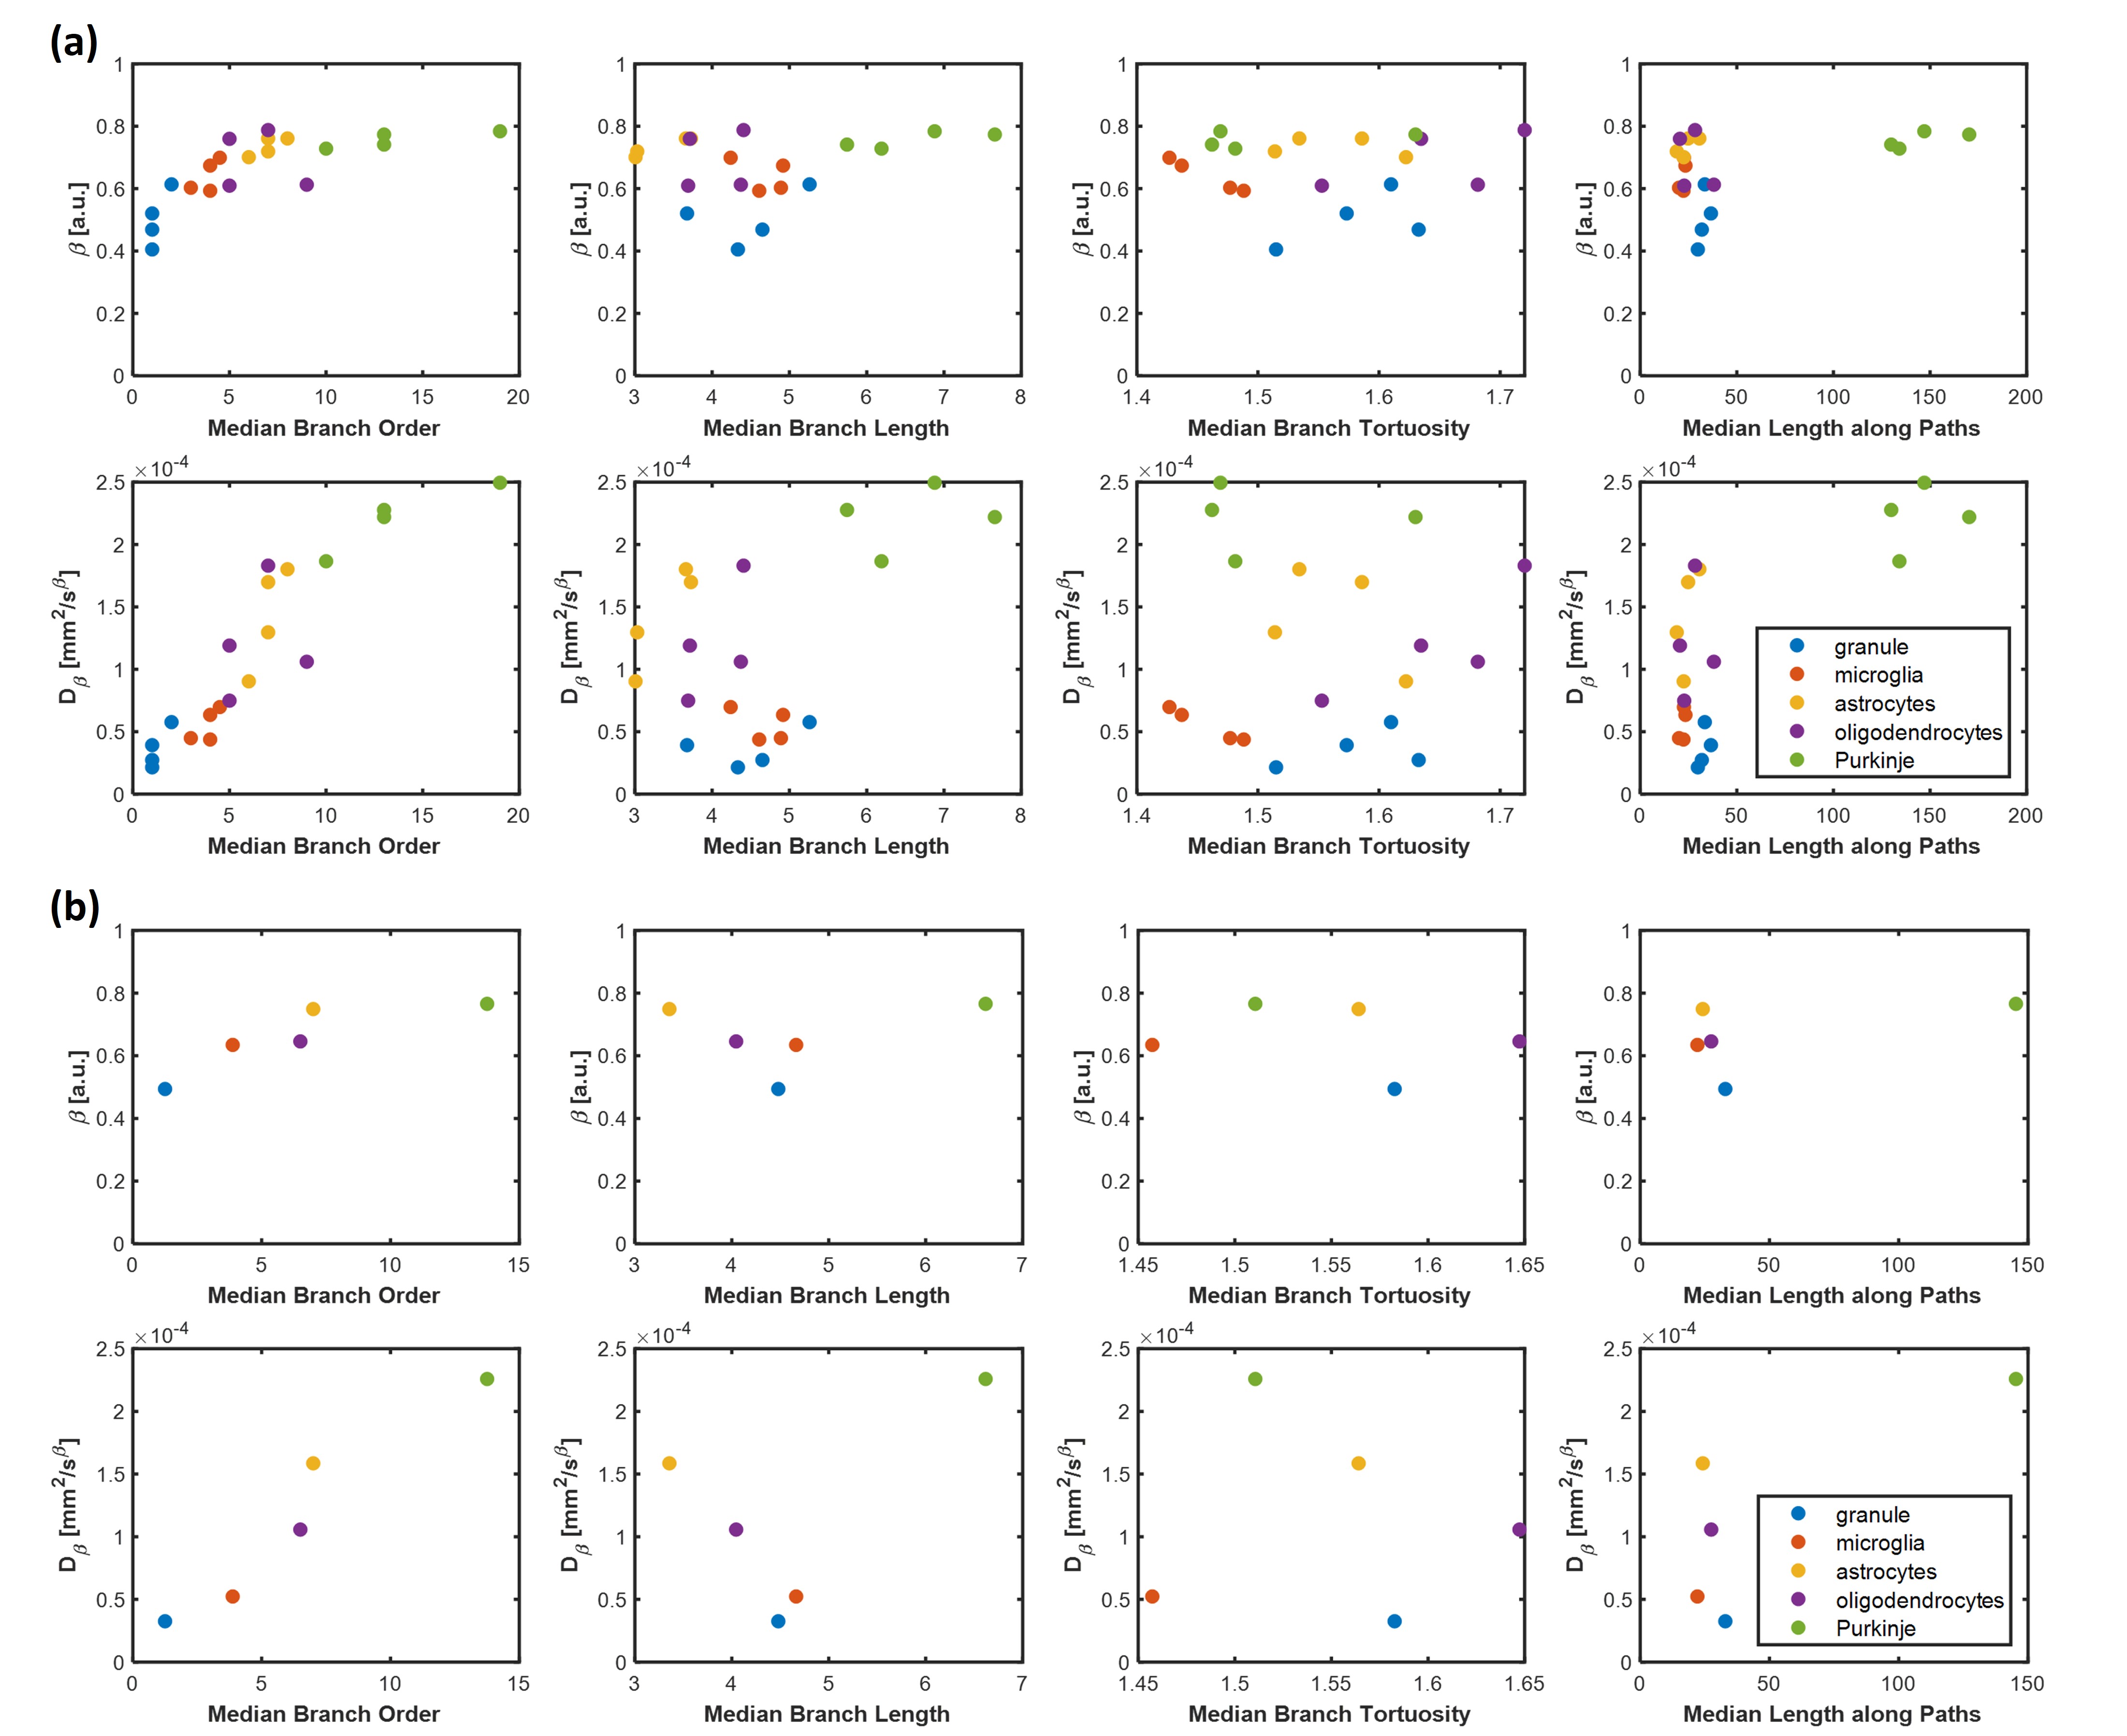
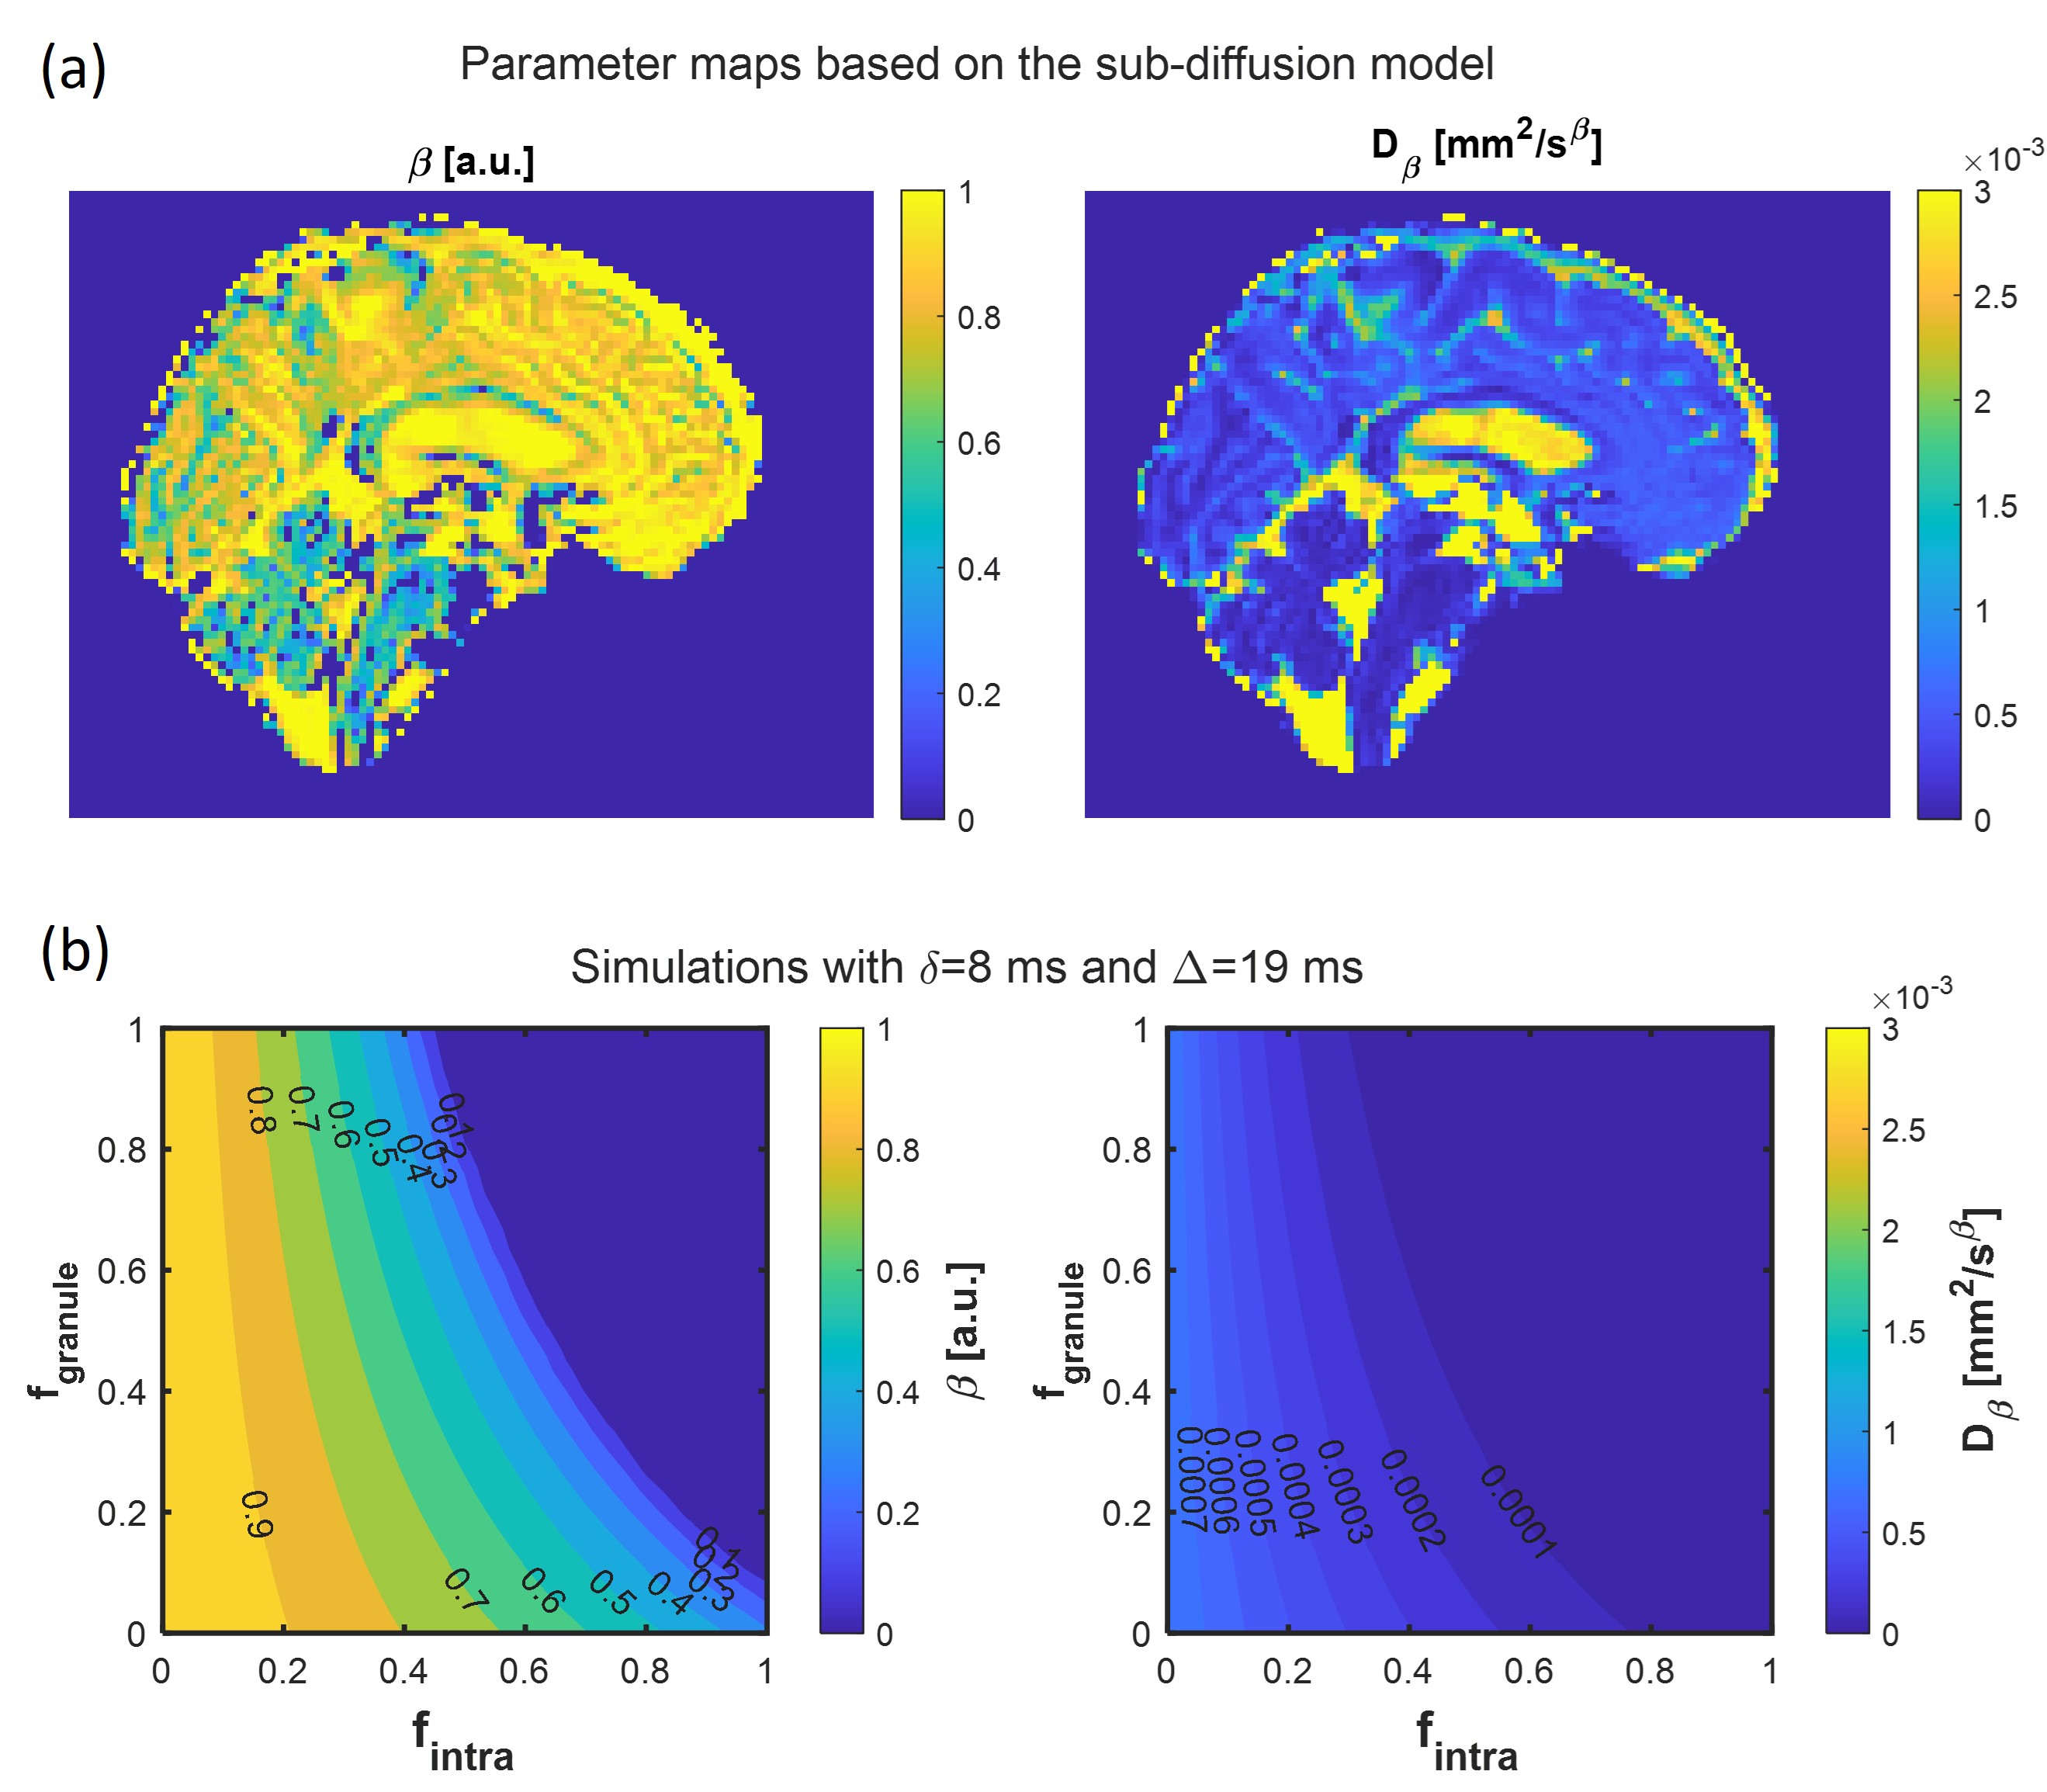
The sub-diffusion parameters, $$$\beta$$$ and $$$D_\beta$$$, along with 90% confidence intervals, are shown for each cell in Figure 1(a), and for each cell type in Figure 1(b). Representative structures for each cell type are displayed in Figure 1(c). Figure 2 illustrates the objective function and the fitted curves of the sub-diffusion model for one representative cell in each cell type. Figure 3(a) shows how the sub-diffusion model parameters relate to different cell morphometrics for each cell, and Figure 3(b) shows the same relationship for the average values of each cell type. Figure 4(a) shows the $$$\beta$$$ and $$$D_\beta$$$ values obtained from fitting the MGH Connectome 1.0 data, and Figure 4(b) presents these parameters obtained from simulated data in a voxel (3) for a range of volume fractions for the intra-cellular spaces and granule cells.Discussion
The sub-diffusion model parameters, $$$\beta$$$ and $$$D_\beta$$$, show a clear link with the cell complexity, especially with the branch order: larger $$$\beta$$$ and $$$D_\beta$$$ values correspond to larger branch order. For example, granule cells have a simpler structure and lower branch order than Purkinje cells, leading to a more limited diffusion environment and resulting in smaller $$$\beta$$$ and $$$D_\beta$$$ values than Purkinje cells. Granule cells and Purkinje cells are mostly concentrated in the cerebellum. A direct comparison of our simulation results with $$$\beta$$$ and $$$D_\beta$$$ estimates from MGH Connectome 1.0 data collected at ultra-high b values is shown in Fig.4. The observed ($$$\beta$$$, $$$D_\beta$$$) values in the cerebellar cortex (0.42, 1.1x10⁻⁴) are compatible with a simulated scenario of a voxel mostly comprised of intracellular water and granule cells, which agrees with the known neuroanatomy of the cerebellar cortex.Conclusion
Our finding suggests that the sub-diffusion model parameters are sensitive to the morphology and complexity of brain cells. This work can be extended for cells with disordered/diseased structures in the future.Acknowledgements
QY is supported by the Australian Research Council (ARC) Discovery Early Career Research Award DE150101842. QY and VV acknowledge the support of the Australian Research Council (ARC) Discovery Project Award DP190101889. MP is supported by UKRI Future Leaders Fellowship MR/T020296/2.References
1. Metzler R, Klafter J. The random walk’s guide to anomalous diffusion: a fractional dynamics approach. Phys Rep, 2000.
2. Capuani S, Palombo M, Gabrielli A, Orlandi A, Maraviglia B, Pastore FS. Spatio-temporal anomalous diffusion imaging: results in controlled phantoms and in excised human meningiomas, Magnetic Resonance Imaging, Volume 31, Issue 3, 2013.
3. Magin R, Hall M, Karaman M, Vegh V. Fractional Calculus Models of Magnetic Resonance Phenomena: Relaxation and Diffusion. Critical Reviews™ in Biomedical Engineering, Volume 48, Issue 5, 2020, pp. 285-326.
4. Ingo C, Magin RL, Colon-Perez L, Triplett W, Mareci TH. On random walks and entropy in diffusion-weighted magnetic resonance imaging studies of neural tissue. Magn Reson Med. 2014 Feb;71(2):617-27. doi: 10.1002/mrm.24706. PMID: 23508765; PMCID: PMC4930657.
5. Ingo C, Sui Y, Chen Y, Parrish TB, Webb AG and Ronen I. Parsimonious continuous time random walk models and kurtosis for diffusion in magnetic resonance of biological tissue. Front. Phys. 3:11, 2015.
6. M. Palombo, A. Gabrielli, S. De Santis, C. Cametti, G. Ruocco, S. Capuani; Spatio-temporal anomalous diffusion in heterogeneous media by nuclear magnetic resonance. J. Chem. Phys. 21 July 2011; 135 (3): 034504.
7. GadElkarim JJ et al., "Fractional Order Generalization of Anomalous Diffusion as a Multidimensional Extension of the Transmission Line Equation," in IEEE Journal on Emerging and Selected Topics in Circuits and Systems, vol. 3, no. 3, pp. 432-441, Sept. 2013, doi: 10.1109/JETCAS.2013.2265795.
8. Capuani S, Palombo M. Mini Review on Anomalous Diffusion by MRI: Potential Advantages, Pitfalls, Limitations, Nomenclature, and Correct Interpretation of Literature, Front. Phys., 2020.
9. Palombo M, Barbetta A, Cametti C, Favero G, Capuani S. Transient Anomalous Diffusion MRI Measurement Discriminates Porous Polymeric Matrices Characterized by Different Sub-Microstructures and Fractal Dimension. Gels. 2022; 8(2):95. https://doi.org/10.3390/gels8020095.
10. Bueno-Orovio A, Teh I, Schneider JE, Burrage K, Grau V. Anomalous Diffusion in Cardiac Tissue as an Index of Myocardial Microstructure. IEEE Trans Med Imaging. 2016 Sep;35(9):2200-2207. doi: 10.1109/TMI.2016.2548503. Epub 2016 May 2. PMID: 27164578.
11. Yang Q, Puttick S, Bruce ZC, Day BW, Vegh V. Investigation of changes in anomalous diffusion parameters in a mouse model of brain tumour. Computational Diffusion MRI, 161-172, 2020.
12. Yang Q, Reutens DC, Vegh V. Generalisation of continuous time random walk to anomalous diffusion MRI models with an age-related evaluation of human corpus callosum, NeuroImage, Volume 250, 2022.
13. Farquhar ME, Yang Q, Vegh V. Robust, fast and accurate mapping of diffusional mean kurtosis. eLife, 12:RP90465, 2023. https://doi.org/10.7554/eLife.90465.1
14. Cook PA, Bai Y, Nedjati-Gilani S, Seunarine KK, Hall MG, Parker GJ, Alexander DC. Camino: Open-Source Diffusion-MRI Reconstruction and Processing, 14th Scientific Meeting of the International Society for Magnetic Resonance in Medicine, Seattle, WA, USA, p. 2759, May 2006.
15. Hall MG, Alexander DC. Convergence and Parameter Choice for Monte-Carlo Simulations of Diffusion MRI. IEEE Transactions on Medical Imaging 28(9), 1354-13642, 2009.
16. Panagiotaki E, Schneider T, Siow B, Hall MG, Lythgoe MF, and Alexander DC. Compartment models of the diffusion MR signal in brain white matter: A taxonomy and comparison NeuroImage, 59(3), 2241-2254, 2012.
17. Cuntz H, Forstner F, Borst A, Häusser M. One rule to grow them all: A general theory of neuronal branching and its practical application. PLoS Comput Biol 6(8): e1000877, 2010.
Figures