3485
The “recipe” to know the type of dynamics “before” applying the diffusion models: application in water-soluble polymer1Physics Dpt Sapienza University of Rome, National Research Council, Institute for Complex Systems (CNR-ISC), Rome, Italy, 2Physics, Sapienza University of Rome, Rome, Italy, 3Earth Sciences, Sapienza University of Rome, Rome, Italy, 4Environmental Biology, Sapienza University of Rome, Rome, Italy
Synopsis
Keywords: Simulation/Validation, Validation, Brownian Motion, Fractional Brownian Motion, Super-Statistics, dynamics, Polymer solution
Motivation: Currently, diffusion models are applied without knowing the type of dynamics a priori. The risk is to quantify parameters that do not reflect the dynamics of the system.
Goal(s): Here we show that it is possible to carry out a preliminary check to know the type of dynamics a priori.
Approach: We tested our recipe in 40% w/w Poly(ethylene glycol) (PEG) water-solution using PGSTE at different big Delta, little Delta and gradient strength.
Results: We showed that both water and PEG CH2 showed a Super-Statistic dynamic while the dynamics of the OH tail of PEG is an unknown process.
Impact: Currently, diffusion models are applied without knowing the type of dynamics a priori. We introduce a recipe to know the type of dynamics. This method avoids the quantification of diffusion-parameters that do not reflect the true diffusion of the system.
INTRODUCTION
Recently we provided a useful toolkit for an NMR scientist who is facing the twofold problem of using the correct fitting formula for the PFG NMR attenuation and, at the same time, inferring the underlying details of the molecular dynamics1,2. We provide a “recipe” that can help to understand the type of dynamics “before” applying the diffusion models, or the (dynamical) domain of applicability of a certain microscopical model. We tested the recipe in Poly(ethylene glycol) (PEG) a typical water-soluble polymer, of much interest in medical and biological science applications as well as polymer physics. In order to utilize PEGs further in medical and biological products, a precise knowledge of their physical-dynamics properties is required.METHODS
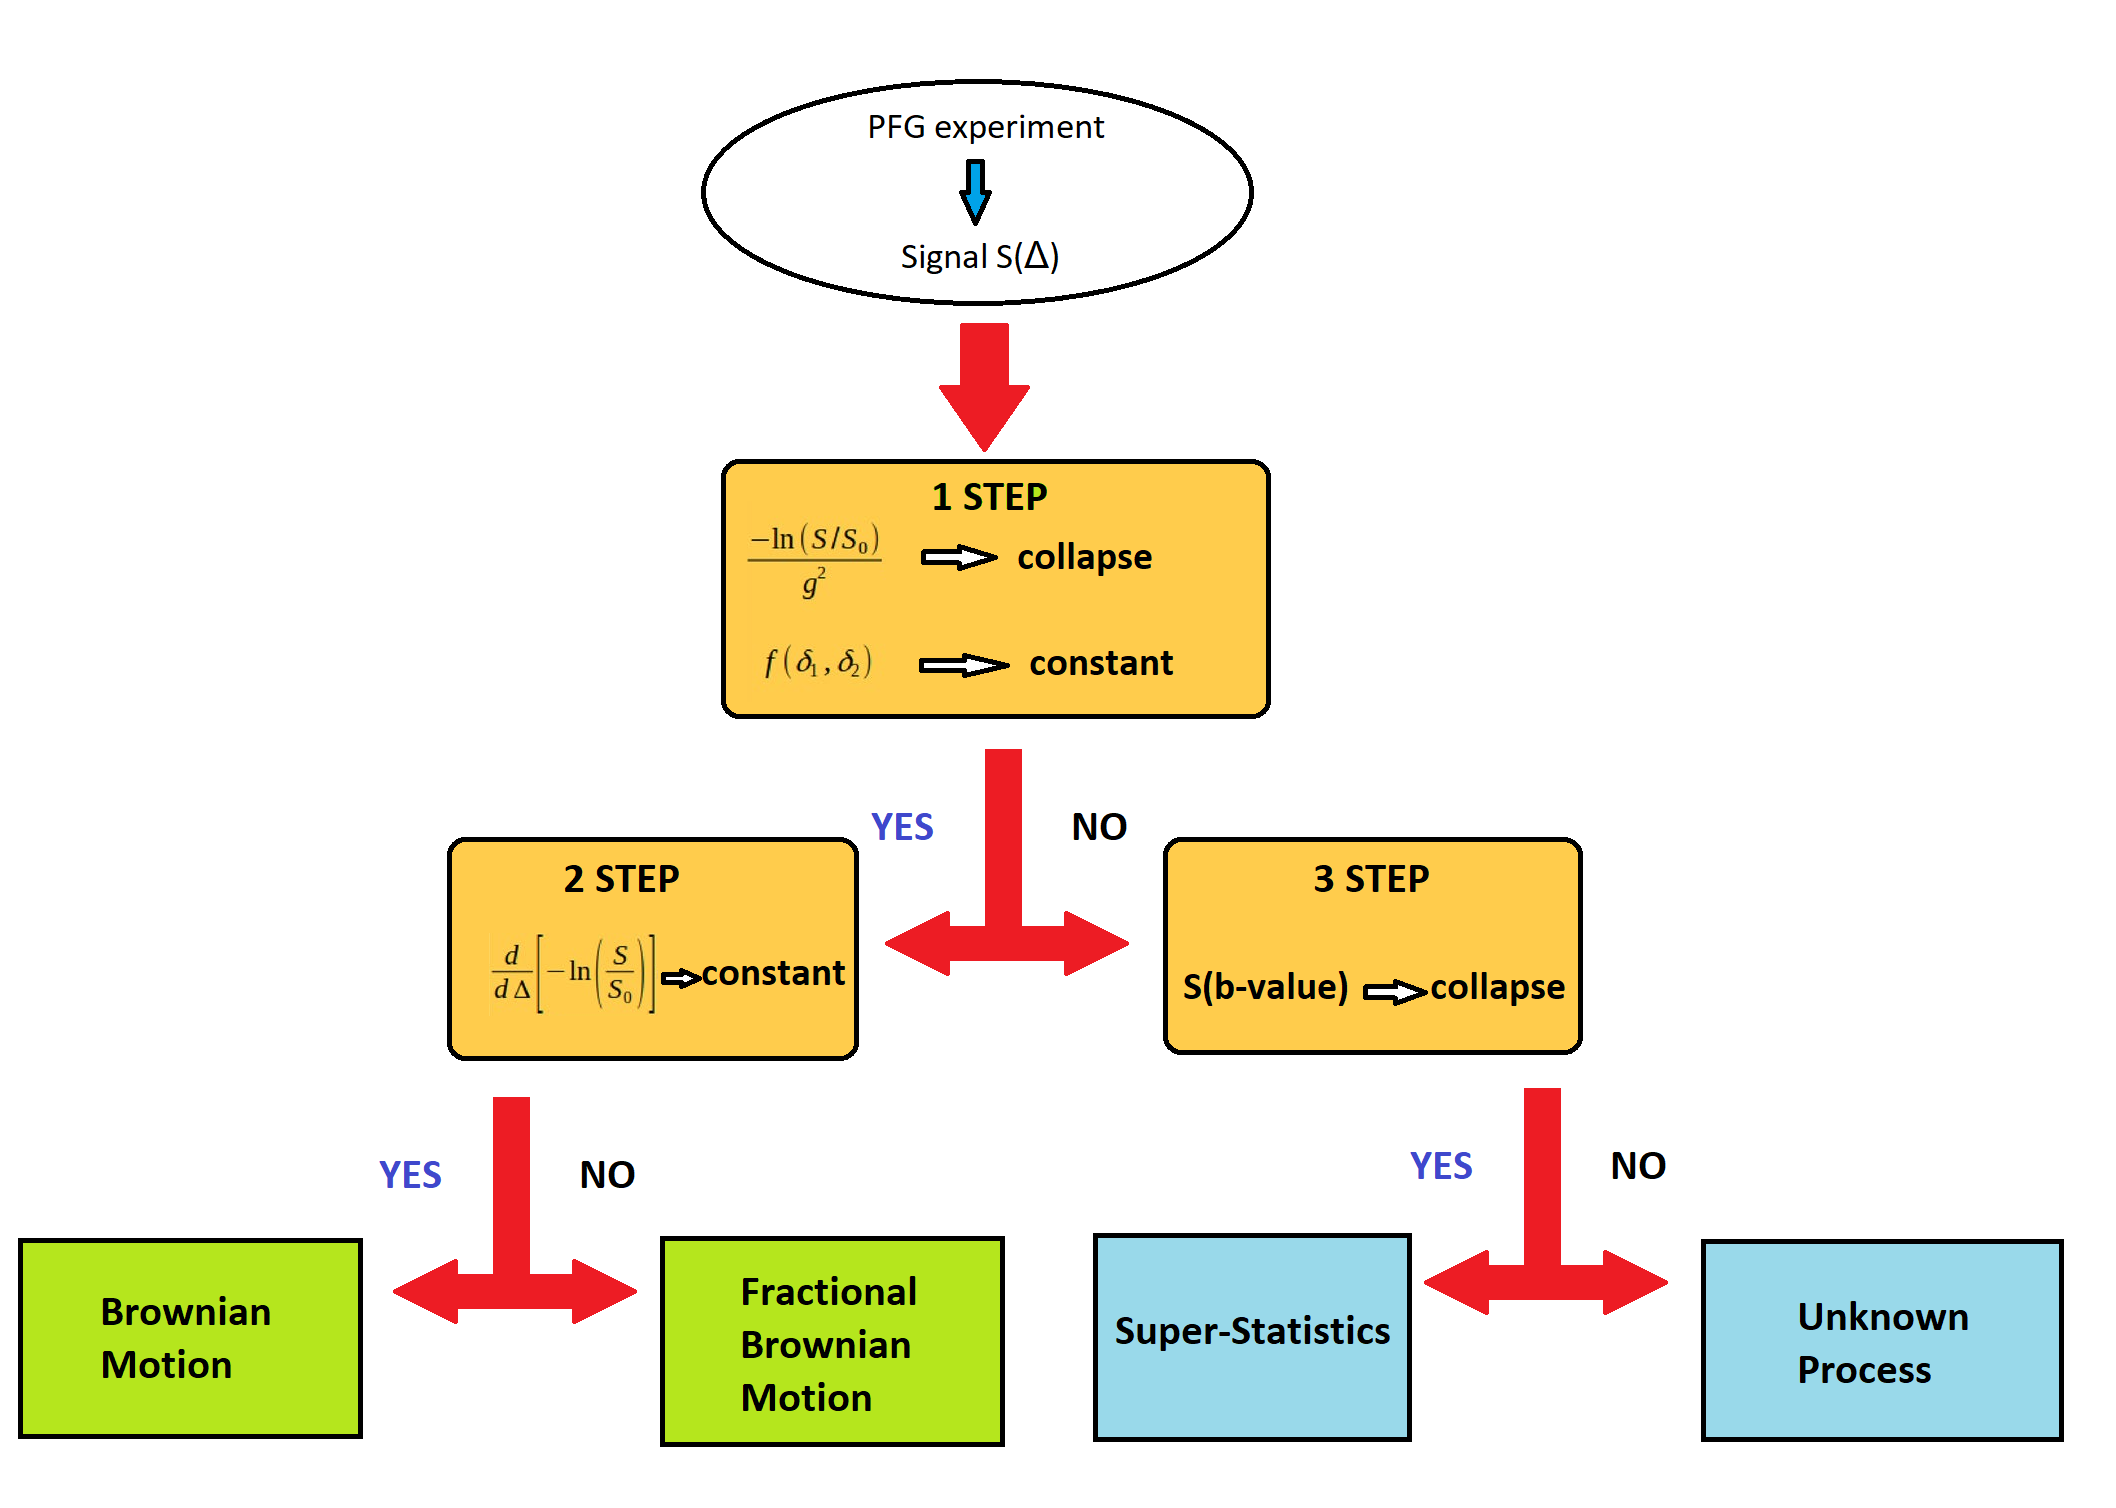
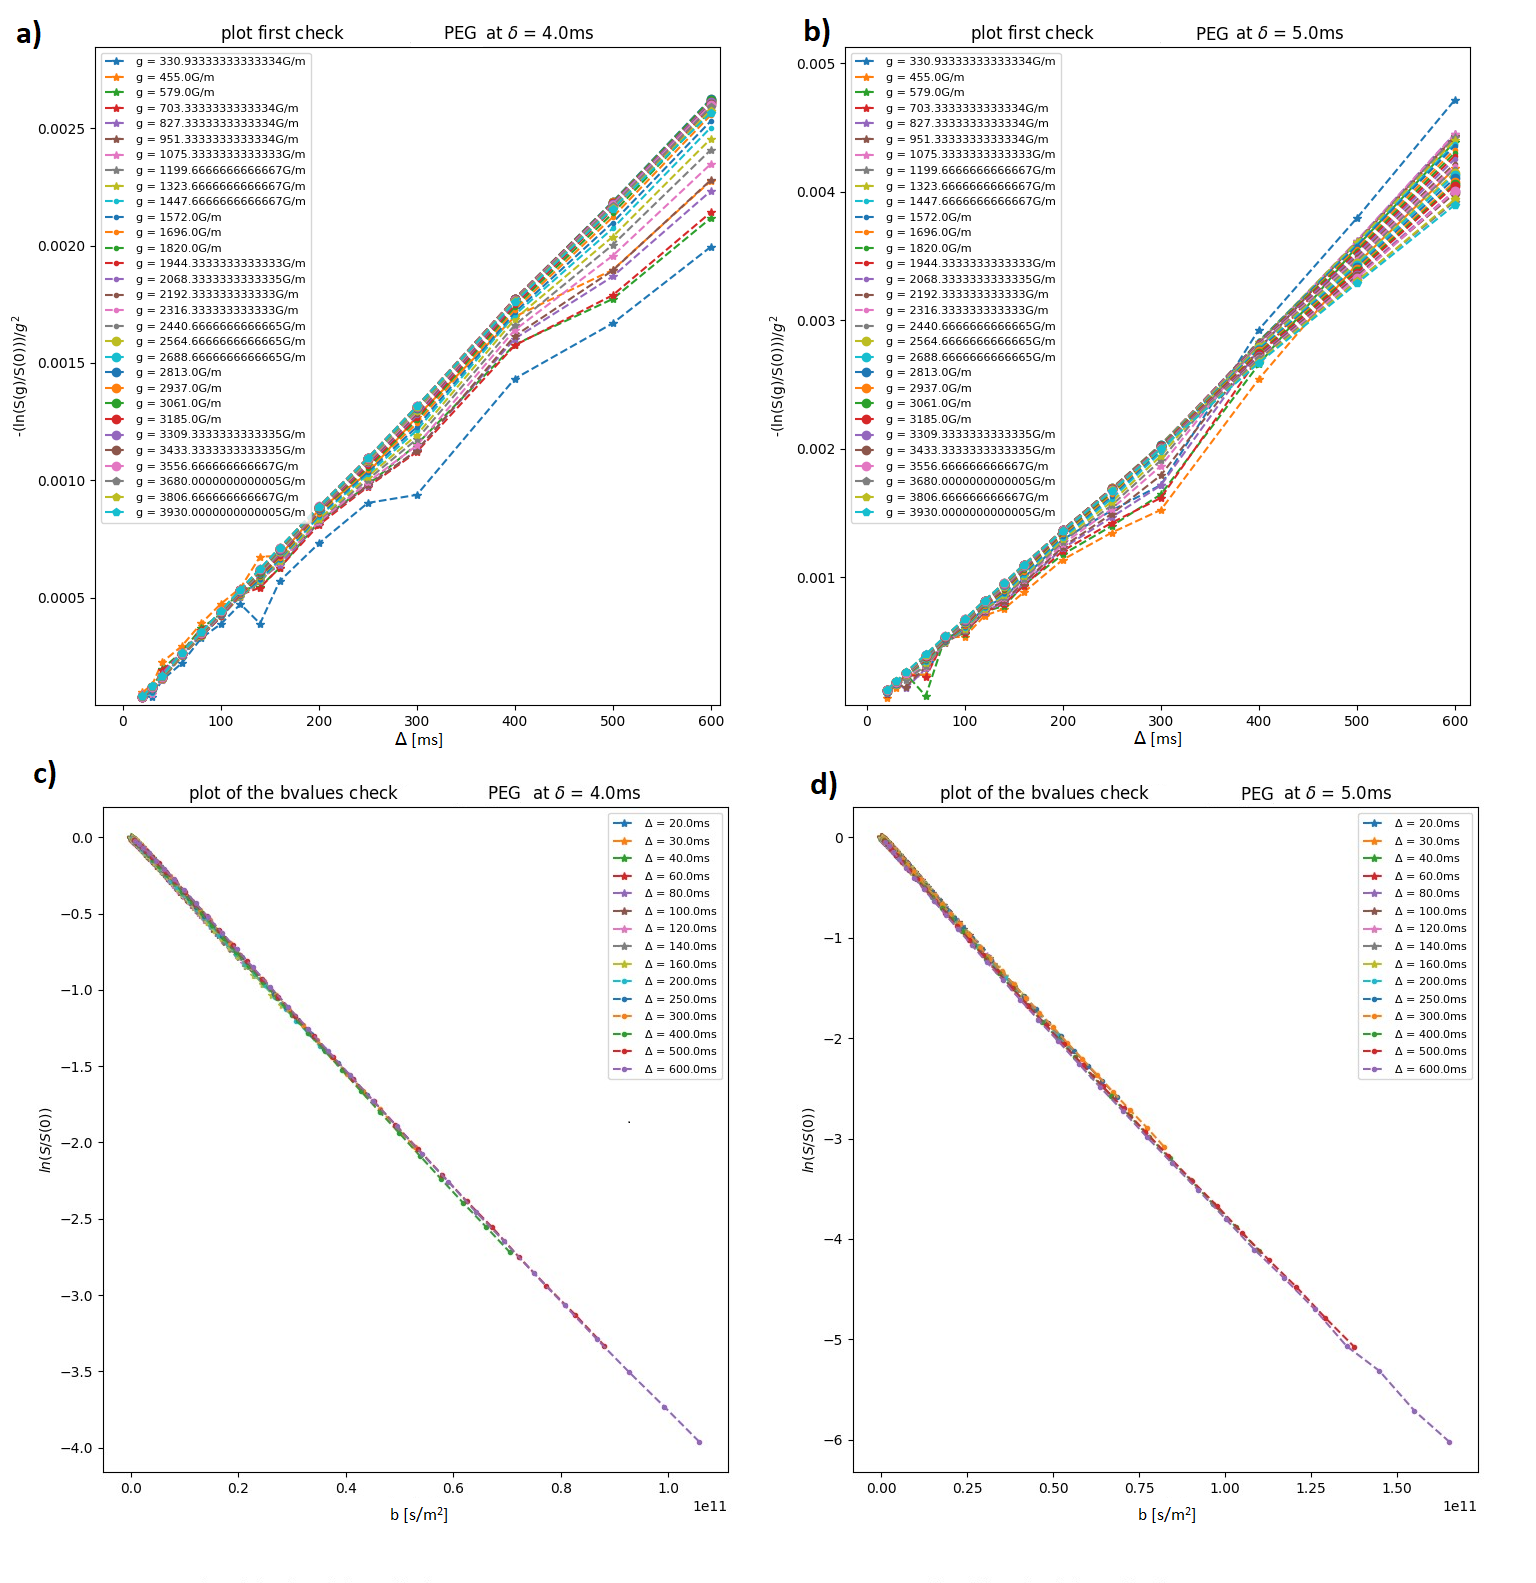
Two samples each in a 10mm NMR tube were acquired using a 9.4T Bruker Avance-400 at T=23°C. Distilled water and PEG-1500 (H−[O−CH2−CH2]n−OH, Sigma-Aldrich) at 40% w/w in water were acquired at different Δ (from 10 to 600ms) and δ (4 and 5ms) by changing the gradient strength, using a PGSTE sequence with TR=4s,n=16. Data were analyzed using a homemade Python script. NMR spectra of water solution PEG are characterized by two main resonances: the water and the CH2 PEG’s chain resonance. The water resonance is composed of water OH and PEG’s OH tail. The protons of water and PEG’s OH are characterized by two different dynamics: at high Δ only the PEG’s OH signal is found thus permitting quantitative analysis of each proton's resonance separately. We applied the “recipe”1, reported in Fig.1, to infer the underlying molecular dynamics of water, PEG’s OH, and PEG’s CH2. The first step consists in the rescaling by g2 of the signals and in the evaluation of the f(δ1,δ2) function described in the article1. If the rescaled signals collapse and f(δ1,δ2) is constant, the system has a gaussian behavior and the second check of the derivative can be performed leading to a Brownian or a Fractional Brownian Motion. Otherwise, the third step of the study of the signals decay as a function of the b-values may be performed.RESULTS
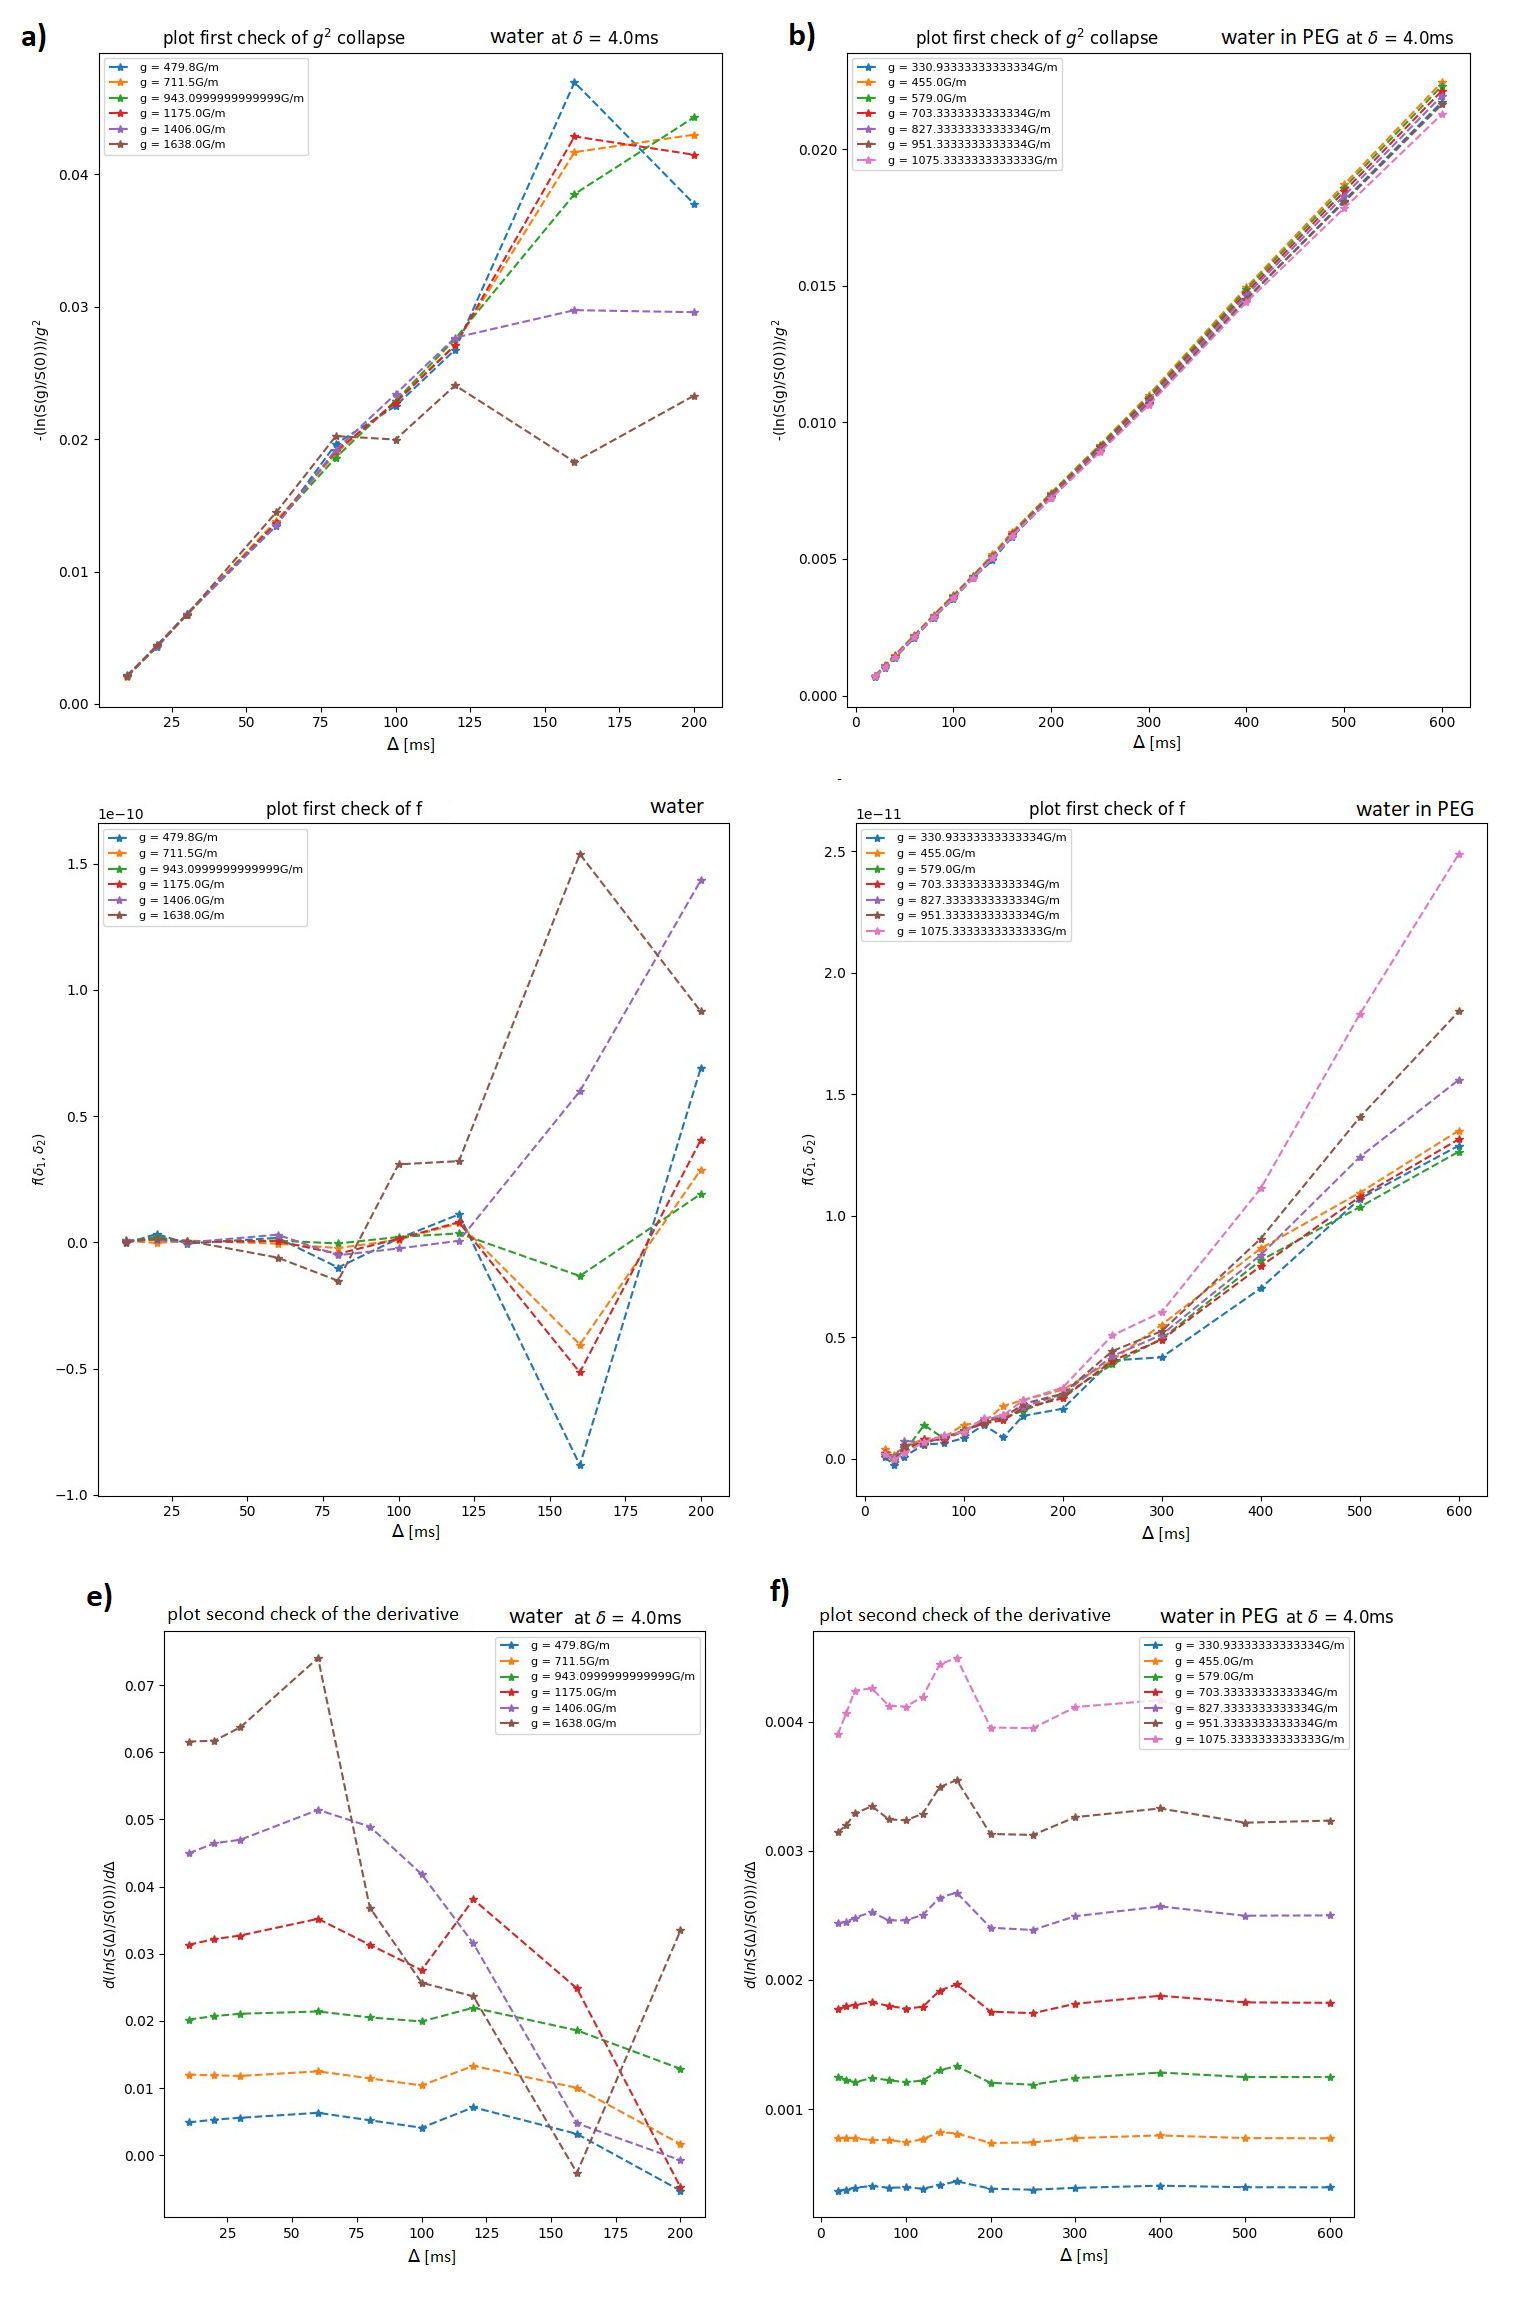
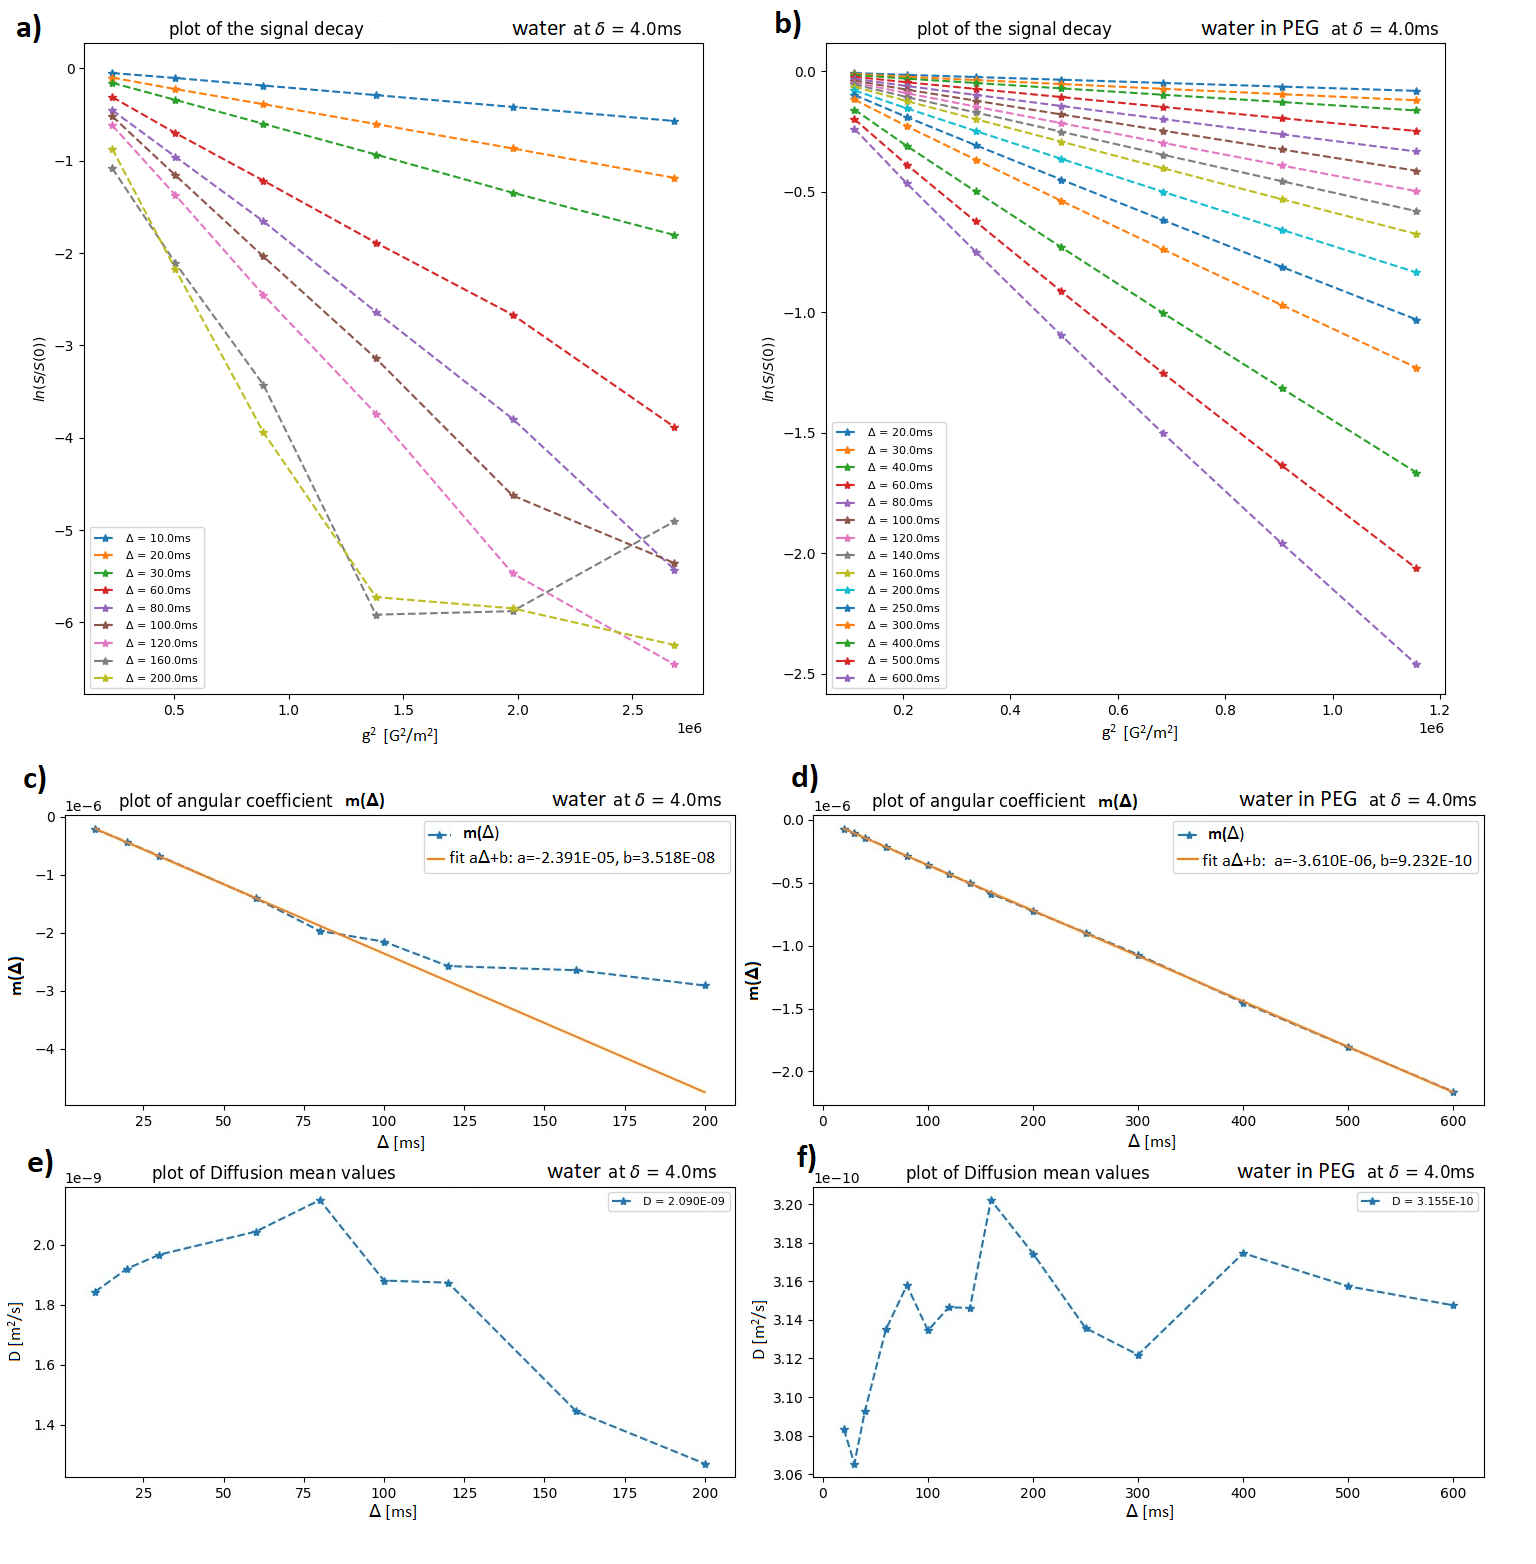
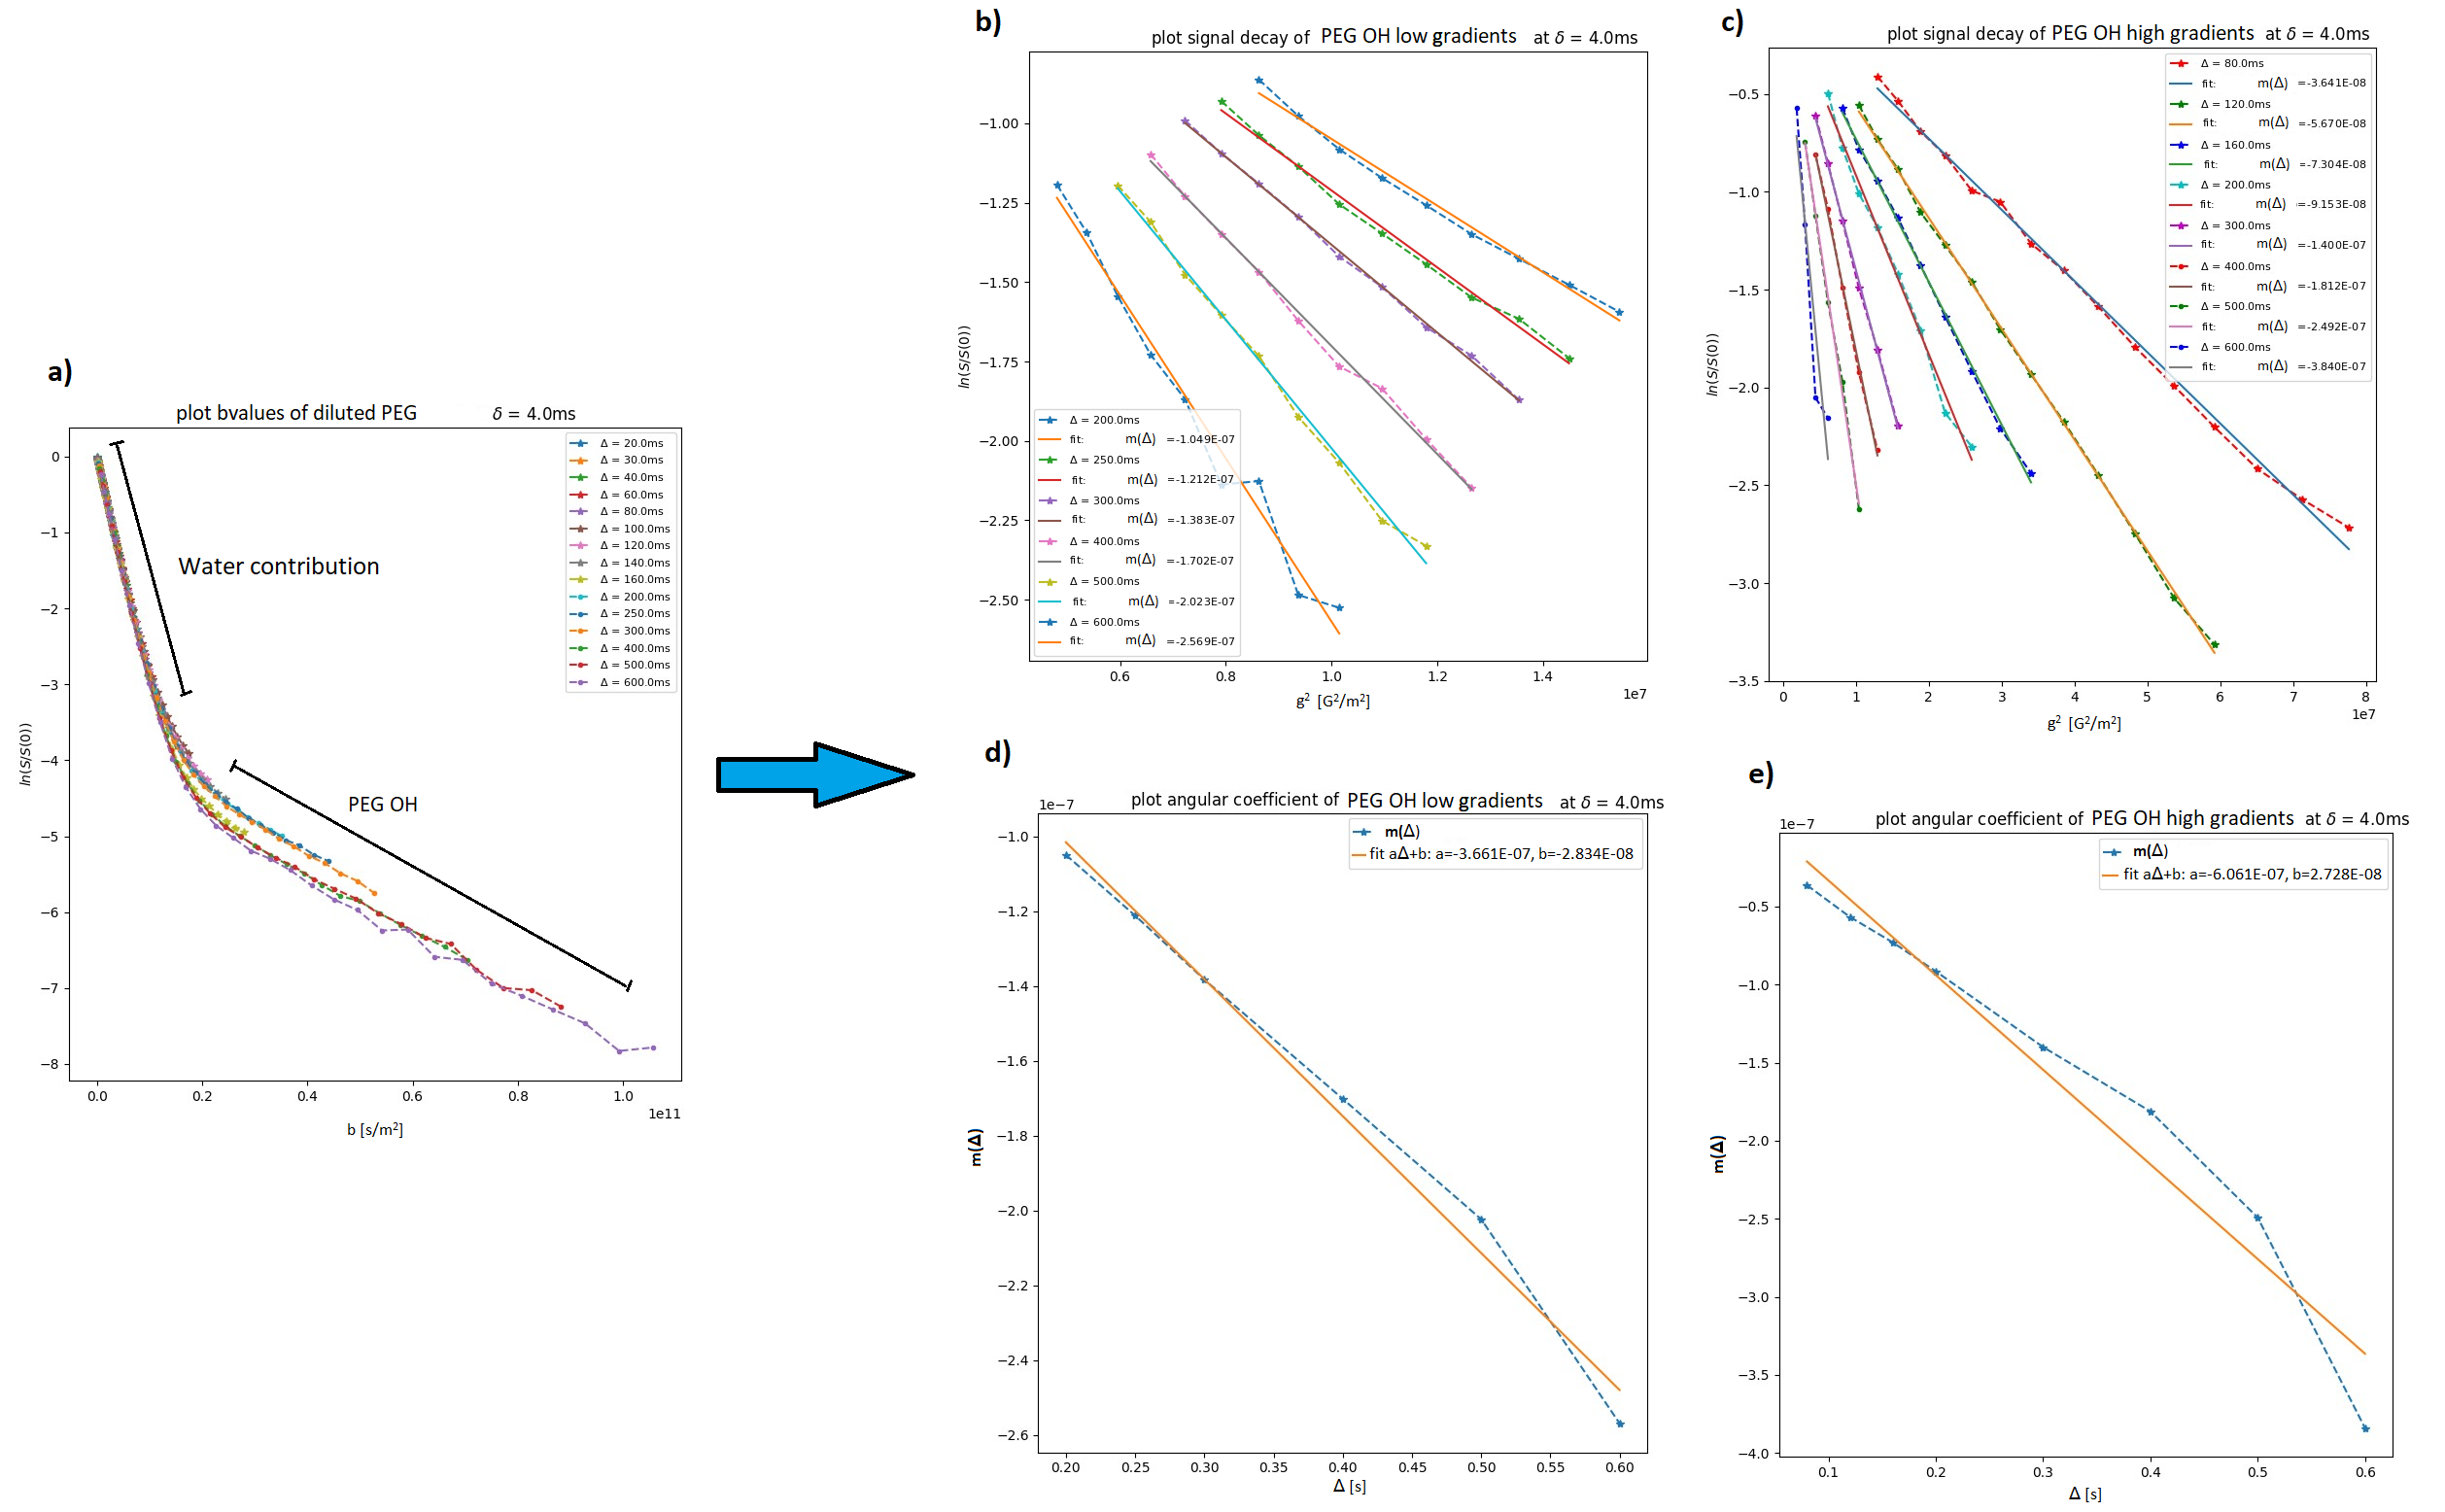
The water sample, as expected, passed all the pipeline’s checks showing Dwater=2.09E-09m2/s. In Fig.2, the first and second steps of Fig.1 were applied to water in PEG at low gradients. The PEG’s OH contribution is visible from about Δ=200ms (Fig.2b). In Fig.3b, the log normalized signals decay at low gradients strengths are shown and their slopes m(Δ) were represented as a function of the diffusion time Δ (Fig.3d). The apparent diffusion coefficients were evaluated from the slopes of the log(S(g2)/S0) decay obtaining DwaterPEG=3.16E-10m2/s for the PEG’s water component. The b-values collapse for the PEG's OH is shown in Fig.4. The PEG CH2 chain behavior was evaluated using the same checks. The first step of the g2 rescaling and the third step of the b-values evaluation are shown in Fig.5. In this case, Dapp=3.7E-11m2/s.DISCUSSION
Fig.2 shows the PEG’s water component behavior which collapsed in g2 at low magnetic gradients and low Δ, but the function f(δ1,δ2) is not constant. The second check was performed anyway, and it showed a constant derivative, thus one could have wrongly assumed a Brownian Motion dynamics for the water component. The collapse in b-values at low b-values (thus low gradients) in Fig.4a allowed us to assume a Super-Statistic dynamics in this case. Looking at higher gradients and Δ values, we detected the OH dynamic, which didn’t collapse in g2 (Fig.2b). The collapse in b-values (Fig.4a) showed that the OH contribution splits the signals at higher b in a parallel way suggesting that they could collapse with a convenient normalization factor. For this reason, we investigated the same sample at higher gradients finding that the slope of each signal decay has a non-linear time dependence. Therefore, we concluded that the OH dynamics is an unknown process. The PEG chain behavior highlighted in Fig.5 shows that it fails the first check, but it collapses in b-values suggesting a Super-Statistic dynamics.CONCLUSION
Currently, diffusion models are applied without knowing the type of dynamics a priori. The risk is to quantify diffusion parameters that do not reflect the dynamics of the system, even if the fit of the model function with the experimental data is perfect. Here we show that it is possible to carry out a preliminary check to know the type of dynamics. The use of the method described here will avoid the quantification of diffusion parameters that do not reflect the true diffusion of the medium studied.Acknowledgements
No acknowledgement found.References
1. G Costantini, S Capuani, FA Farrelly, A Taloni, A new perspective of molecular diffusion by nuclear magnetic resonance. Scientific Reports 2023; 13 (1):1703
2. G Costantini, S Capuani, FA Farrelly, A Taloni, Nuclear magnetic resonance signal decay in the presence of a background gradient: Normal and anomalous diffusion. The Journal of Chemical Physics 2023;158:174106
Figures