3484
Microstructure and exchange are not always linked1Eunice Kennedy Shriver National Institute of Child Health and Human Development, NIH, Bethesda, MD, United States
Synopsis
Keywords: Microstructure, Brain, low-field high-gradient
Motivation: To understand the mechanisms of water exchange.
Goal(s): To determine the extent that DEXSY-based water exchange measurements depend on changes to tissue microstructure (e.g., cellular swelling/shrinking).
Approach: NMR measurements of ADC, exchange rate and light microscopy measurements of intrinsic optical signal (IOS) are acquired simultaneously in real time on viable and dead ex vivo neural tissue during potassium and osmotic perturbations.
Results: In dead samples, exchange, ADC, and IOS are similarly affected. In viable samples, however, some perturbations affect exchange differently than they do the ADC and IOS that reflect changes in microsctructure alone. Exchange may be physiologically regulated independently of cell volume.
Impact: Water exchange is sensitive to cellular processes distinct from microstructure and blood flow. This measurement possibly could lead to a new fMRI method.
Introduction
The rate constant of transmembrane water exchange characterizes the turnover or mixing between intracellular and extracellular water pools, which has been shown to be linked to both active and passive transport processes1-3. It is predicted to depend linearly on the membrane surface-to-volume ratio. However, we recently showed that an oxygen and glucose deprivation model of stroke affects exchange differently than the ADC3. Here we explore this phenomenon further using hypertonic and potassium perturbations on dead and viable ex vivo neural tissue.Methods
Simultaneous real-time MR and optical microscopy measurements were acquired during perturbations to ex vivo neonatal mouse spinal cords building on previously published methods4,5. MR measurements were performed at 13.79 MHz with a low-field, high-gradient, single-sided NMR-MOUSE system6.Apparent diffusion coefficient (ADC) was measured from diffusion signals acquired with b=0.025 and 2.25 μs/mm2. Exchange rate was measured from an interpolation between the log-difference of diffusion exchange spectroscopy (DEXSY) signals acquired using a constant bs= b2+b1 = 4.5 μs/mm2 and bd=b2-b1 = 0.195 μs/mm2 and a short, intermediate, and long mixing time, tm=0.2, 10, and 100 ms. This results in 16 seconds per ADC measurement, 24 seconds per exchange rate measurement, and 40 seconds in total per data set. It is noteworthy that to the best of our knowledge this is the fastest ever DEXSY-based exchange rate method described. However, it does not account for T1 relaxation during tm, it assumes that the short and long tm are on timescales shorter and longer than exchange processes occurring in the tissue, and it is weighted towards changes occurring on the timescale of the intermediate exchange time. These factors lead to values being different from those measured with methods involving model fitting of an entire range of tm values and accounting for T1 relaxation3,8.
For the IOS measurements, a A wide-field inverted microscope (Axiovert 200 M Zeiss) was used with 680 nm transmitted light illuminating the sample at 90° to the objective. The intrinsic optical signal (IOS) was calculated from a region of interest (ROI) from images acquired every 30 seconds.
Results
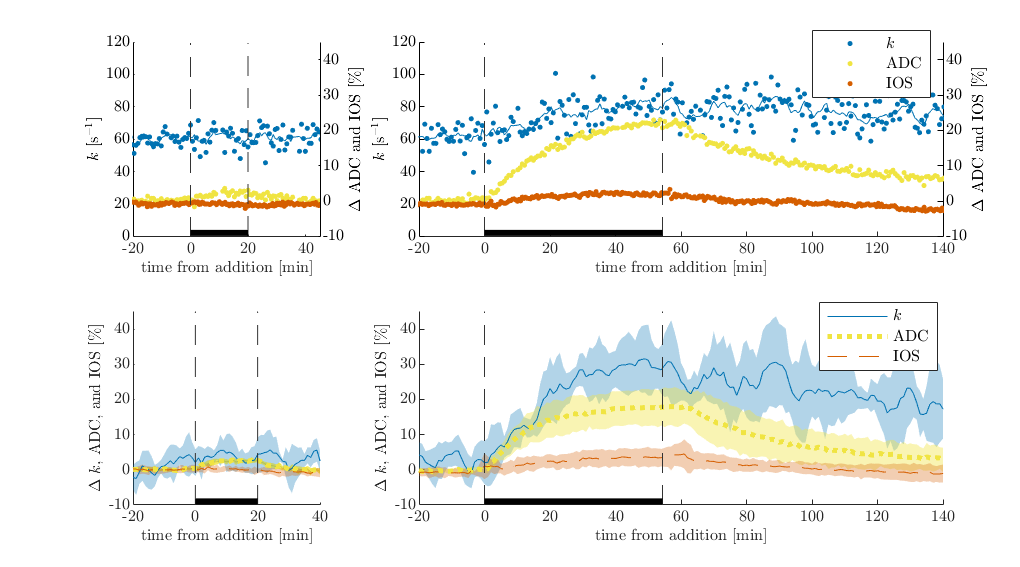
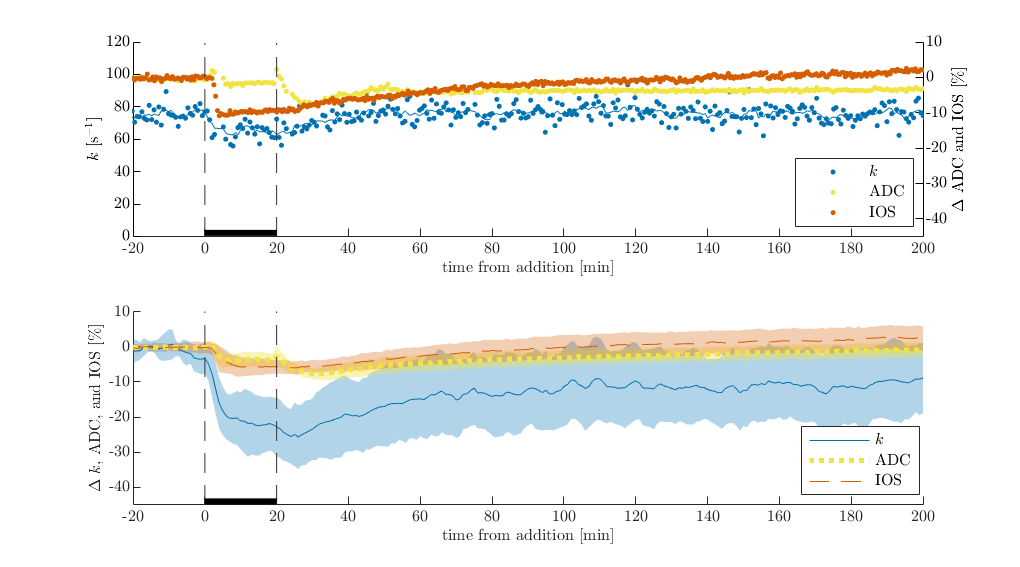
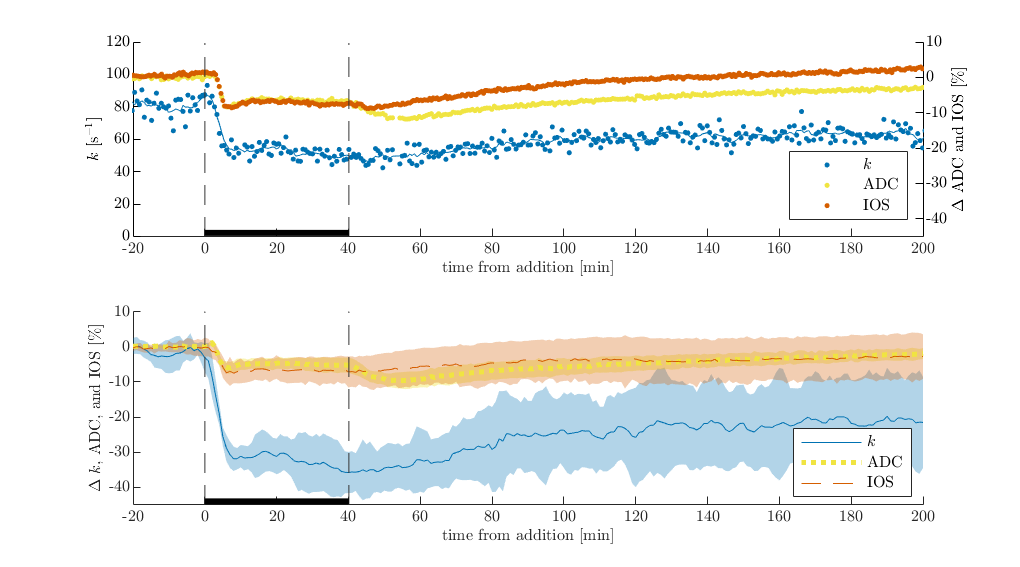
Plasma membranes are permeable to K+ and Cl- but not sucrose. Therefore, in dead or inactive tissue, 50 mM KCl does not affect tonicity whereas 100 mM sucrose does. As expected, exchange rate, ADC and IOS are not affected by 50 mM KCl, whereas they increase during 100 mM sucrose and recover during the washout with normal aCSF (Figure 1). ADC and IOS increase due to cellular swelling. Exchange rate follows a similar trend to ADC and IOS, suggesting some underlying connection in dead tissue specimen.In viable neural tissue, cells attempt to maintain homeostatic volume and transmembrane voltage by regulating active and passive ion transport. Because of this, perturbations are expected to illicit different structural changes, in addition to functional changes. Indeed, 50 mM KCl causes ADC and IOS to decrease, consistent with cellular swelling and reduction in extracellular volume (Figure 2). Exchange also decreases. When the sample is washed with normal aCSF after 20 minutes of 50 mM KCl, IOS tends to recover suggesting normalization of the extracellular space fraction. Interestingly, ADC first drops down before recovering. This effect was noted previously and may be a glial or astrocytic response5. During the aCSF wash, exchange shows an initial drop in some cases but not in others and shows variable levels of recovery across samples. 40 minutes of KCl illicits similar behavior to 20 minutes, although exchange shows a second drop during the perturbation and less recovery during the wash (Figure 3).
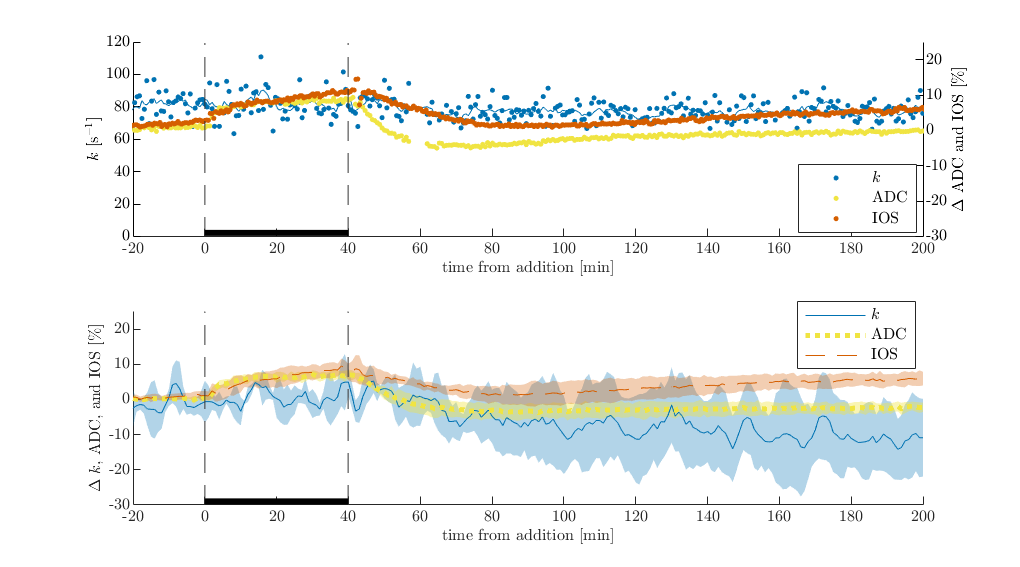
Lastly, addition of 100 mM sucrose on viable samples causes ADC and IOS to increase, although less than for the dead sample (Figure 4). This shows that intra and extracellular volumes are being regulated. Interestingly, 100 mM sucrose does not affect exchange, unlike for the dead sample. Exchange decreases during the wash, perhaps because the samples have difficulty withstanding sharp osmoltic reductions.
Discussion
Altogether, exchange trends distinctly from ADC in IOS in some cases. This is surprising, as typically exchange is thought to depend linearly on the surface-to-volume ratio. One possible explanation is that in heterogeneous environments such as neural tissue there exists a broad distribution of membrane length scales and surface-to-volume ratios. The range of membrane length scales that DEXSY is sensitive to is much smaller than the width of the distribution. A shift in the distribution with cellular swelling/shrinking may not necessarily change the measured rate of exchange if there is no change in active or passive water transport. Exchange may be physiologically regulated independently from cell volume.Acknowledgements
N.H.W., R.R., T.X.C., and P.J.B. were supported by the IRP of the NICHD.References
1. C. S. Springer Jr, "Using 1H2O MR to measure and map sodium pump activity in vivo," Journal of Magnetic Resonance, vol. 291, pp. 110-126, 2018.
2. R. Bai, C. S. Springer Jr, D. Plenz, and P. J. Basser, "Fast, Na+/K+ pump driven, steady‐state transcytolemmal water exchange in neuronal tissue: A study of rat brain cortical cultures," Magnetic resonance in medicine, vol. 79, no. 6, pp. 3207-3217, 2018.
3. N. H. Williamson, R. Ravin, T. X. Cai, M. Falgairolle, M. J. O’Donovan, and P. J. Basser, "Water exchange rates measure active transport and homeostasis in neural tissue," PNAS nexus, vol. 2, no. 3, p. pgad056, 2023.
4. N. H. Williamson et al., "Magnetic resonance measurements of cellular and sub-cellular membrane structures in live and fixed neural tissue," Elife, vol. 8, p. e51101, 2019.
5. N. H. Williamson, R. Ravin, T. X. Cai, and P. J. Basser, "Diffusion-weighted signals and intrinsic optical signal share a similar contrast mechanism," in Proceedings of the 32nd Annual Meeting of ISMRM, Toronto, Canada, 2023. [Online]. Available: https://www.nichd.nih.gov/sites/default/files/inline-files/Basser-diffusion-weighted-ISMRM2023.pdf
6. G. Eidmann, R. Savelsberg, P. Blümler, and B. Blümich, "The NMR MOUSE, a mobile universal surface explorer," Journal of Magnetic Resonance, Series A, vol. 122, no. 1, pp. 104-109, 1996.
7. D. Rata, F. Casanova, J. Perlo, D. Demco, and B. Blümich, "Self-diffusion measurements by a mobile single-sided NMR sensor with improved magnetic field gradient," Journal of Magnetic Resonance, vol. 180, no. 2, pp. 229-235, 2006.
8. N. H. Williamson et al., "Real-time measurement of diffusion exchange rate in biological tissue," Journal of Magnetic Resonance, vol. 317, p. 106782, 2020.
Figures