3483
Impact of Rician Bias on biophysical modeling1Laboratorio de Procesado de Señal (LPI), ETSI Telecomunicación, Universidad de Valladolid, Valladolid, Spain, 2Center for Biomedical Imaging (CBI), New York University Grossman School of Medicine, New York City, NY, United States, 3Cardiff University Brain Research Imaging Centre (CUBRIC), Cardiff University, Cardiff, United Kingdom
Synopsis
Keywords: Diffusion Modeling, Diffusion/other diffusion imaging techniques, Rician Bias, Noise, SMI
Motivation: Rician noise degrades the accuracy of biophysical modeling. Understanding this bias and defining a robust strategy for its mitigation, is important for reproducible and quantitative use of diffusion MRI.
Goal(s): To study the impact of noise biases on biophysical models and evaluate methods for more accurate estimation of diffusion metrics.
Approach: We compare various parameter estimators (via simulations and MRI data) and evaluate their impact on the accuracy of biophysical model parameters.
Results: The use of rotational-invariant spherical harmonics in biophysical modeling is a source of noise bias that can be mitigated by fitting such models directly to the diffusion-weighted signals.
Impact: With the advent of higher b-values, Rician bias pose a threat to the reproducibility in diffusion MRI studies. With this work we take a deep look at such bias and propose alternatives to avoid such counfounders from the final estimates.
Introduction
Biophysical modeling provides a unique pathway to the quantification of mesoscopic features from diffusion MRI data1. Unfortunately, diffusion MRI is poor in signal-to-noise ratio (SNR), making the data prone to the notorious Rician bias2. In this work, we assess how Rician bias impacts the accuracy of biophysical models, e.g. Standard Model Imaging (SMI)1,3,4. We evaluate various parameter estimation strategies to mitigate the Rician bias in support of more reliable quantitative MRI.Methods
Parameter estimationSMI parameters are oftentimes estimated from a series of rotationally-invariant spherical harmonic (SH) features, but can also be estimated directly from the DWI signals themselves. Note that in SMI, parameters and the fiber orientation distribution function are estimated simultaneously. We refer to both modeling strategies as SMI-SH and SMI-DF (direct fit), respectively. The parameters of interest are intra-cellular signal fraction $$$f$$$ and diffusivity $$$D_a$$$, and extra-cellular parallel $$$D_e^{||}$$$ and perpendicular $$$D_e^\perp$$$ diffusivities. For the SMI-SH, we include the 0th and 2nd-order SH features: S0 and S2, which are computed as follows:
$$$S_0 = \sqrt{\frac{1}{4\pi}}c_1 \hspace{0.7in} \text{and} \hspace{0.7in} S_2=\frac{1}{\mathcal{N}_l} \sqrt{\sum_{l=1}^\infty\sum_{m=-l}^l[c_{lm}}]^2\bigg\rvert_{l=2}=\frac{1}{\mathcal{N}_l}\sqrt{\sum_{m=-2}^2 [c_{2m}]^2}$$$
where $$$c_{ij}$$$ are the SH coefficients and $$$\mathcal{N}_l=\sqrt{4\pi(2l+1)}$$$.
We compare the following fitting strategies:
- Linear SH fitting + SMI (SH SMI),
- Rician Bias-correcting NLS SH fitting + SMI (RBC-SH SMI),
- DF of SMI using nonlinear least squares (DF SMI),
- DF of SMI using Rician Bias-correcting NLS (RBC-DF SMI).
The bias-correcting strategies model the Rician bias using the Rician value expectation operator5; strategy that has shown to remove Rician bias while being robust to preprocessing steps6.
Data
Five healthy subjects underwent MRI scanning on the Siemens Connectom 3T scanner for test/retest scan. Per scan, we acquired the following DWI images $$$b=0$$$ ($$$n=23$$$), $$$b=500$$$ (30 dirs), $$$b=1000$$$ (30 dirs), $$$b=2500$$$ (30 dirs) and $$$2 \times b=6,000\ \mathrm{s}/\mathrm{mm}^2$$$ (60 dirs) with a spatial resolution of $$$2.5\times 2.5\times 2.5\ \mathrm{mm}^3$$$ and $$$TE=66\ \mathrm{ms}$$$. Data was preprocessed prior to parameter fitting.
Simulations
We use the DTI or SMI model to create synthetic data with varying imaging protocols, yet matched b-values, and varying SNR levels: Protocol A (60 gradients per shell) and Protocol B (120 gradients per shell). Rician distributed data was generated by adding complex Gaussian noise prior to computing its magnitude.
Statistical analysis
We use a paired t-test to compare protocols, SMI-SH and SMI-DF, and estimators.
Results
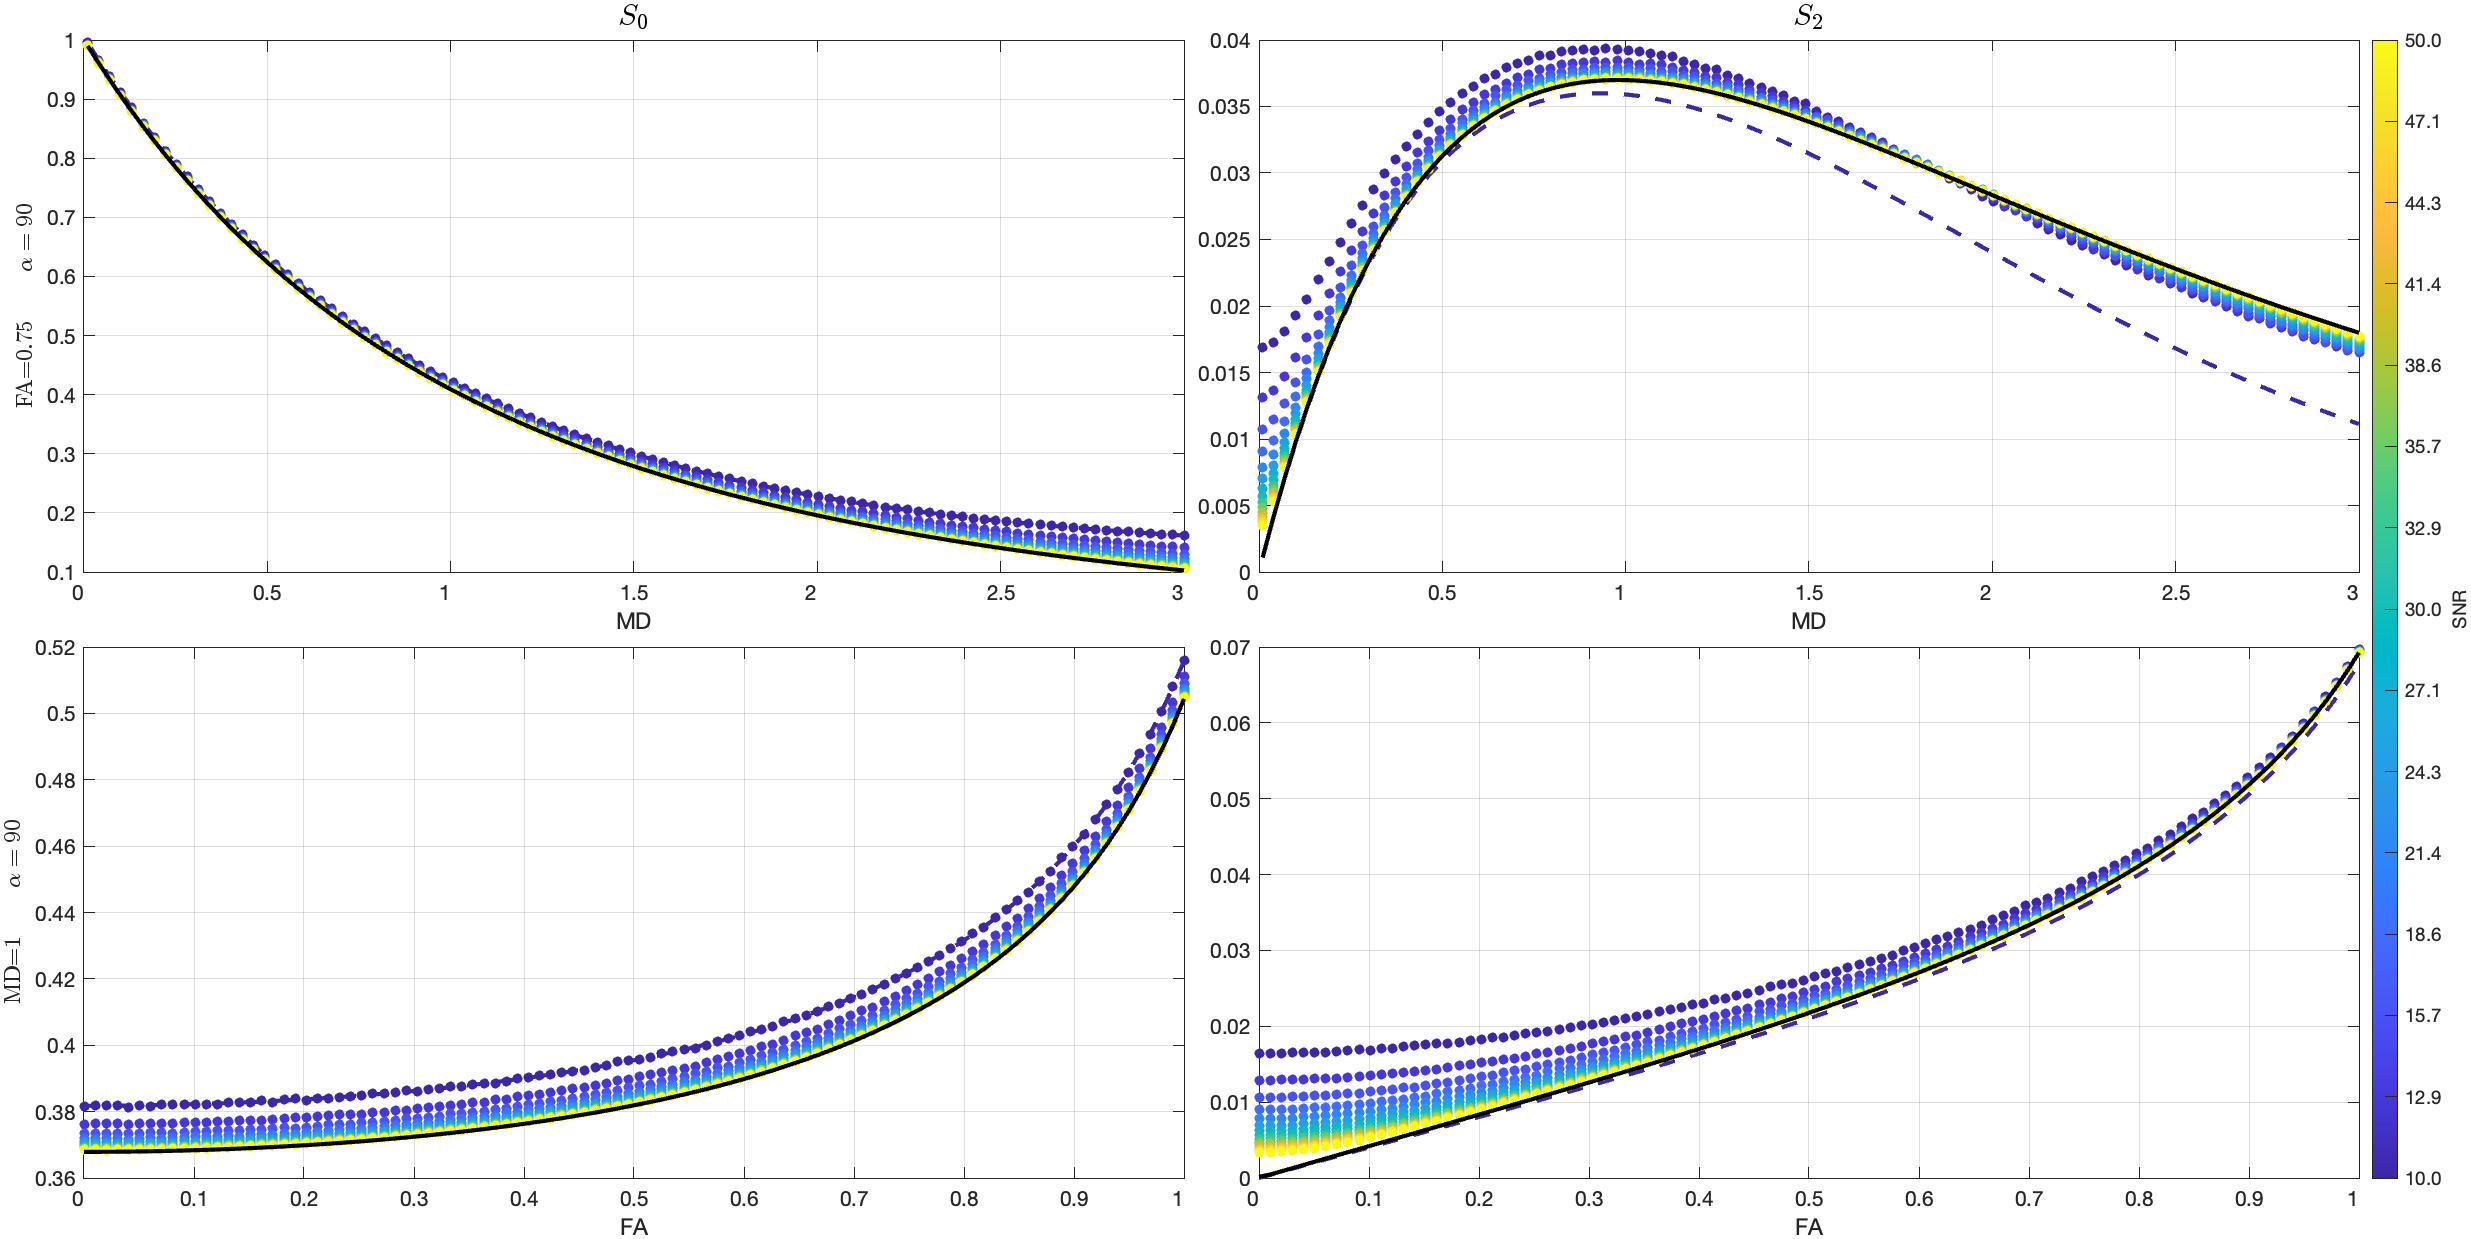
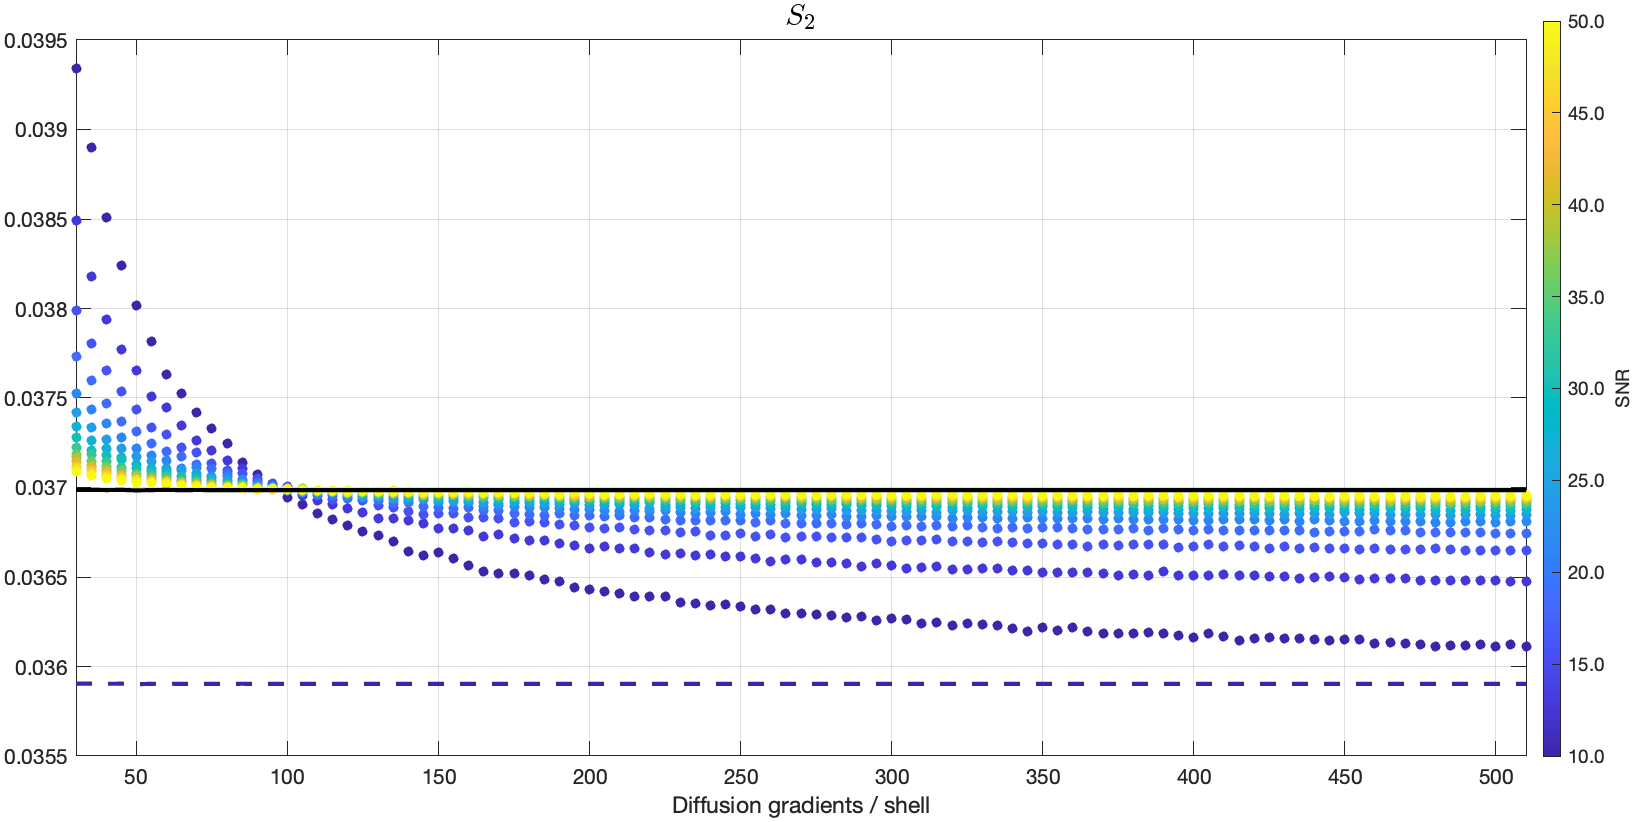
Figure 1 shows the noise propagation to S0 and S2 estimates, for varying SNR levels. Data was simulated using DTI representation with varying FA and MD values. While we observe an SNR-dependent overestimation of S0 and S2, the latter is not expected if the only source of error is the Rician bias.Figure 2 shows the effect of acquisition protocol on S2 estimates. When increasing the number of gradient directions, the estimation converges to its expected value. The protocol-dependency in the S2 estimation reveals a second source of “bias”, seemingly independent from the Rician bias, which originates on the SH coefficients and further biases S2. Said protocol-dependent noise follows a noncentral Chi distribution with 5 D.O.F.
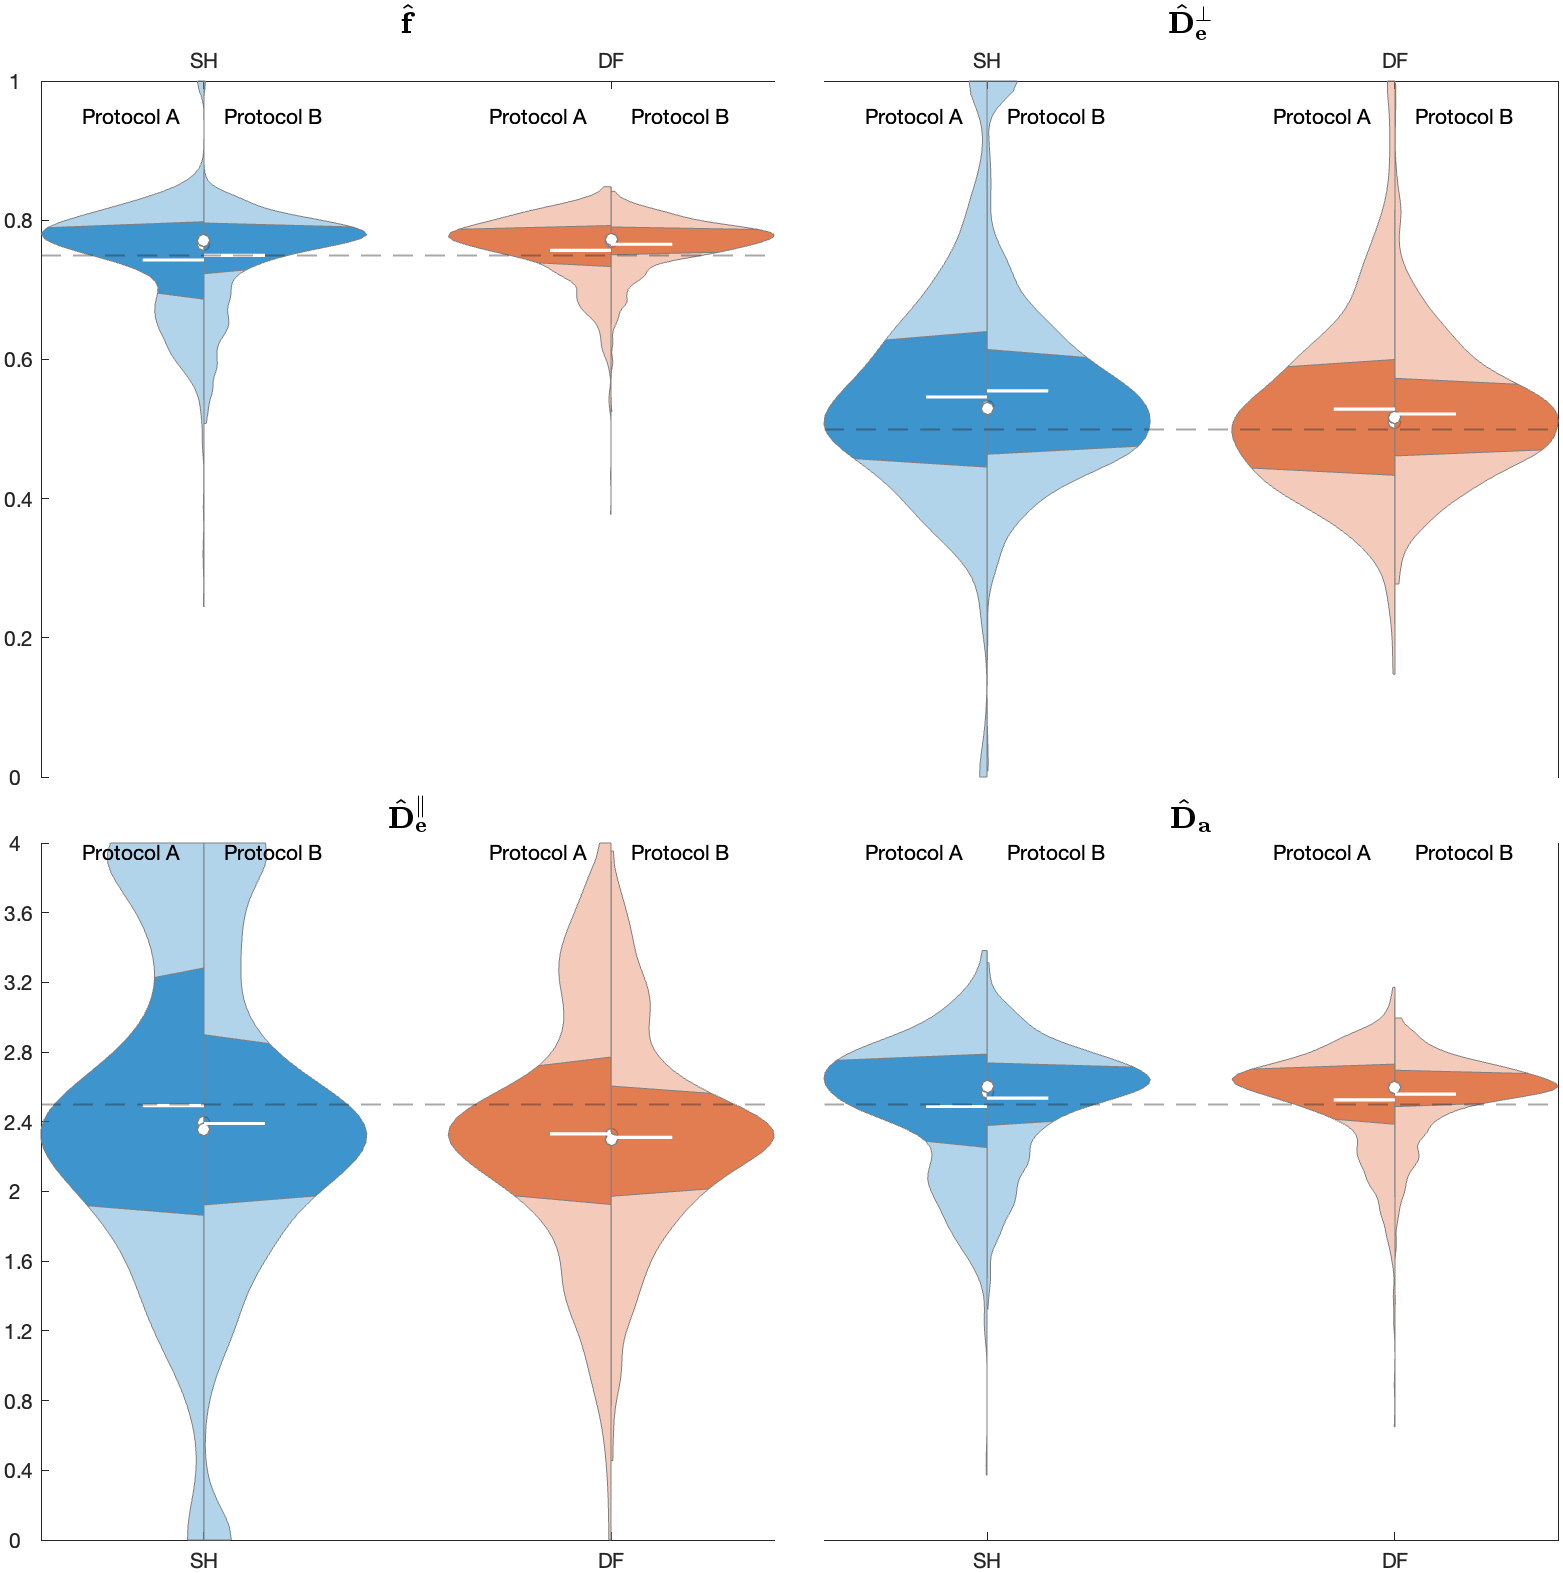
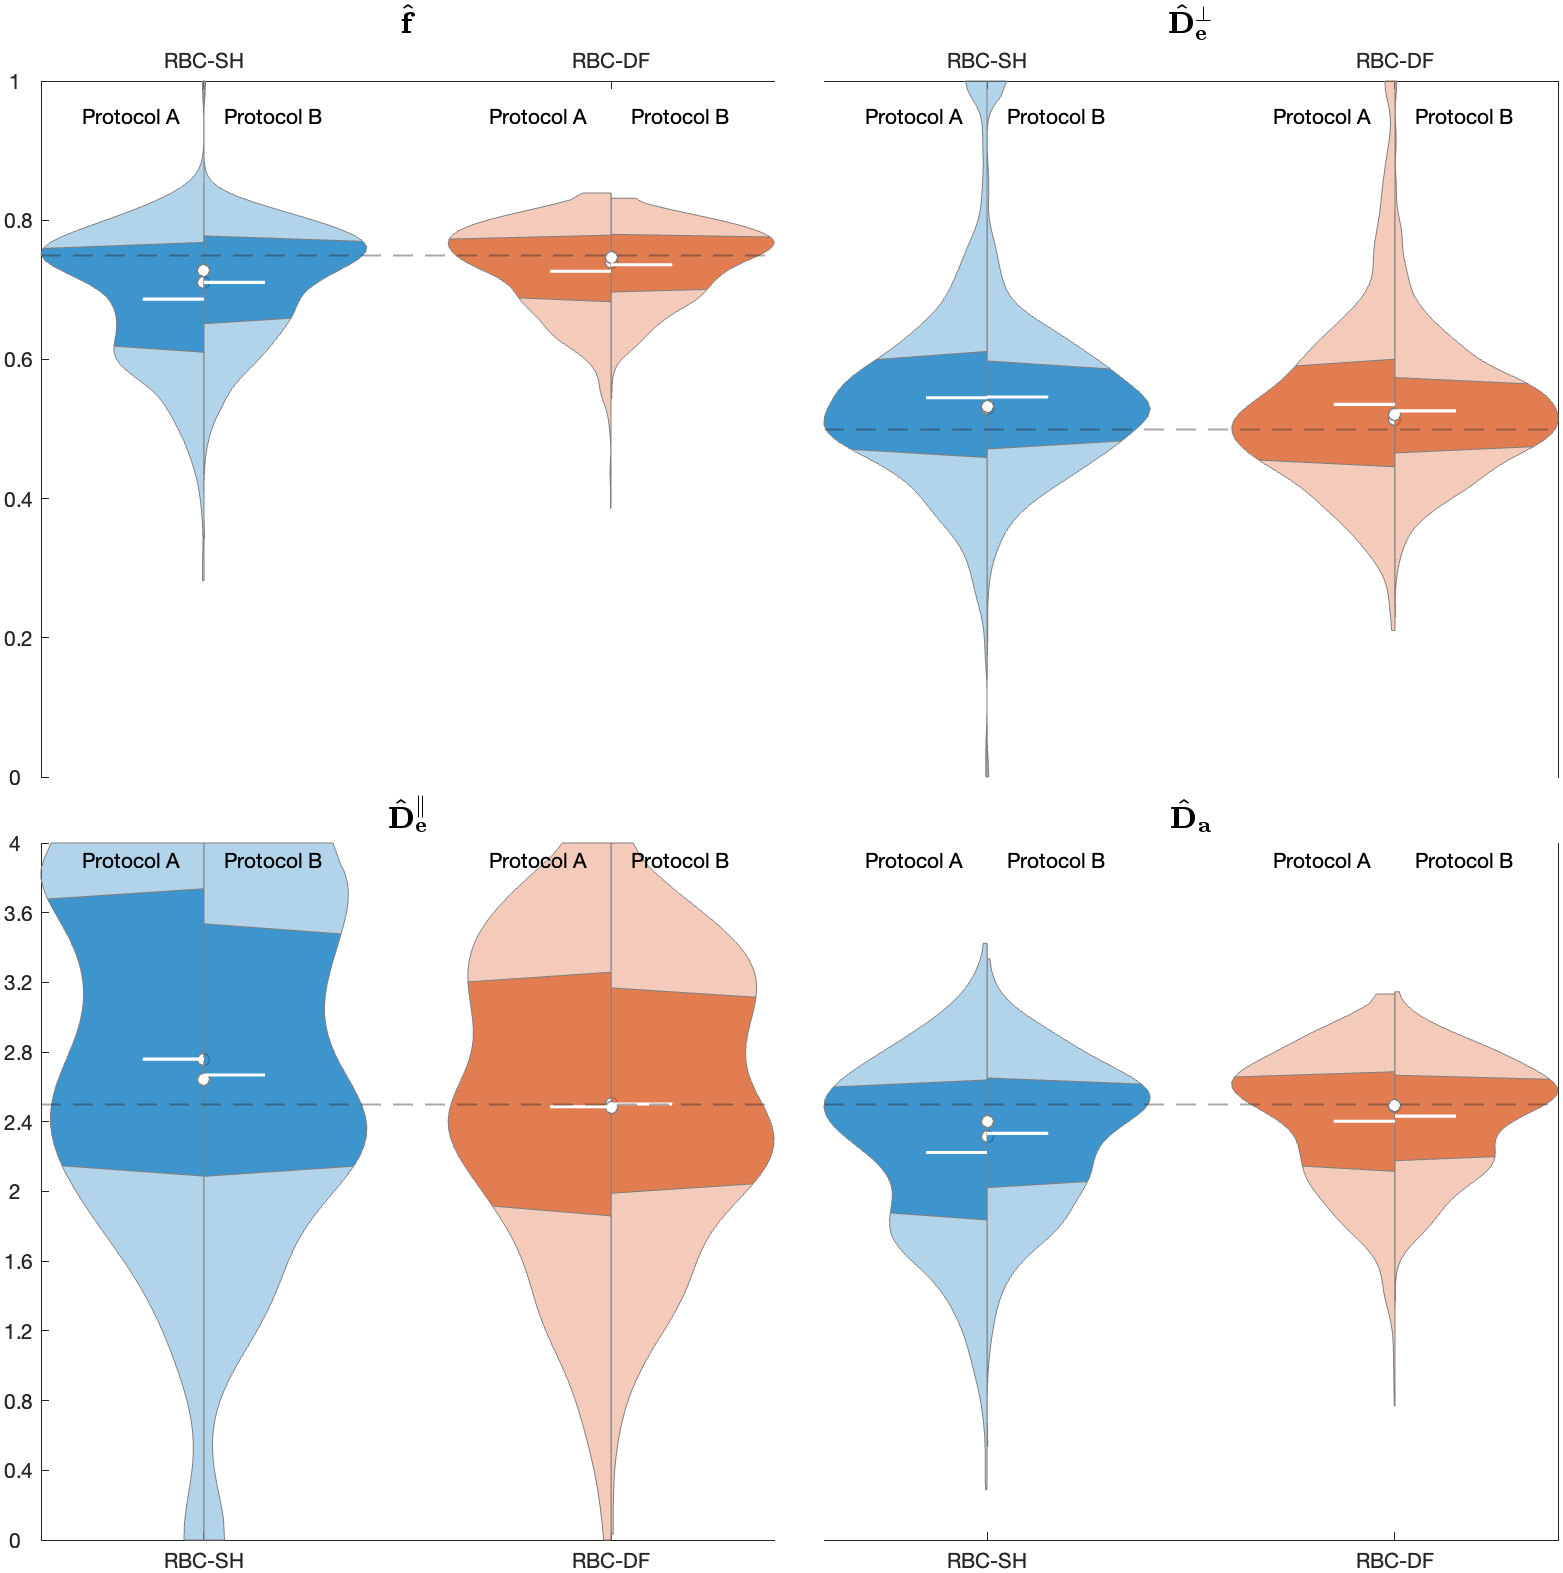
The distribution comparisons of the estimates when using different protocol acquisitions (A and B) either via non-RBC or RBC strategies are shown in Fig. 3 and Fig. 4, respectively. DF estimates are less affected by Rician bias, thus more repeatable under different protocol acquisitions. Rician bias is reduced in both models as a consequence of the RBC estimation.
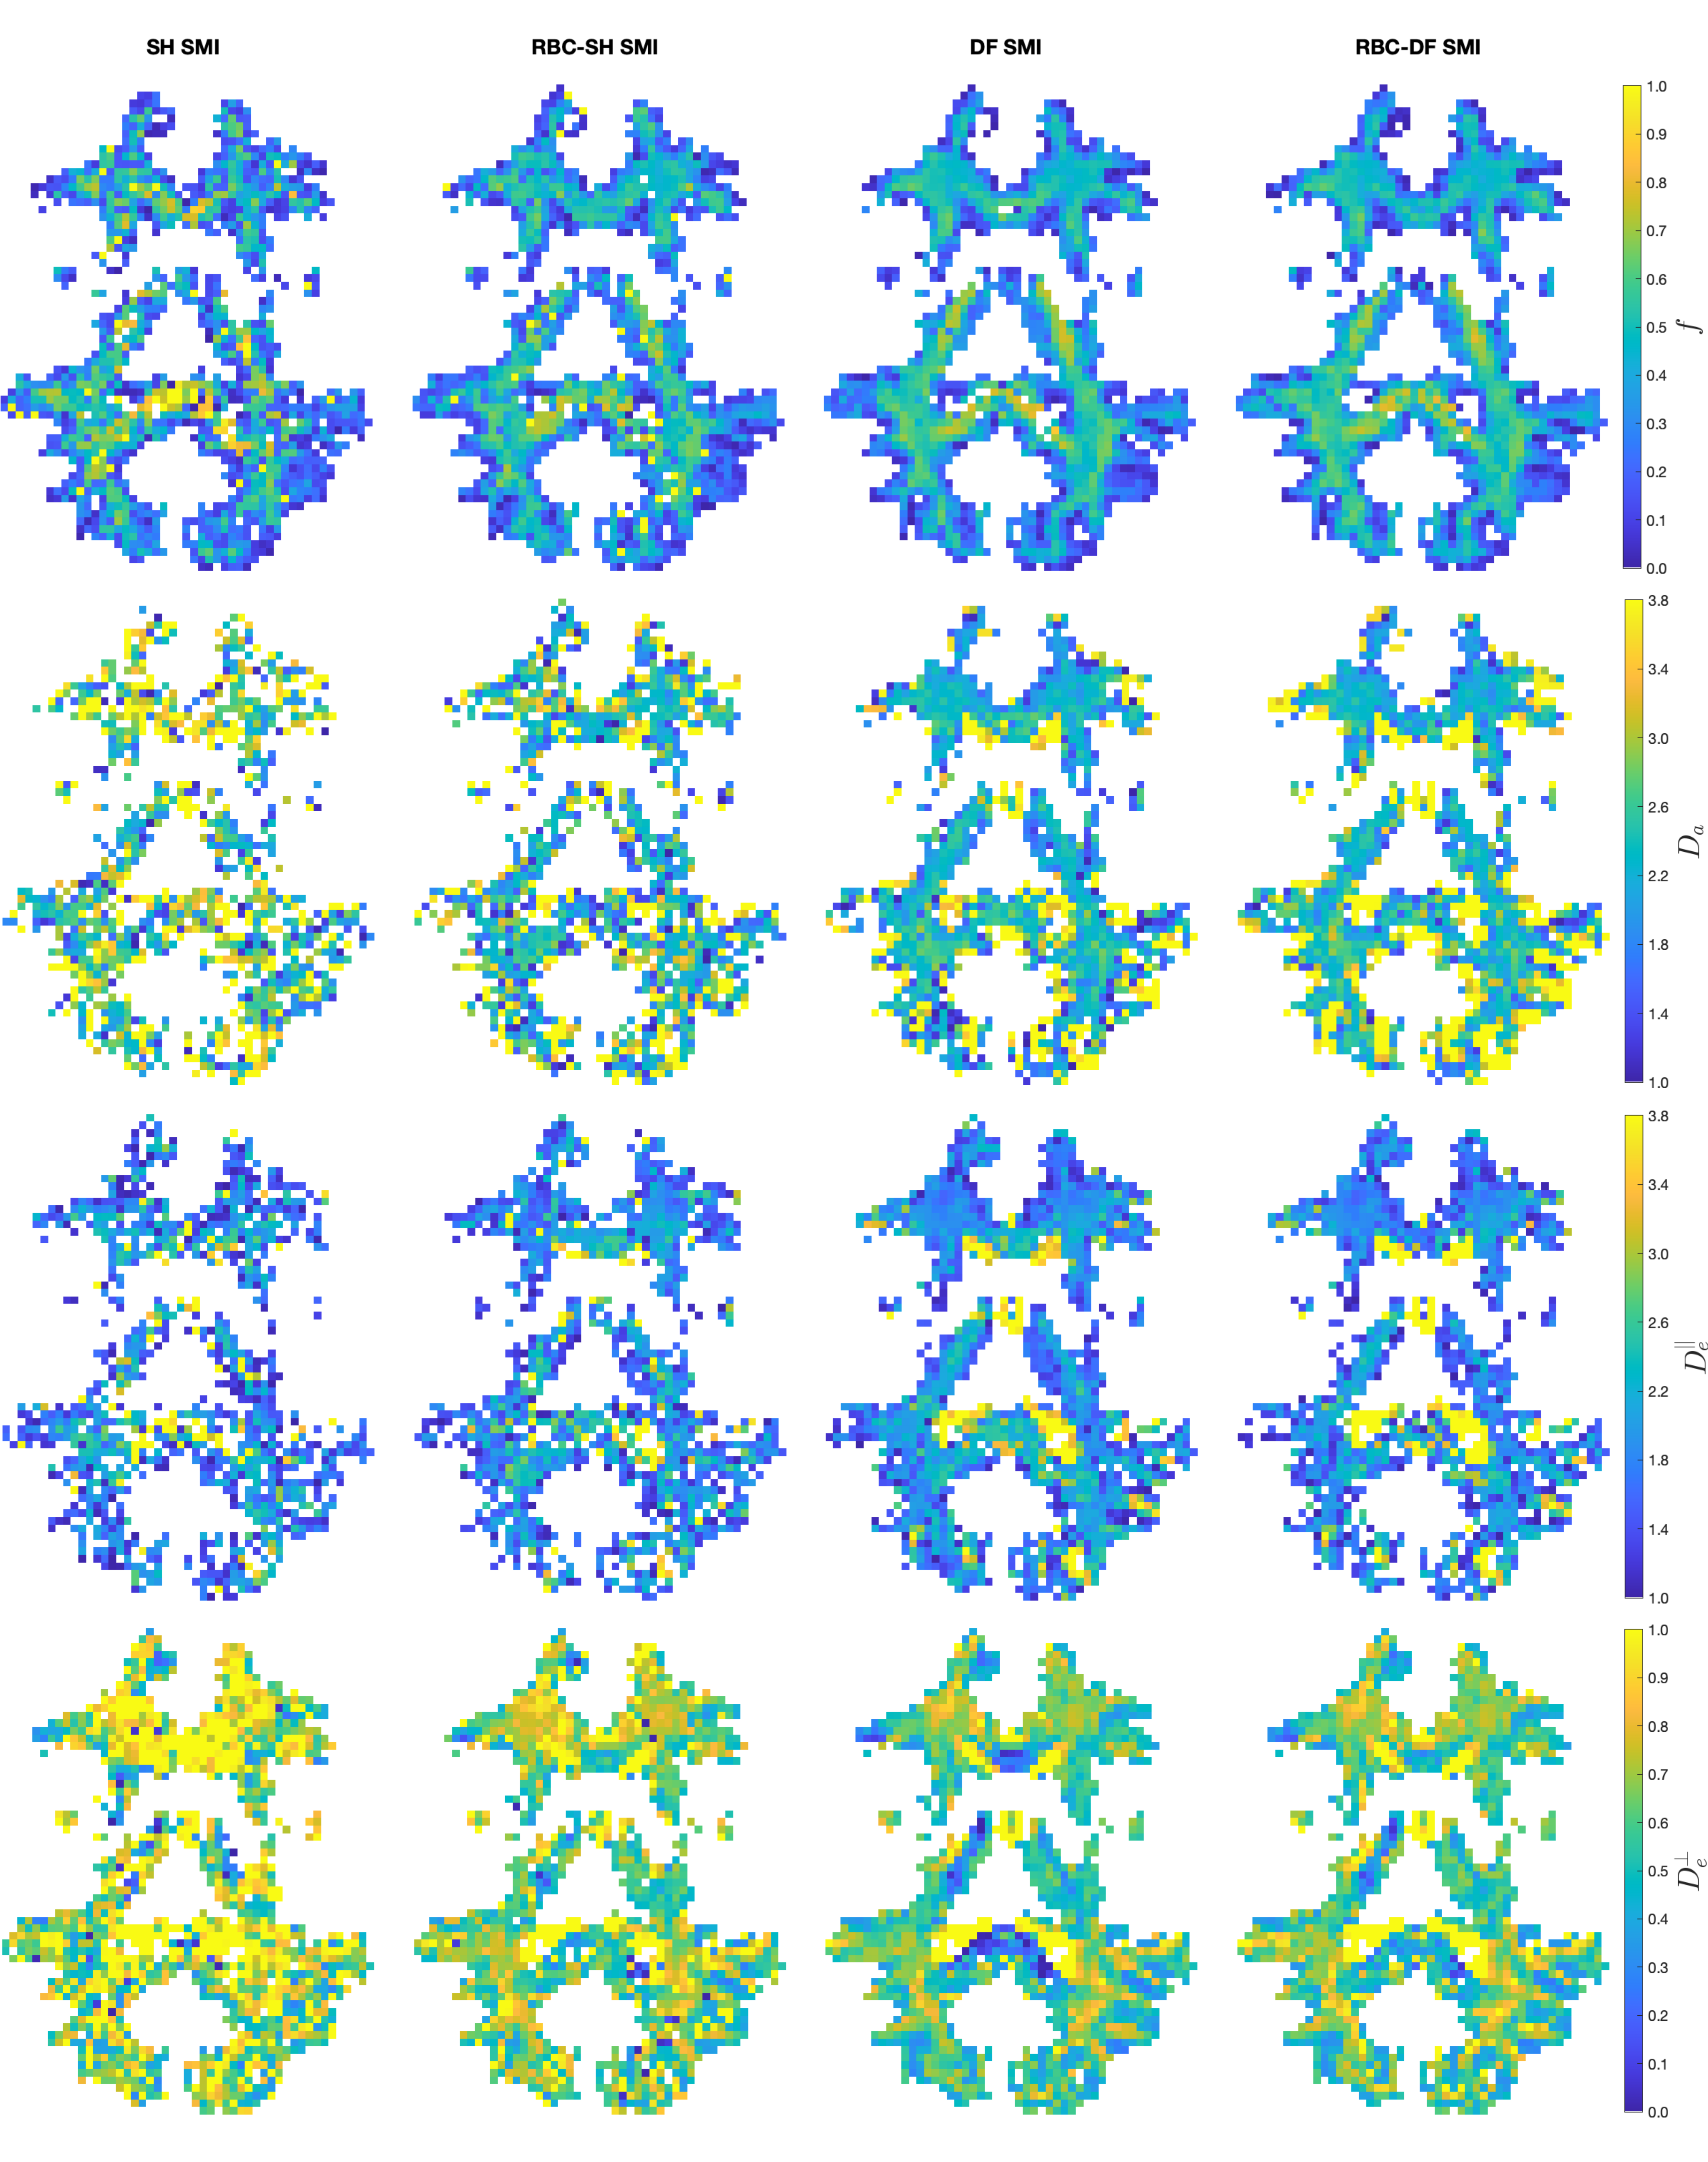
Figure 5 shows SMI estimates for in vivo data. Qualitatively, we observe an improved robustness and precision in the estimates when correcting the Rician bias or using DF. Using SH, we observe statistically significant differences ($$$p<0.05$$$) in the estimation of $$$f$$$, $$$D_e^{||}$$$, $$$D_e^{\perp}$$$ when comparing diffusion protocols. Significant differences in the estimation of all parameters are observed when comparing SH and DF, even after RBC. This was mainly observed in protocol A, which is more prone to the bias in S2. Rician bias correction has a significant impact on the estimation of all parameters, with effects up to 11%. However, said effects are inconsistent across SH and DF, possibly due to the bias in S2.
Discussion and Conclusions
In this work we have assessed the noise propagation through various parameter estimation strategies. We identify two sources of noise bias that impact the accuracy of SMI: SNR-dependent Rician bias —impacting S0 and S2— and protocol-dependent non-central chi —impacting S2. While the former can be corrected by using established estimators that embed the RBC, the latter can still have a great impact. Alongside previous solutions7, we show that SMI-DF presents a promising avenue for mitigating the effect, thereby providing more accurate and consistent estimates of SMI.Acknowledgements
This work was supported in part by the National Institute of Neurological Disorders and Stroke of the NIH under awards R01 NS088040 and by the Hirschl foundation and was performed under the rubric of the Center for Advanced Imaging Innovation and Research (CAI2R, www.cai2r.net), an NIBIB National Center for Biomedical Imaging and Bioengineering (NIH P41 EB017183).The Connectom data were in part acquired at the UK National Facility for in vivo MR Imaging of Human Tissue Microstructure funded by the EPSRC (grant EP/M029778/1), and The Wolfson Foundation. Guillem París was funded by the Consejería de Educación de Castilla y León and the European Social Fund through the “Ayudas para financiar la contratación predoctoral de personal investigador - Orden EDU/1100/2017 12/12” program; as well as by the mobility program “Movilidad de estudiantes de Doctorado UVa 2023”. Tomasz Pieciak acknowledges the Polish National Agency for Academic Exchange for grant PPN/BEK/2019/1/00421 under the Bekker programme and the Ministry of Science and Higher Education (Poland) under the scholarship for outstanding young scientists (692/STYP/13/2018). This work was supported by the Ministerio de Ciencia e Innovación of Spain with research grants PID2021-124407NB-I00 and TED2021-130758B-I00.References
1 Novikov, D. S., Veraart, J., Jelescu, I. O., & Fieremans, E. (2018). Rotationally-invariant mapping of scalar and orientational metrics of neuronal microstructure with diffusion MRI. NeuroImage, 174, 518–538. https://doi.org/10.1016/j.neuroimage.2018.03.006
2 Tristán-Vega A, Aja-Fernández S, Westin CF. (2012). Least squares for diffusion tensor estimation revisited: propagation of uncertainty with Rician and non-Rician signals. Neuroimage; 59:4032–43.2.
3 Coelho, S., Baete, S. H., Lemberskiy, G., Ades-Aron, B., Barrol, G., Veraart, J., Novikov, D. S., & Fieremans, E. (2022). Reproducibility of the Standard Model of diffusion in white matter on clinical MRI systems. NeuroImage, 257, 119290. https://doi.org/10.1016/j.neuroimage.2022.119290
4 Reisert, M., Kellner, E., Dhital, B., Hennig, J., & Kiselev, V. G. (2017). Disentangling micro from mesostructure by diffusion MRI: A Bayesian approach. NeuroImage, 147, 964–975. https://doi.org/10.1016/j.neuroimage.2016.09.058
5 Aja-Fernández, S., & Vegas-Sánchez-Ferrero, G. (2016). Statistical analysis of noise in MRI: Modeling, filtering and estimation. Springer
6 Veraart J, Van Cauter S, Sunaert S, Sijbers J. (2012) Conditional least squares estimation of diffusion MRI parameters. Magnetic resonance in medicine: official journal of the Society of Magnetic Resonance in Medicine/Society of Magnetic Resonance in Medicine To appear [Internet]; Available from: https://archive.ismrm.org/2012/3575.html
7 Leysen, S., Sunaert S., Maes, F., & Christiaens, D. (2023). Voxel-level denoising of diffusion MRI using a rank-1 decomposition. Proceedings International Society Magnetic Resonance Medicine, 5016.
Figures