3482
Fostering Confidence: Evaluating the Reproducibility and Reliability of Bingham-NODDI Model Measures on Different 3.0 T MRI Scanners1Department of Physics and Astronomy, University of Bologna, Bologna, Italy, 2Oxford Centre for Clinical Magnetic Resonance Research, University of Oxford, Oxford, United Kingdom, 3Department of Computer Science, University of Pisa, Pisa, Italy, 4INFN, Division of Bologna, Bologna, Italy, 5Department of Radiology, Oxford University Hospitals, Oxford, United Kingdom
Synopsis
Keywords: Diffusion Modeling, Microstructure, Multicenter study, multicenter phantom study, multicenter stability assessment of Bingham-NODDI model, Bingham-NODDI model, NODDI model
Motivation: The NODDI model has been proven to be a powerful tool, however it struggles to depict complex brain neurite structures.
Goal(s): The Bingham-NODDI model offers a more detailed approach for capturing pathological-related brain changes, although its validation is still ongoing. This study aims to make progress in this direction.
Approach: To assess the Bingham-NODDI model's reliability across different MRI scanner systems, this study uses a consistent acquisition protocol, fostering the model's robustness.
Results: The outcomes confirm Bingham-NODDI model’s reliability, promising potential clinical applications. By enhancing generalizability and validation, this research clears the path for improved diagnostic and research tools in neuroscience.
Impact: The Bingham-NODDI model offers valuable insights into brain microstructure changes. Its integration into clinical practice alongside medical teams and neuroscientists is highly promising. This multi-center study advances this goal by assessing model stability, fostering future collaborations between scientistis and clinicians.
INTRODUCTION
Recently, a diffusion model has been introduced to estimate neurite orientation dispersion and density imaging (NODDI)1. The Bingham-NODDI2 model extends the Watson-NODDI formalism to address complex fiber structures (e.g., fanning and bending), providing more detailed and biologically relevant information about the organization of neurites in the brain, which can be extremely useful when dealing with pathologies such as Multiple Sclerosis. While the model demonstrates significant capabilities, its validation process is still pending3. This work proposes to assess the consistency and comparability of data across different MRI systems through the validation of an MRI test object. To do so, the current study exploits phantom scans to monitor for any scanner-related differences on two 3T high-field scanner systems (GE Signa Premier and Siemens MAGNETOM Prisma). Furthermore, inferring reliability of the Bingham-NODDI parameters (i.e., Orientation Dispersion Index, Intra- and extra-cellular volume fractions) and the Diffusion Tensor model indices (i.e., Fractional Anisotropy and Mean Diffusivity) from data collected across different MRI scanner systems contributes to the robustness and clinical applicability of the model. This would advance our understanding of brain microstructure establishing the model as a reliable tool for researchers and clinicians.METHODS
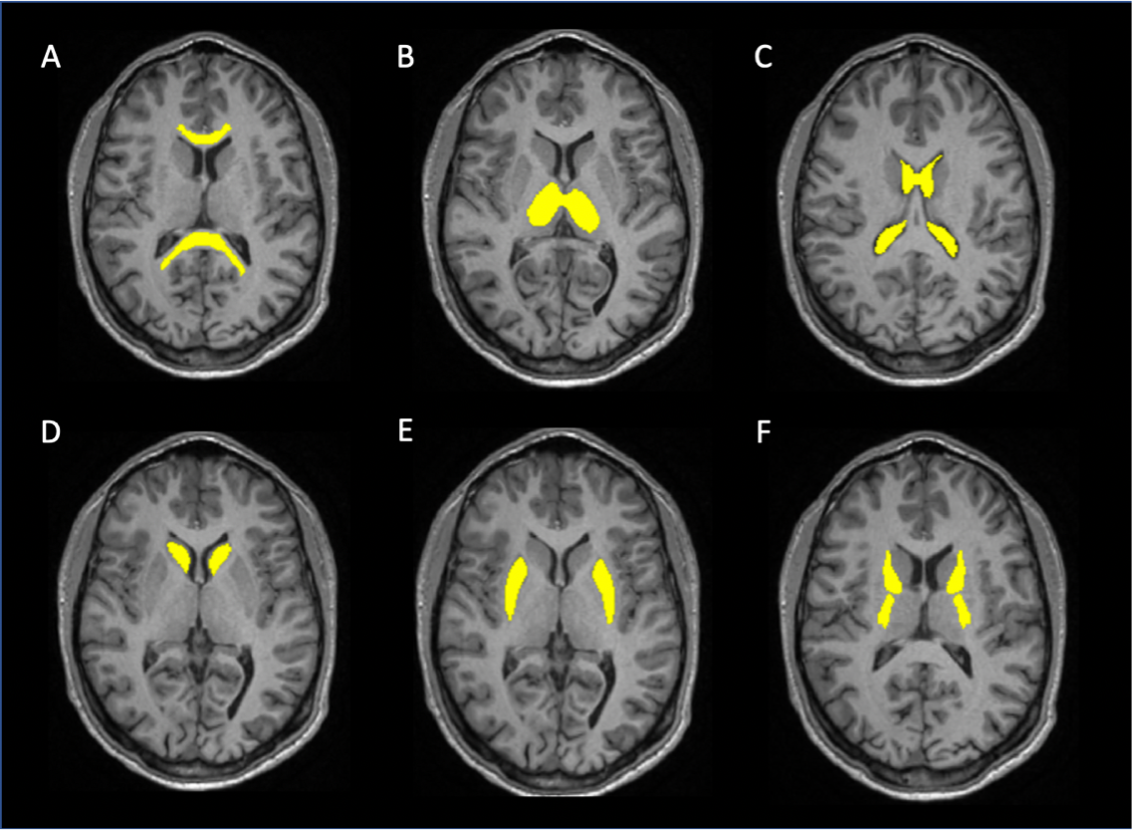
A DTI phantom4 was scanned twice on the same day for each scanner acquisition using GE-Premier and Siemens Prisma systems using 21- and 20-channel head and neck coils, respectively. The systems have maximum gradient strength/slew rates of 80 mT/m and 200 T/m/s, respectively. Scans on the GE Premier were acquired with a 2D spin-echo EPI sequence, with Echo Time (TE)/Repetition Times (TR) TE/TR = 76.9/6000 ms, respectively. Scans on the Siemens Prisma were acquired using a single-refocused (monopolar) and a twice-refocused (bipolar) spin echo EPI sequence, TE/TR = 69/6000 ms and TE/TR = 81/6400 ms , respectively. The Field of View (FOV) was 240mm x 240mm, Slice thickness was 2.5mm, acquisition and reconstruction matrices were 96x96. For both systems, 9 images were acquired with no diffusion gradients applied (b-value = 0 s/mm2), together with 90 diffusion-weighted images (b-value=1000, 2600 s/mm2). Data was pre-processed (eddy/topup/dtifit) with FSL, and then processed using DMIPY with a Bingham-NODDI implementation, extracting results from the fiber ring region and calculating the coefficient of variation (CV) to assess intra-site index consistency. Furthermore, in-vivo data was acquired from a healthy volunteer using the same acquisition protocol on the GE Premier and Siemens Prisma, TE/TR = 71/6000 ms, the GE used simultaneous multi-slice = 2. For each Bingham-NODDI metric, the mean and standard deviation were extracted from all the ROIs considered in Figure 1.RESULTS AND DISCUSSION
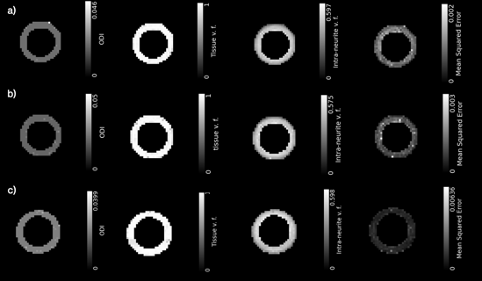
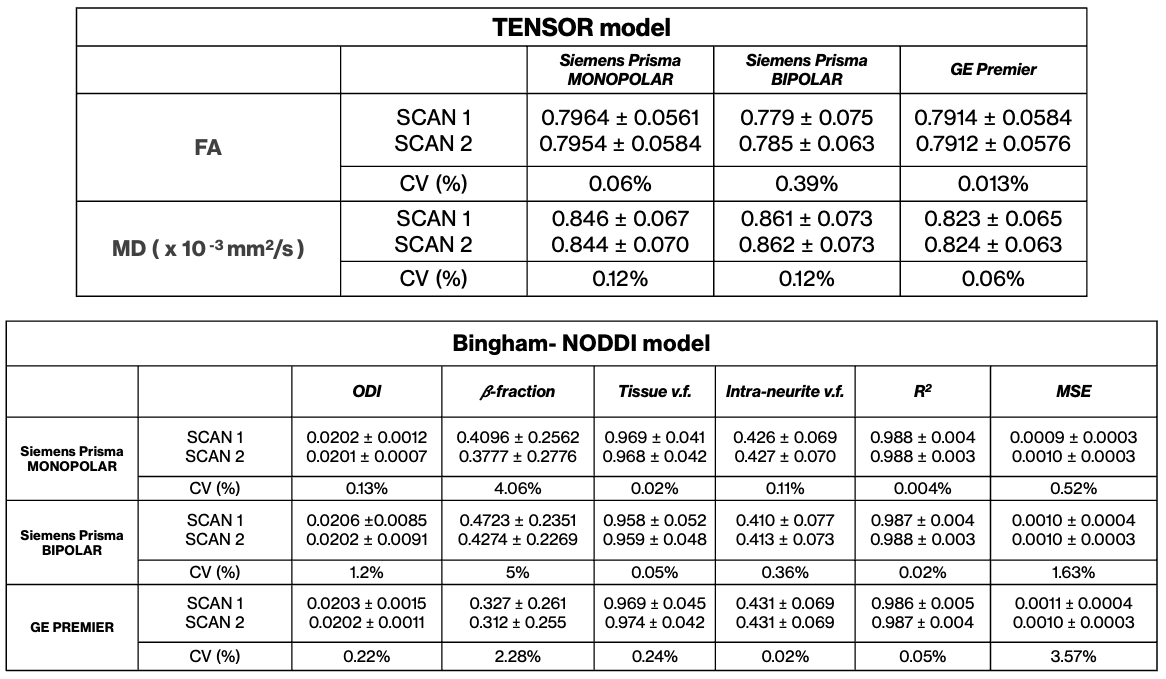
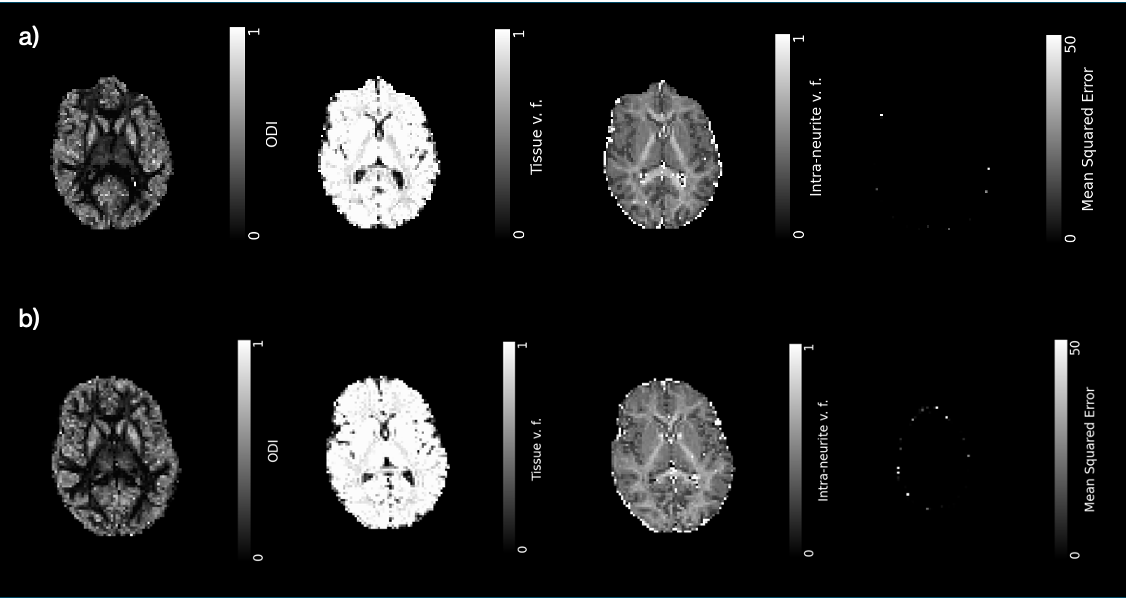
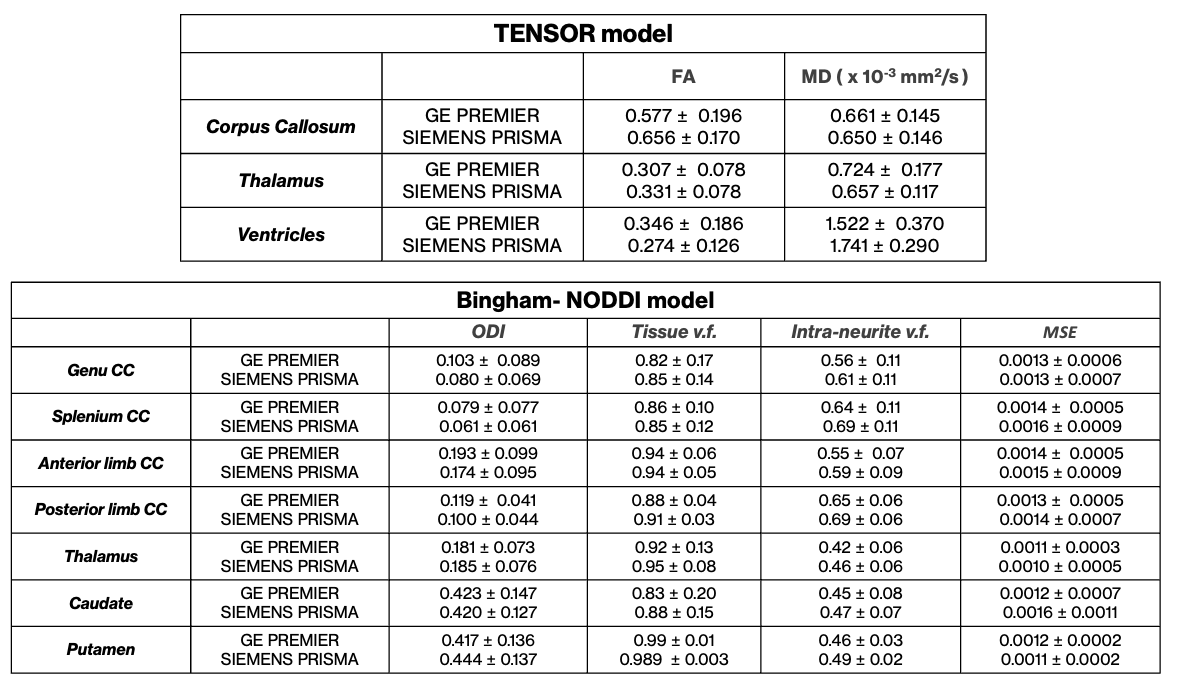
Regarding the phantom study, Tensor model and Bingham-NODDI model metric results are shown in Table 1. Intra-scanner results show little variation as demonstrated by low CV values, indicating consistency of results. Comparing results obtained from different scanner systems demonstrate reliable values for a multi-centre DTI acquisition, particularly of the Bingham-NODDI model indices, congruent with the expected values provided by the manufacturer. As results show little variation, one scan has been chosen for each scanner acquisition to show maps of the Bingham-NODDI model metrics, as shown in Figure 3. The ODI index, reflecting the extent of neurite orientation dispersion, consistently maintains values near zero across the fibre ring region. These values suggest minimal dispersion in this volume. The tissue volume fraction is shown to be almost equal to 1, indicating the absence of any water component in the fibre ring. Regarding the in-vivo data, Tensor and Bingham-NODDI model metrics results are shown in Table 2 and indicate congruent values within the margin of errors, confirming the stability of the acquisitions. However, there are still slight differences between the two scanners, with the inter-site variation being greater than the intra-site variation in our setting. Quantitative maps of the Bingham-NODDI model are shown in Figure 3, showing great contrast in the ODI map highlighting differences in neurite structure complexity between white matter and gray matter.CONCLUSIONS
Bingham-NODDI model results are shown to be consistence across different MRI scanners acquisitions, allowing for multi-centre studies to take a step forward in the clinical application of this model. The next step involves evaluating the stability and reproducibility of the Bingham-NODDI model results over time by acquiring data on a cohort of healthy volunteers on multiple days. This approach would allow to the model’s reliability intra-system and inter-system to be assessed fully. If successful, this would advance the model’s potential in future collaborative research and clinical applications.Acknowledgements
No acknowledgement found.References
[1] Zhang, Hui, et al. "NODDI: practical in vivo neurite orientation dispersion and density imaging of the human brain." Neuroimage 61.4 (2012): 1000-1016.
[2] Tariq, Maira, et al. "Bingham–NODDI: Mapping anisotropic orientation dispersion of neurites using diffusion MRI." Neuroimage 133 (2016): 207-223.
[3] Jansen, Jacobus FA, et al. "Reproducibility of quantitative cerebral T2 relaxometry, diffusion tensor imaging, and 1H magnetic resonance spectroscopy at 3.0 Tesla." Investigative radiology 42.6 (2007): 327-337.
[4] Laun, F. B., Huff, S. & Stieltjes, B. On the effects of dephasing due to local gradients in diffusion tensor imaging experiments: relevance for diffusion tensor imaging fiber phantoms. Magn Reson Imaging 27, 541–548 (2009).
Figures