3474
Mouse Brain Microstructural Changes by High-resolution Diffusion Magnetic Resonance Imaging and Spatial Transcriptomics During Development1Radiology and Imaging Sciences, Indiana University, Indianapolis, IN, United States, 2Department of Neurology, Duke University, Durham, NC, United States, 3Department of Radiology, Duke University, Durham, NC, United States, 4Department of Biomedical Engineering, Duke University, Durham, NC, United States, 5Stark Neurosciences Research Institute, Indiana University, Indianapolis, IN, United States
Synopsis
Keywords: Microstructure, Brain, Spatial Transcriptomics
Motivation: Characterizing developmental brain microstructure changes is important for understanding the mechanism of brain development at cellular level.
Goal(s): We aimed to study brain microstructure and to correlate phenotypical diffusivity variations with genotypic expression profiles.
Approach: We imaged postnatal mouse brains by high-resolution diffusion magnetic resonance imaging (dMRI) with both DTI and NODDI models to extract quantitative diffusion metrics. dMRI-gene expression correlation was tested by regression model.
Results: Distinct growth patterns are observed by quantitative dMRI parameters in white matter bundles, isocortex, hippocampus, and cerebellum. Genes related to nerve system displayed unique spatial and temporal expression patterns corresponding with dMRI alternations during brain development.
Impact: This study may improve our understanding of brain microstructure changes during postnatal development at molecular and cellular level. This study also provides non-invasive imaging techniques to quantitatively investigate neurodevelopmental disorders at high resolution.
Introduction
Diffusion magnetic resonance imaging (dMRI) with biophysical models such as diffusion tensor imaging (DTI) model and neurite orientation dispersion and density imaging (NODDI) model can provide quantitative structural information1-4. Such techniques have been applied to track neurological changes during brain development1,5-7. However, most of the studies were limited with low spatial resolution and the basic tensor model8-11. On the other hand, neural phenotypic variations are associated with spatial genotypic expression profiles in developing brain12-15. Spatial transcriptomics can identify key developmental genes with their unique expression profiles16,17. This study will fill the gap of phenotype (dMRI)-genotype (gene expression) associations in developing mouse brain at molecular level.Methods
We acquired high-resolution (32 um isotropic) mouse (n = 3, wild-type male C57BL/6J) brains diffusion MRI images (b value = 1000, 4000, 6000, 8000 s/mm2, TR = 100 ms, TE = 16 ms, BW = 156 kHz) at two postnatal days (P4 and P14) and used compressed sensing18 to accelerate imaging acquisition. We extracted both DTI and NODDI parameters through the whole brain by DSI Studio and Matlab, respectively. For direct comparison of dMRI and gene expression, we integrated dMRI maps into Allen Developing Mouse Brain Atlas (ADMBA) using Advanced Normalization Tools19, and selected ADMBA-based brain regions. Meanwhile, we investigated the spatial expression profiles of 2002 brain development related gene at P4 and P14 mouse, and then examined the correlation between the gene expression profiles with DTI and NODDI parameters by using partial least squares (PLS) regression model. We further identified the most over-expressed genes associated with DTI and NODDI parameters using gene ontology (GO) enrichment analysis on the above genes, ranked by their variable importance in projection scores from the PLS model.Results
Figure 1 shows the brain volume, qualitative (b0, Diffusion-weighted image (DWI), and Diffusion-encoded-color image (DEC)), and quantitative (fractional anisotropy (FA), mean diffusivity (MD), neurite density index (NDI), and orientation dispersion index (ODI)) dMRI maps. From P4 to P14, mouse brain has increasing brain volume (Figure 1a); corpus callosum (cc, red arrows) shows no image contrast at b0 image (Figure 1b) but high contrast at DWI (Figure 1c) and DEC (Figure 1d) images; White matter (WM) bundles (including cc in red arrows) have high contrast in quantitative maps (Figure 1e-h) at both P4 and P14.Figure 2 shows the dMRI parametric images registered to ADMBA space. The labels from the ADMBA (Figure 2, left) were transformed back to dMRI space (Figure 2, center and right).
Figure 3 illustrates the DTI and NODDI parameter changes at different regions of the developing mouse brain. Different developmental patterns are demonstrated in telencephalic vesicle (Tel), retrosplenial cortex (RSP) and the other regions: MD (Figure 3c) is constant in Tel and RSP but increased in the other regions; FA and AD (Figure 3de, respectively) are decreased in Tel but increased in the other regions; RD (Figure 3f) is constant in RSP but increased in the other regions; ODI (Figure 3g) is increased in Tel but decreased in the other regions; NDI (Figure 3h) is constant in Tel and RSP but decreased in the other regions.
Figure 4 demonstrates that gene expression profiles were associated with dMRI parameters. Specifically, PLS first component (PLS1) was associated with temporal alternations (Figure 4ab, both red and yellow arrows from top to bottom) and PLS second component (PLS2) was associated with spatial alternations (Figure 4ab, between red and yellow arrows). Figure 4c shows that PLS components were negatively correlated with DTI metrics (Figure 4c, left), and positively correlated with NODDI metrics (Figure 4c, right).
Figure 5 visualizes the results of GO enrichment analysis. The most enriched GO terms were associated with signal transport and neuron communication, nerve system, and activities of neurotransmitter and construction of nerve structure under biological process (Figure 5a), cellular component (Figure 5b), and molecular function (Figure 5c) aspects, respectively.
Discussion
dMRI is a promising imaging technique for characterizing microstructure changes in the developing brain. We observed that different brain regions showed different growth trends by dMRI parameters, meaning that they have different development patterns. At molecular scale, brain development is coordinated by genes expressing at varied levels. The genes of interest exhibited spatial and temporal correlations with dMRI. GO enrichment analysis highlighted that these genes are highly enriched in nerve system structure and function.Conclusion
White matter bundles and cortex regions show distinct development patterns captured by high-resolution dMRI. Genes related to nerve system displayed unique spatial and temporal expression patterns corresponding with dMRI alternations during brain development.Acknowledgements
The MRI images were acquired in the Center for In Vivo Microscopy at Duke University with the support of NIH P41 EB015897. This work was supported by the NIH R01 NS125020, Ralph W. and Grace M. Showalter Research Award, Indiana Center for Diabetes and Metabolic Diseases Pilot and Feasibility Grant, and IUSM Roberts Drug Discovery Fund & TREAT-AD Center Grant.References
1. D. Le Bihan, “Looking into the functional architecture of the brain with diffusion MRI,” Nat. Rev. Neurosci., vol. 4, no. 6, pp. 469–480, 2003.
2. C. Andica et al., “MR biomarkers of degenerative brain disorders derived from diffusion imaging,” J. Magn. Reson. Imaging, vol. 52, no. 6, pp. 1620–1636, 2020.
3. A. L. Alexander, J. E. Lee, M. Lazar, and A. S. Field, “Diffusion tensor imaging of the brain,” Neurotherapeutics, vol. 4, no. 3, pp. 316–329, 2007.
4. H. Zhang, T. Schneider, C. A. Wheeler-Kingshott, and D. C. Alexander, “NODDI: practical in vivo neurite orientation dispersion and density imaging of the human brain,” Neuroimage, vol. 61, no. 4, pp. 1000–1016, 2012.
5. S. A. Bayer and J. Altman, “Neocortical development,” No Title, 1991.
6. S. Baloch et al., “Quantification of brain maturation and growth patterns in C57BL/6J mice via computational neuroanatomy of diffusion tensor images,” Cereb. Cortex, vol. 19, no. 3, pp. 675–687, 2009.
7. R. C. McKinstry et al., “Radial organization of developing preterm human cerebral cortex revealed by non-invasive water diffusion anisotropy MRI,” Cereb. Cortex, vol. 12, no. 12, pp. 1237–1243, 2002.
8. N. Chuang et al., “An MRI-based atlas and database of the developing mouse brain,” Neuroimage, vol. 54, no. 1, pp. 80–89, 2011.
9. J. Zhang, L. J. Richards, P. Yarowsky, H. Huang, P. C. Van Zijl, and S. Mori, “Three-dimensional anatomical characterization of the developing mouse brain by diffusion tensor microimaging,” Neuroimage, vol. 20, no. 3, pp. 1639–1648, 2003.
10. S. Mori et al., “Diffusion tensor imaging of the developing mouse brain,” Magn. Reson. Med. Off. J. Int. Soc. Magn. Reson. Med., vol. 46, no. 1, pp. 18–23, 2001.
11. F. A. Kronman et al., “Developmental Mouse Brain Common Coordinate Framework,” bioRxiv, pp. 2023–09, 2023.
12. A. Arnatkevic̆iūtė, B. D. Fulcher, and A. Fornito, “A practical guide to linking brain-wide gene expression and neuroimaging data,” Neuroimage, vol. 189, pp. 353–367, 2019.
13. A. Fornito, A. Arnatkevičiūtė, and B. D. Fulcher, “Bridging the gap between connectome and transcriptome,” Trends Cogn. Sci., vol. 23, no. 1, pp. 34–50, 2019.
14. E. S. Lein, T. G. Belgard, M. Hawrylycz, and Z. Molnár, “Transcriptomic perspectives on neocortical structure, development, evolution, and disease,” Annu. Rev. Neurosci., vol. 40, pp. 629–652, 2017.
15. E. S. Lein et al., “Genome-wide atlas of gene expression in the adult mouse brain,” Nature, vol. 445, no. 7124, pp. 168–176, 2007.
16. G. La Manno et al., “Molecular architecture of the developing mouse brain,” Nature, vol. 596, no. 7870, pp. 92–96, 2021.
17. A. B. Rosenberg et al., “Single-cell profiling of the developing mouse brain and spinal cord with split-pool barcoding,” Science, vol. 360, no. 6385, pp. 176–182, 2018.
18. M. Lustig, D. Donoho, and J. M. Pauly, “Sparse MRI: The application of compressed sensing for rapid MR imaging,” Magn. Reson. Med. Off. J. Int. Soc. Magn. Reson. Med., vol. 58, no. 6, pp. 1182–1195, 2007.
19. N. Wang et al., “Integrating multimodality magnetic resonance imaging to the Allen Mouse Brain Common Coordinate Framework,” NMR Biomed., vol. 36, no. 5, p. e4887, May 2023, doi: 10.1002/nbm.4887.
Figures
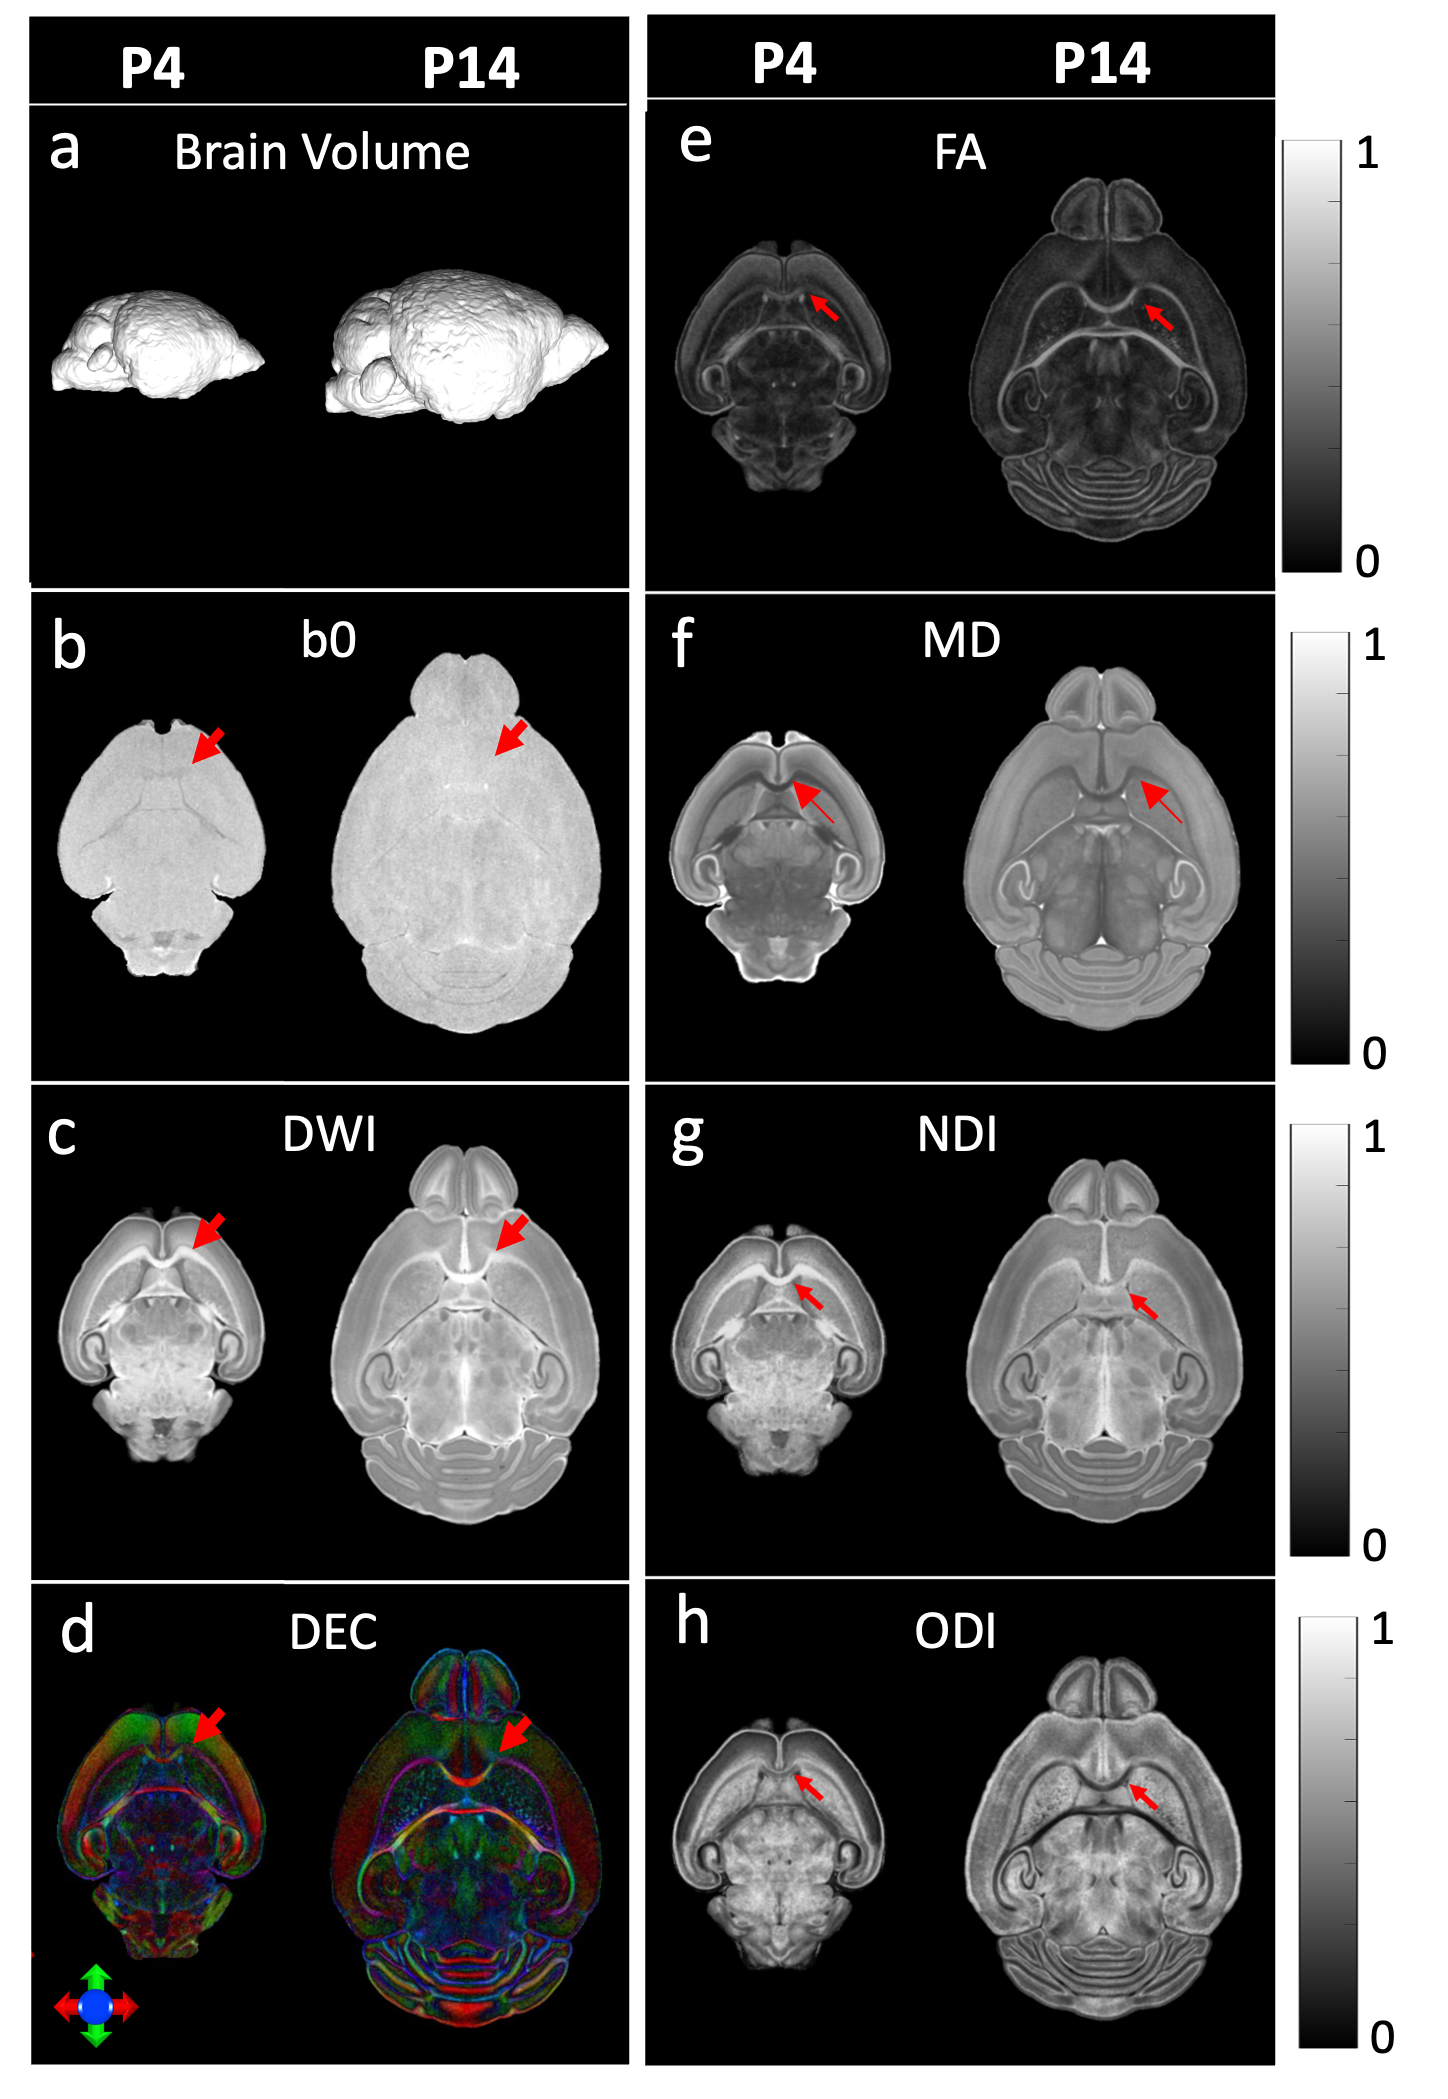
Figure 1. Brain volume (a), qualitative maps including b0 (b), diffusion-weighted image (DWI, c), and diffusion-encoded-color (DEC, d) image, and quantitative maps including FA (e), MD (f), NDI (g), and ODI (h) of mouse brains at postnatal day 4 and day 14. Red arrows=corpus callosum.
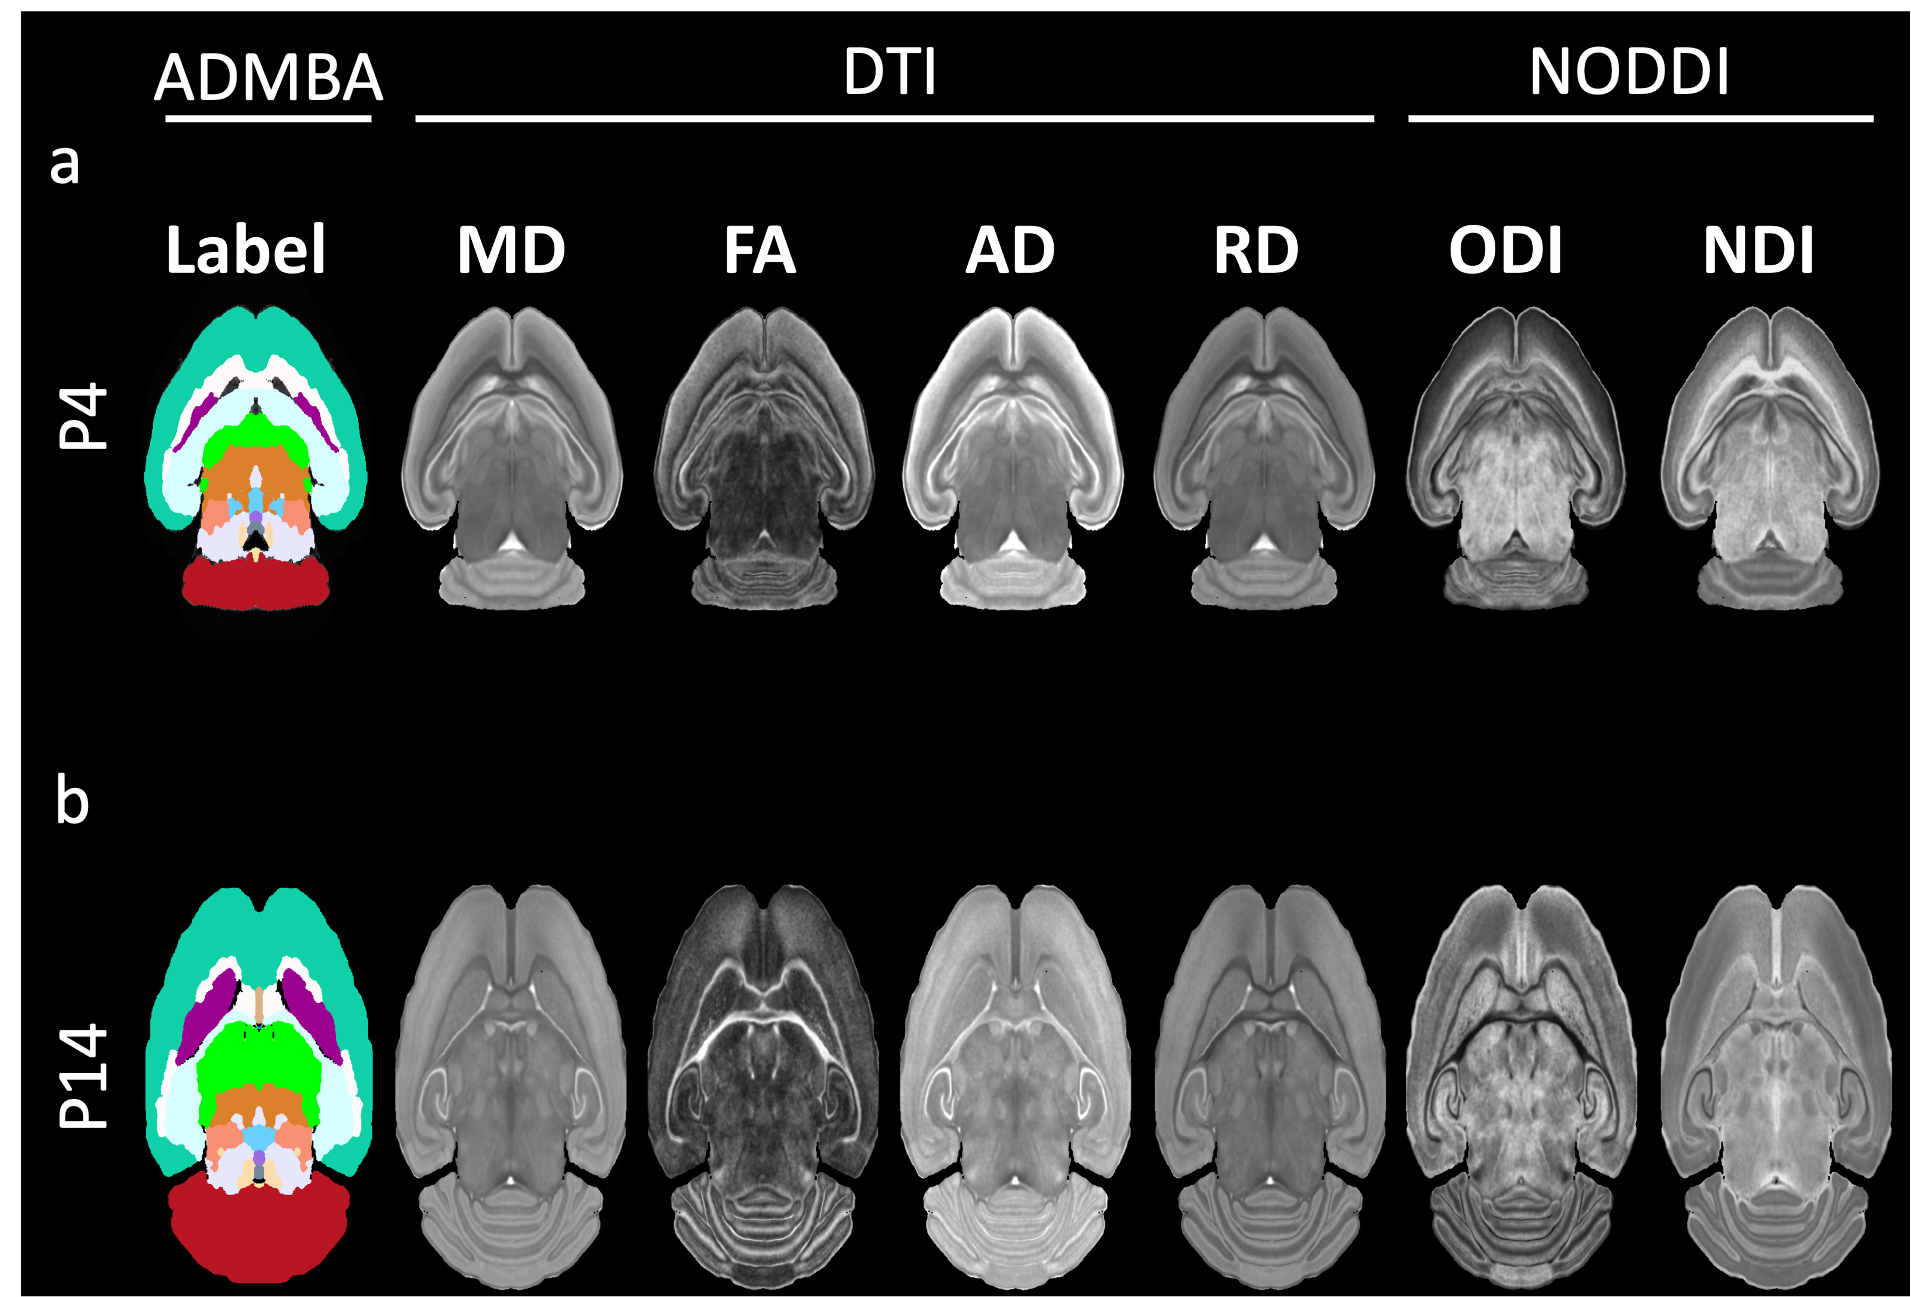
Figure 2. The registered ADMBA images (left) and dMRI images (center: DTI images, right: NODDI images) at P4 (a) and P14 (b).
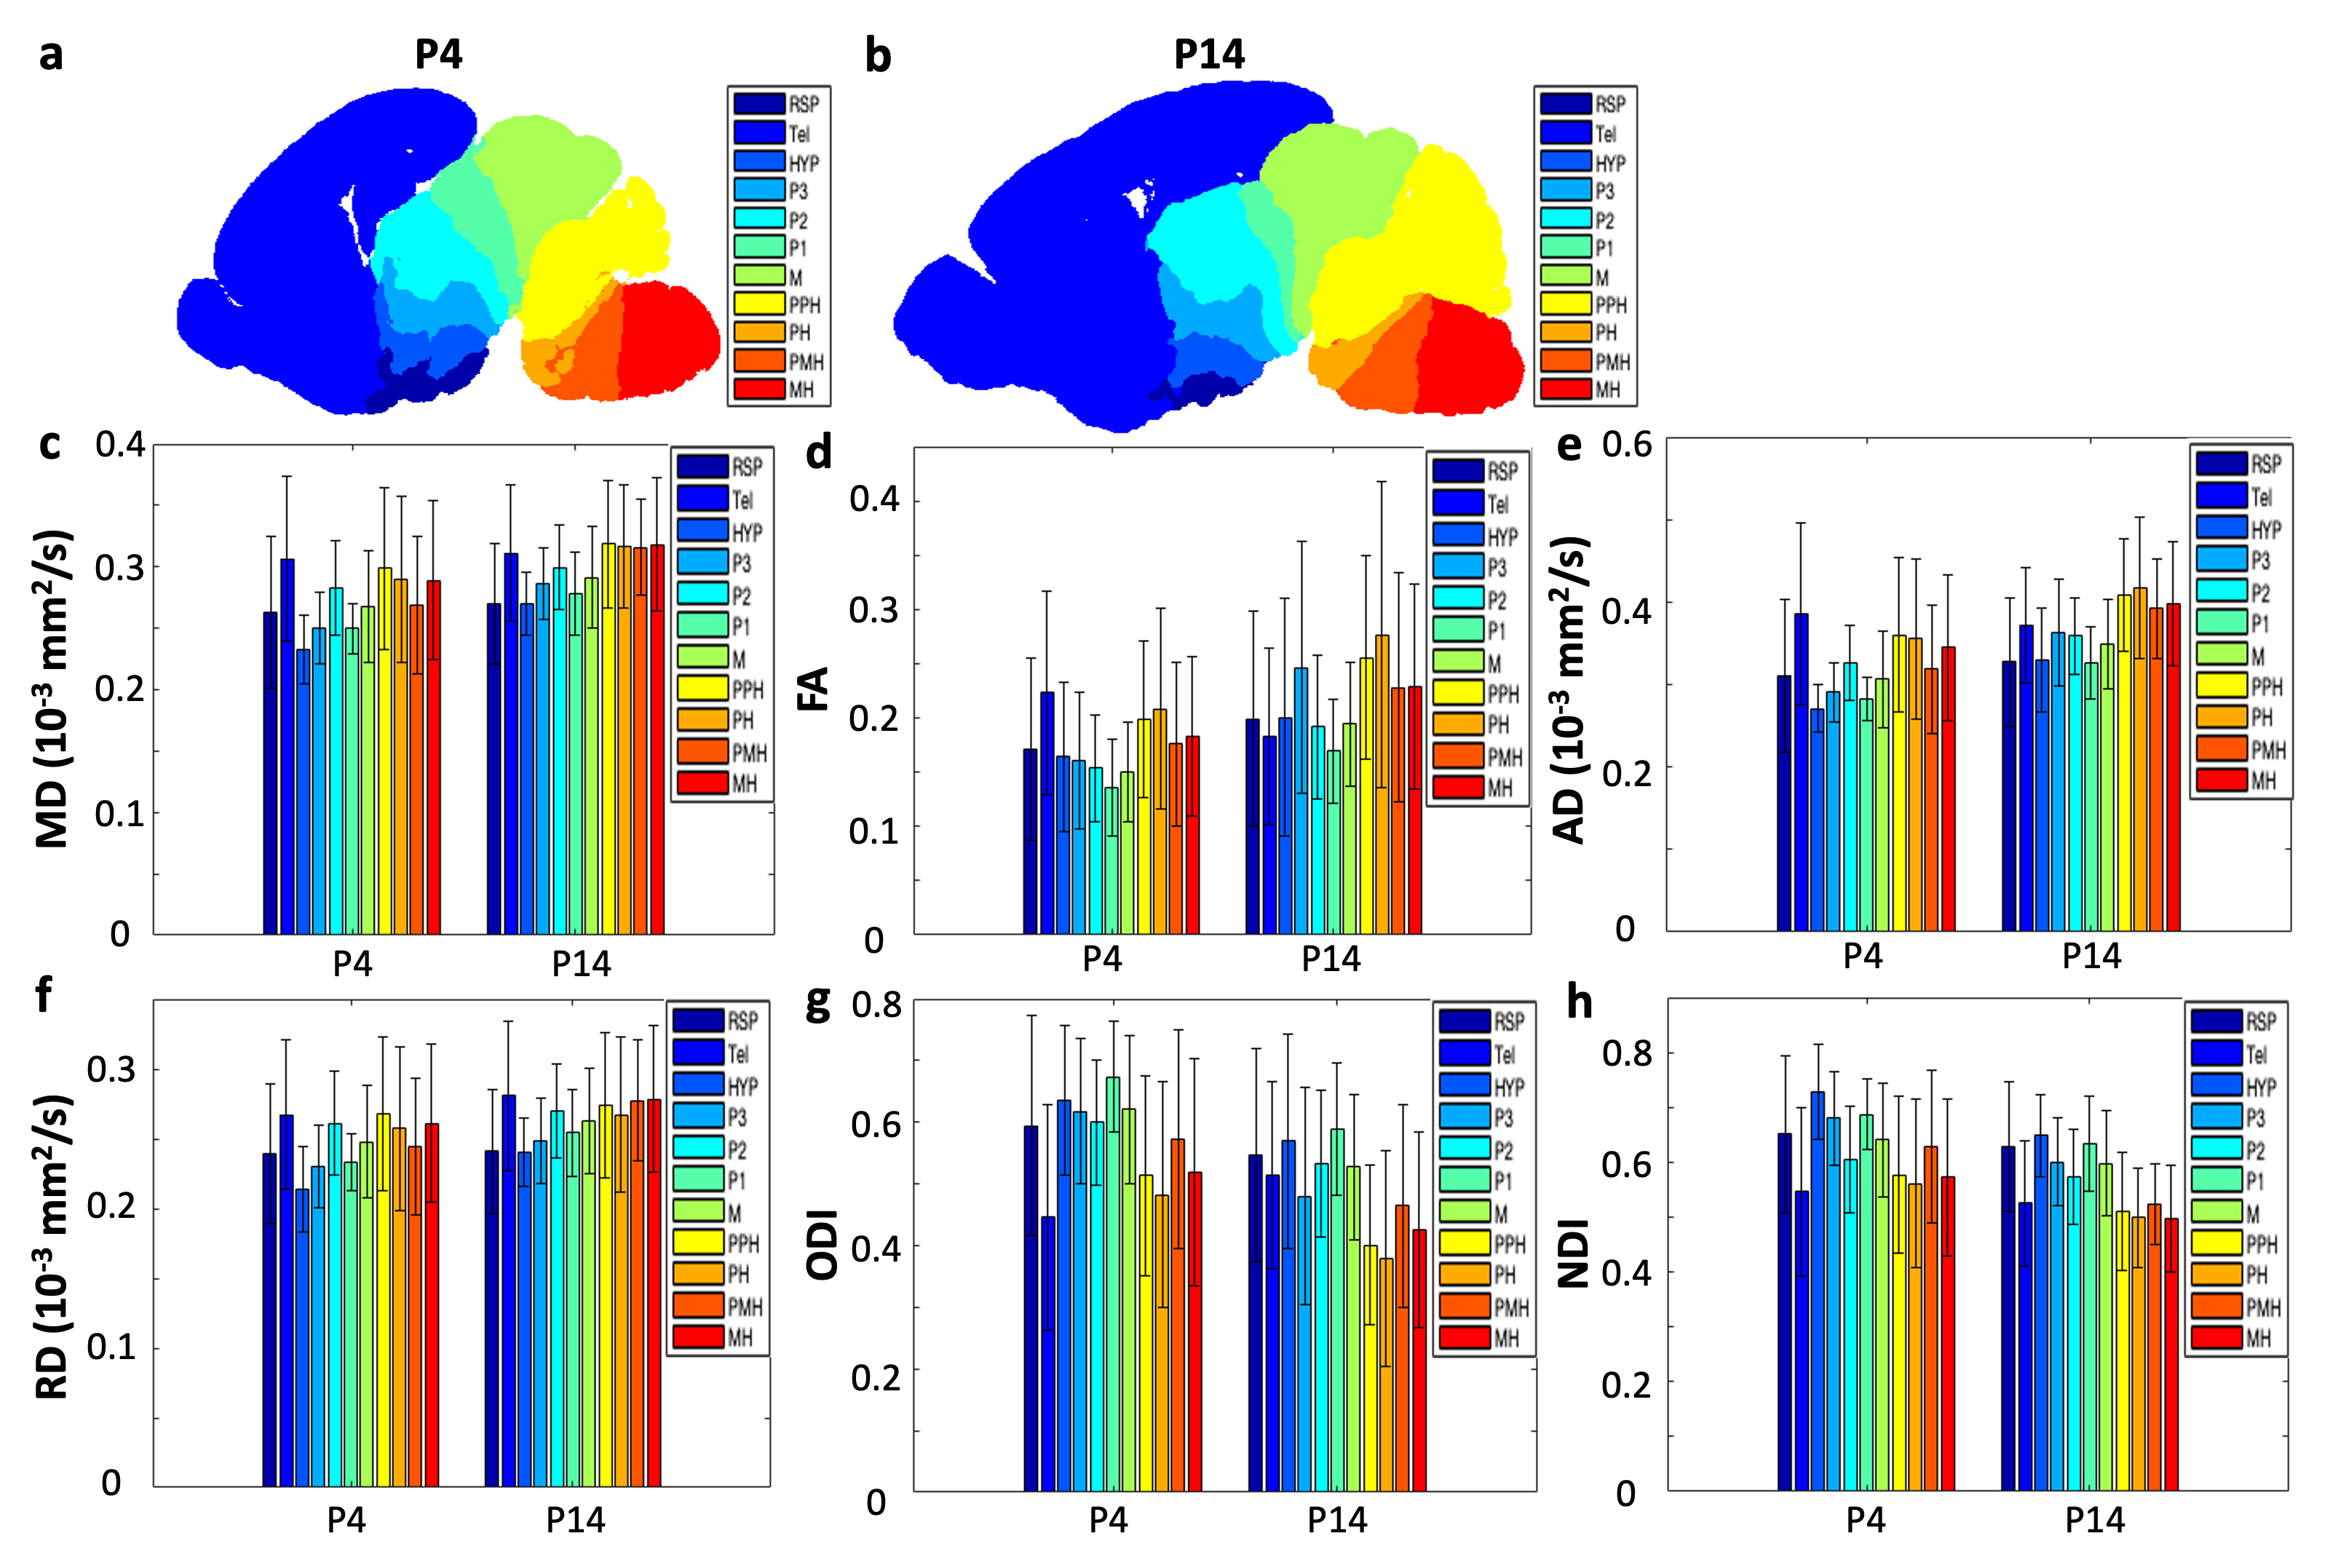
Figure 3. (a, b) The location of ROIs for gene-dMRI correlation analysis at P4 (a) and P14 (b) mouse brains. (c-h) The DTI (c: MD, d: FA, e: AD, and f: RD), and NODDI (g: ODI, h: NDI) changes in ROIs during brain development.
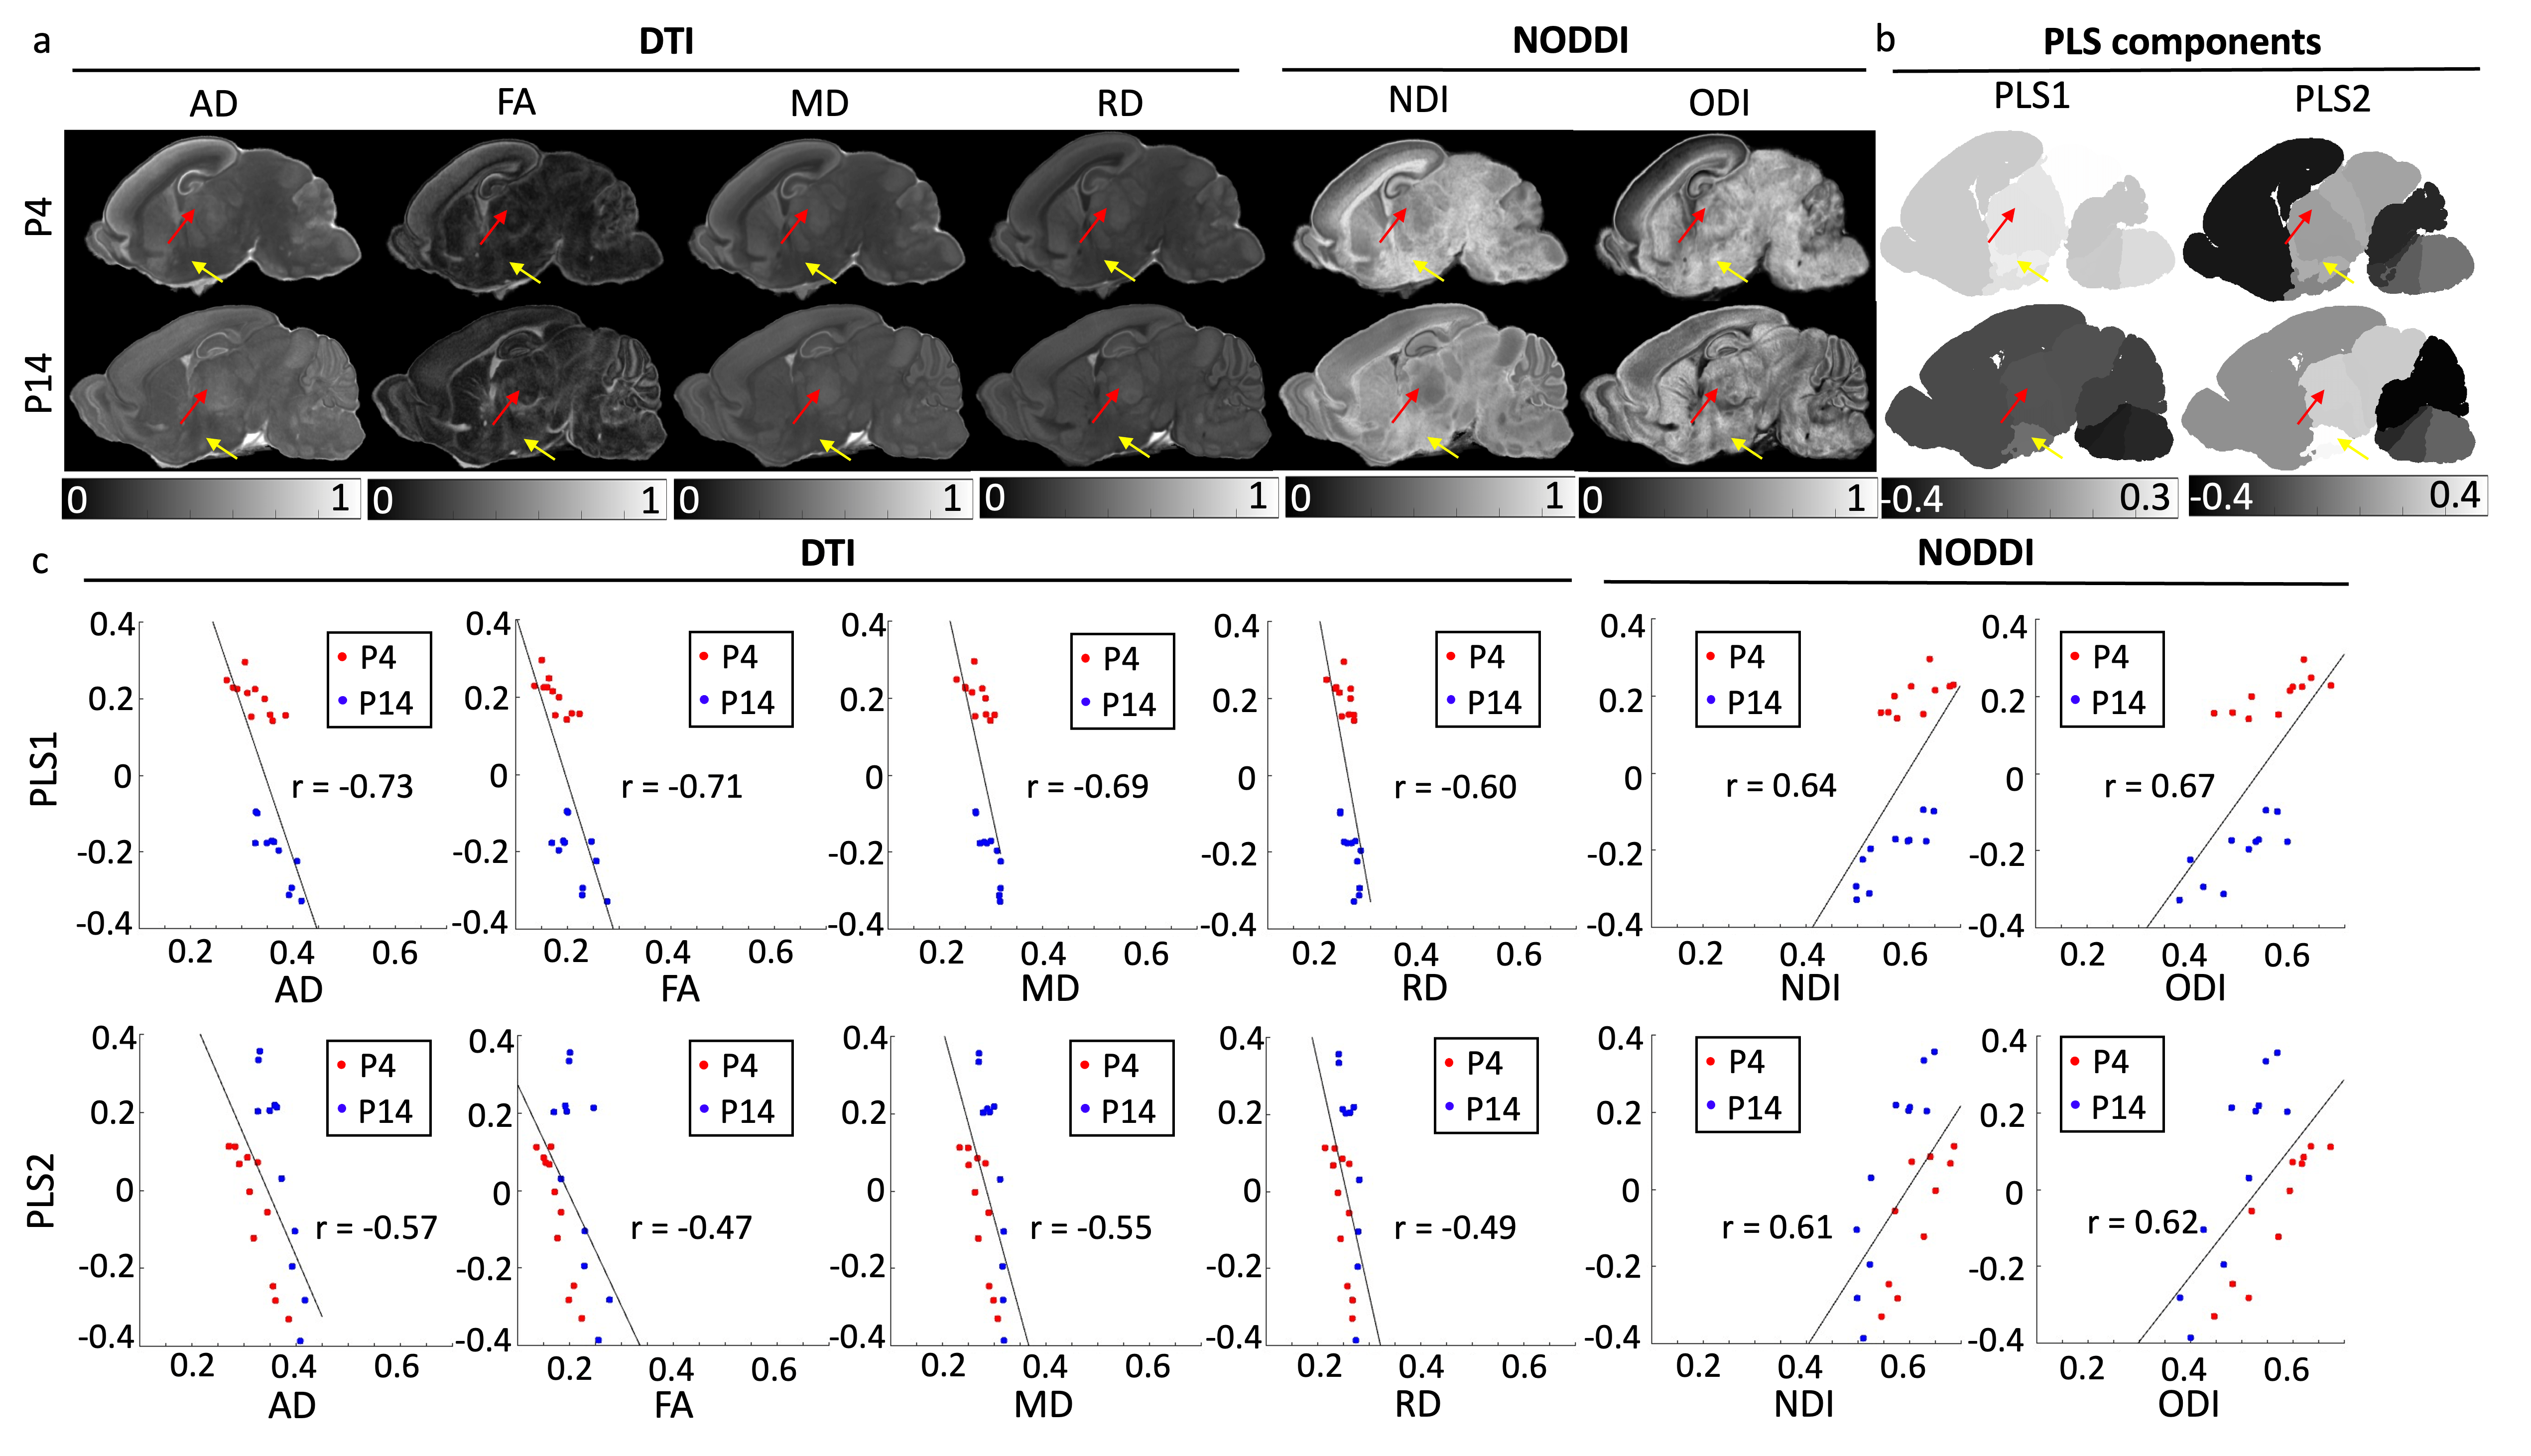
Figure 4. dMRI parameters, partial least squares components, and their correlations at P4 and P14. (a) dMRI parameter changes from P4 to P14. (b) PLS components changes from P4 to P14. Red arrows = p2, yellow arrows = HYP. (c) Correlation plots of partial least squares components and dMRI parameters. Red dots are ROIs from P4, and blue dots are ROIs from P14. Pearson’s correlation r-values are denoted at each correlation plot. All correlations are significant (p<0.05).
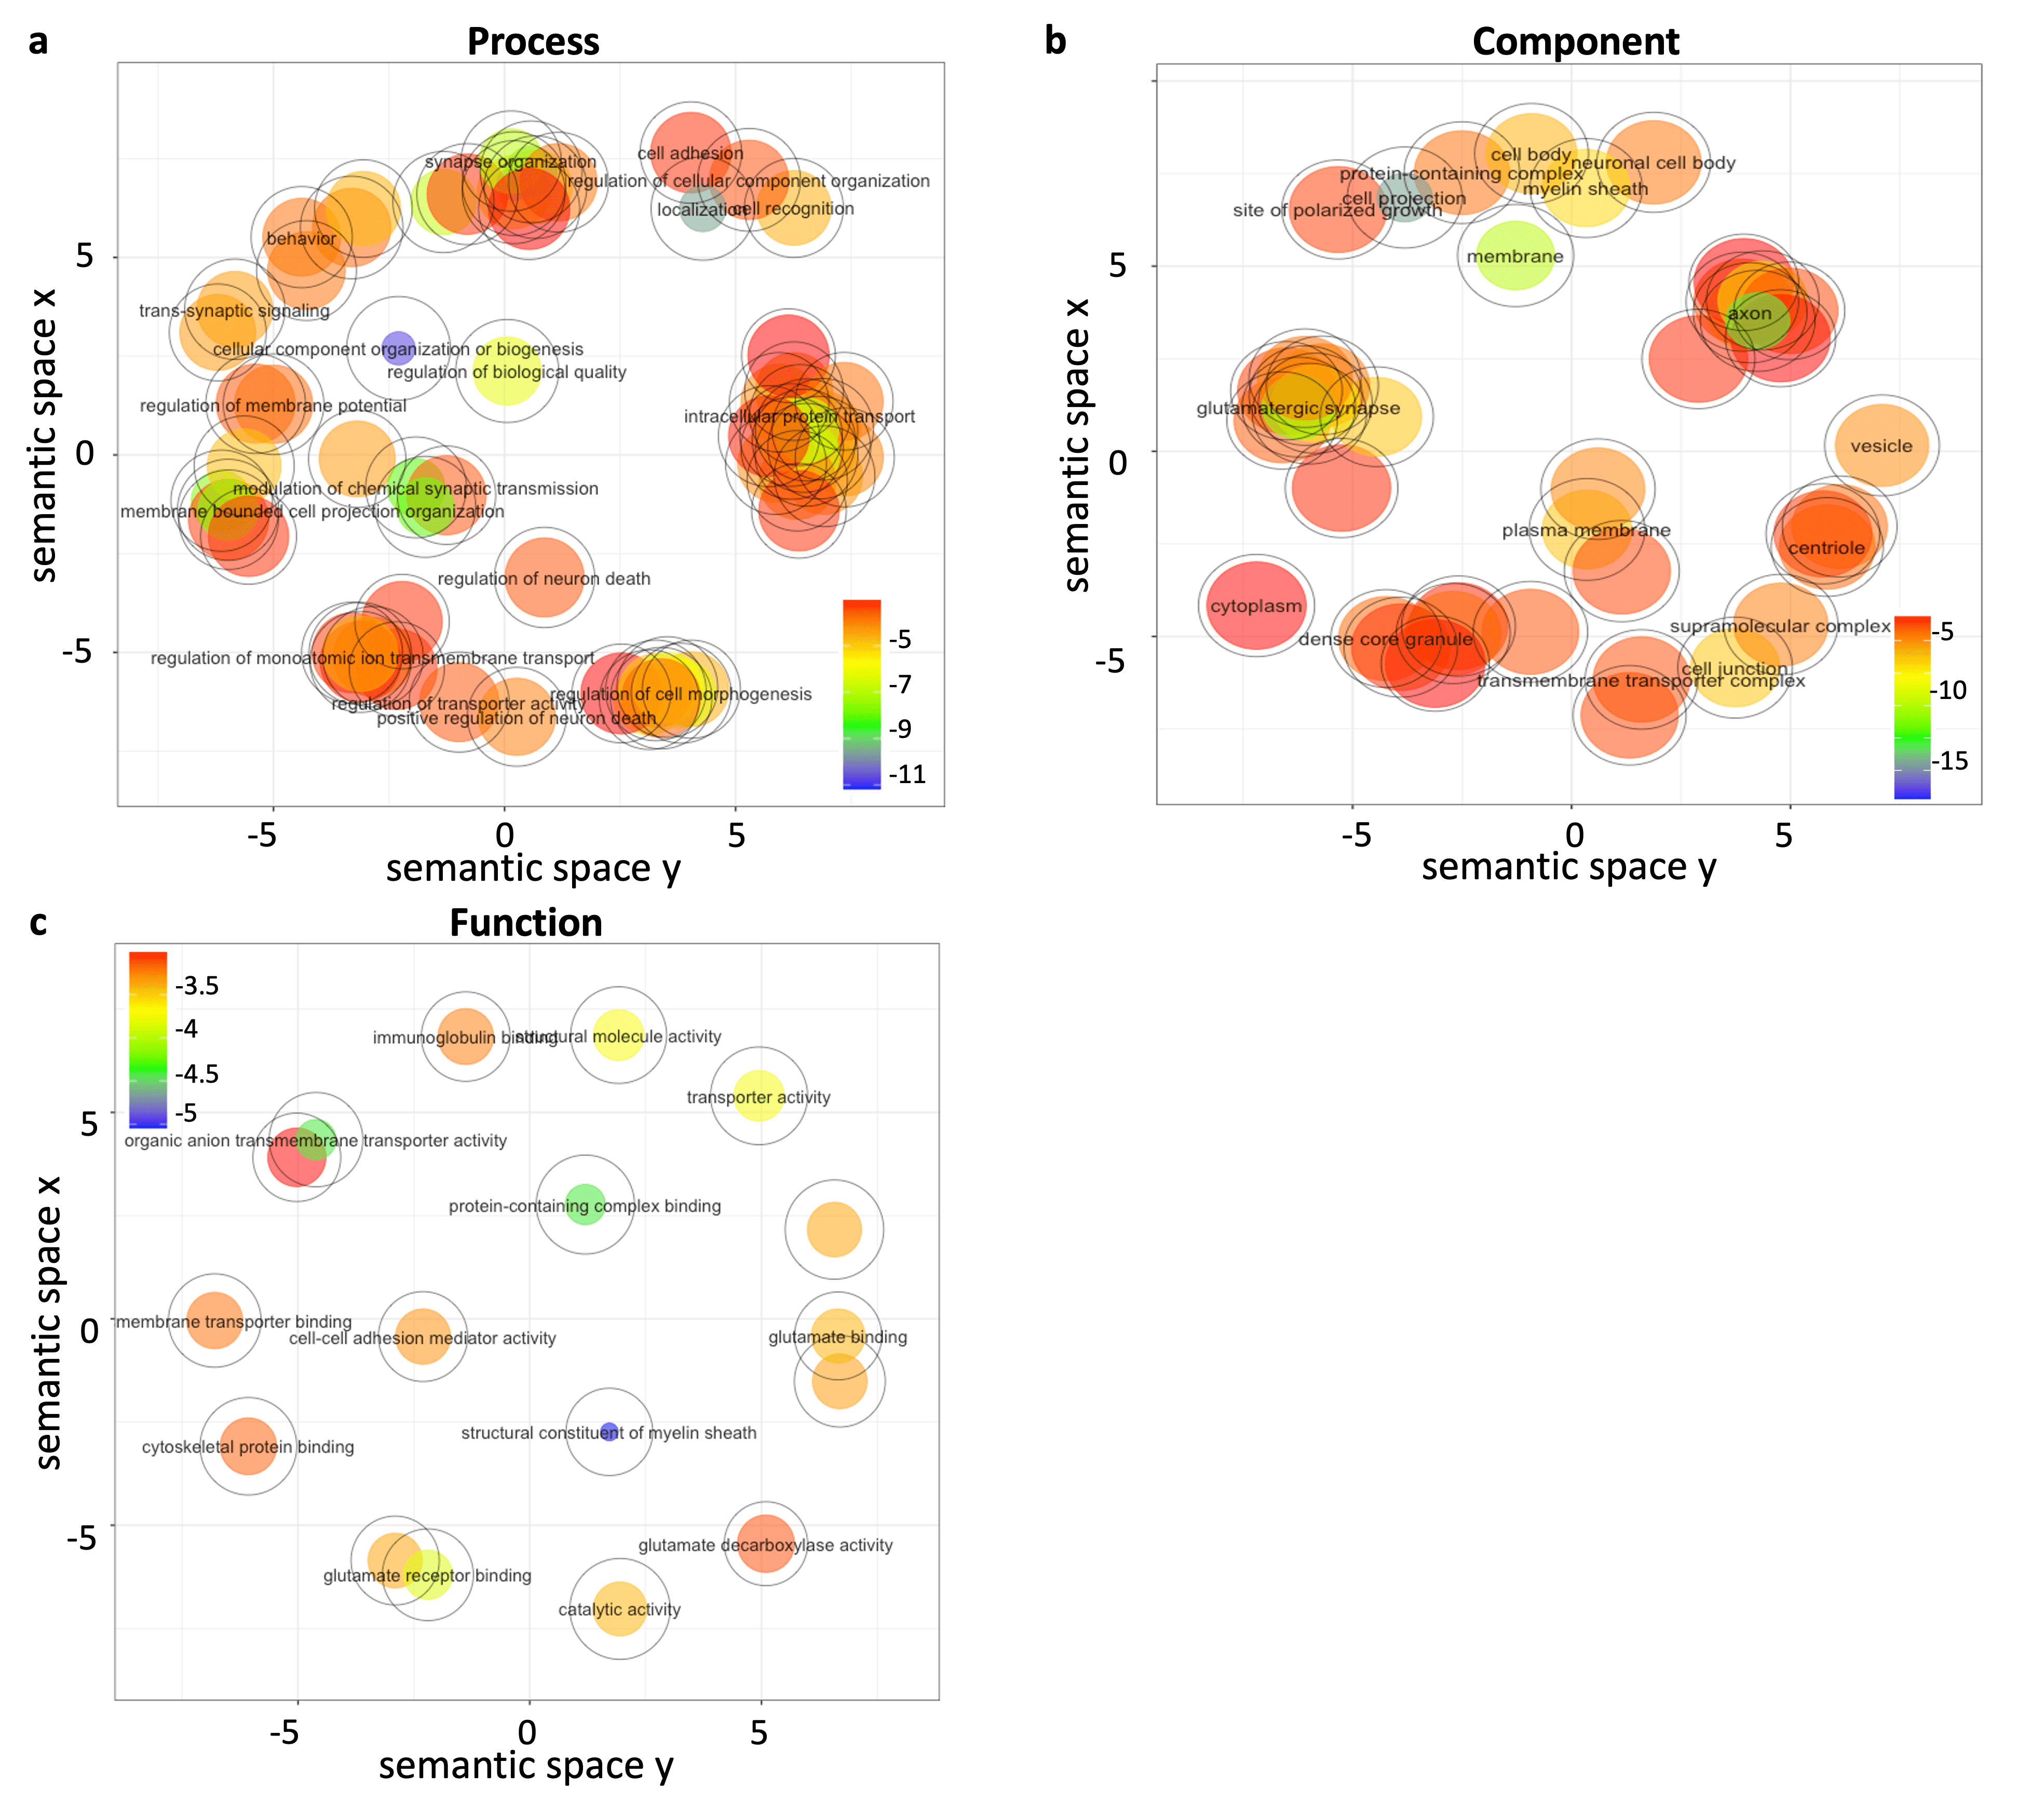
Figure 5. Gene ontology enrichment analysis results. 2002 genes-of-interest were ranked by variance importance in projection scores and input into GO enrichment analysis. GO aspects include biological process (a), cellular component (b), and molecular function (c). Semantically similar GO terms remain close together in the plot. Markers are scaled and colored according to the log10 of p-values of each term.