3472
Evaluating cortical soma radius and intra-soma and neurite fractions using ultra-high-gradient diffusion MRI data acquired at 500 mT/m1Department of Radiology, Athinoula A. Martinos Center for Biomedical Imaging, Charlestown, MA, United States, 2Department of Neurology, Massachusetts General Hospital, Boston, MA, United States, 3MS Center Amsterdam, Anatomy and Neurosciences, Amsterdam Neuroscience, Amsterdam UMC location VUmc, Amsterdam, Netherlands, 4Institute of Medical Physics and Radiation Protection, Mittelhessen University of Applied Sciences, Giessen, Germany, 5Department of Diagnostic and Interventional Radiology, University Hospital Marburg, Philipps University of Marburg, Marburg, Germany
Synopsis
Keywords: Gray Matter, Diffusion/other diffusion imaging techniques, Gray matter, High-performance gradient system
Motivation: The Connectome 2.0 MRI scanner equipped with 500 mT/m gradient strength and 600 T/m/s slew rate is expected to advance gray matter microstructural characterization within the living human brain.
Goal(s): To compare Soma And Neurite Density imaging (SANDI) metrics obtained from Connectome 2.0 and 1.0.
Approach: We applied SANDI model fitting to diffusion MRI data acquired from 10 healthy subjects scanned on the Connectome 2.0 and 1.0 scanners.
Results: We observed lower soma radius throughout the cortex on Connectome 2.0 compared to Connectome 1.0. SANDI metrics from Connectome 2.0 exhibited considerable contrast within the sensorimotor cortex that wasn’t apparent on Connectome 1.0.
Impact: The Connectome 2.0 MRI scanner with 500 mT/m gradients advances non-invasive characterization of gray matter microstructure in the living human brain and enables mapping of real differences in cyto- and myeloarchitecture with greater sensitivity compared to the original Connectome scanner.
Introduction
Dedicated high-performance gradient systems offer many advantages for diffusion MRI over conventional clinical MRI scanners equipped with lower gradient strengths, including more efficient diffusion encoding and greater sensitivity toward cellular and axonal microstructural features at fine diffusion length scales. The original Connectome MRI scanner (Connectome 1.0) made significant strides toward mapping connectional anatomy and microstructural imaging in the living human brain, yet only accessed a portion of the full range of scales necessary for investigating the brain’s microscopic and mesoscopic structure. The recently installed Connectome 2.0 scanner is a cutting-edge MRI scanner, featuring a maximum gradient strength of 500 mT/m and slew rate of 600 T/m/s,1 and offers a unique tool for evaluating gray matter microstructure in the living human brain. Soma and Neurite Density Imaging (SANDI) is a novel biophysical model estimating the contribution of soma radius, soma fraction, and neurite fraction to diffusion MRI signal.2 In this study, we performed an initial comparative study of SANDI metrics in the brain obtained from the Connectome 2.0 and Connectome 1.0 scanners in healthy individuals.Methods
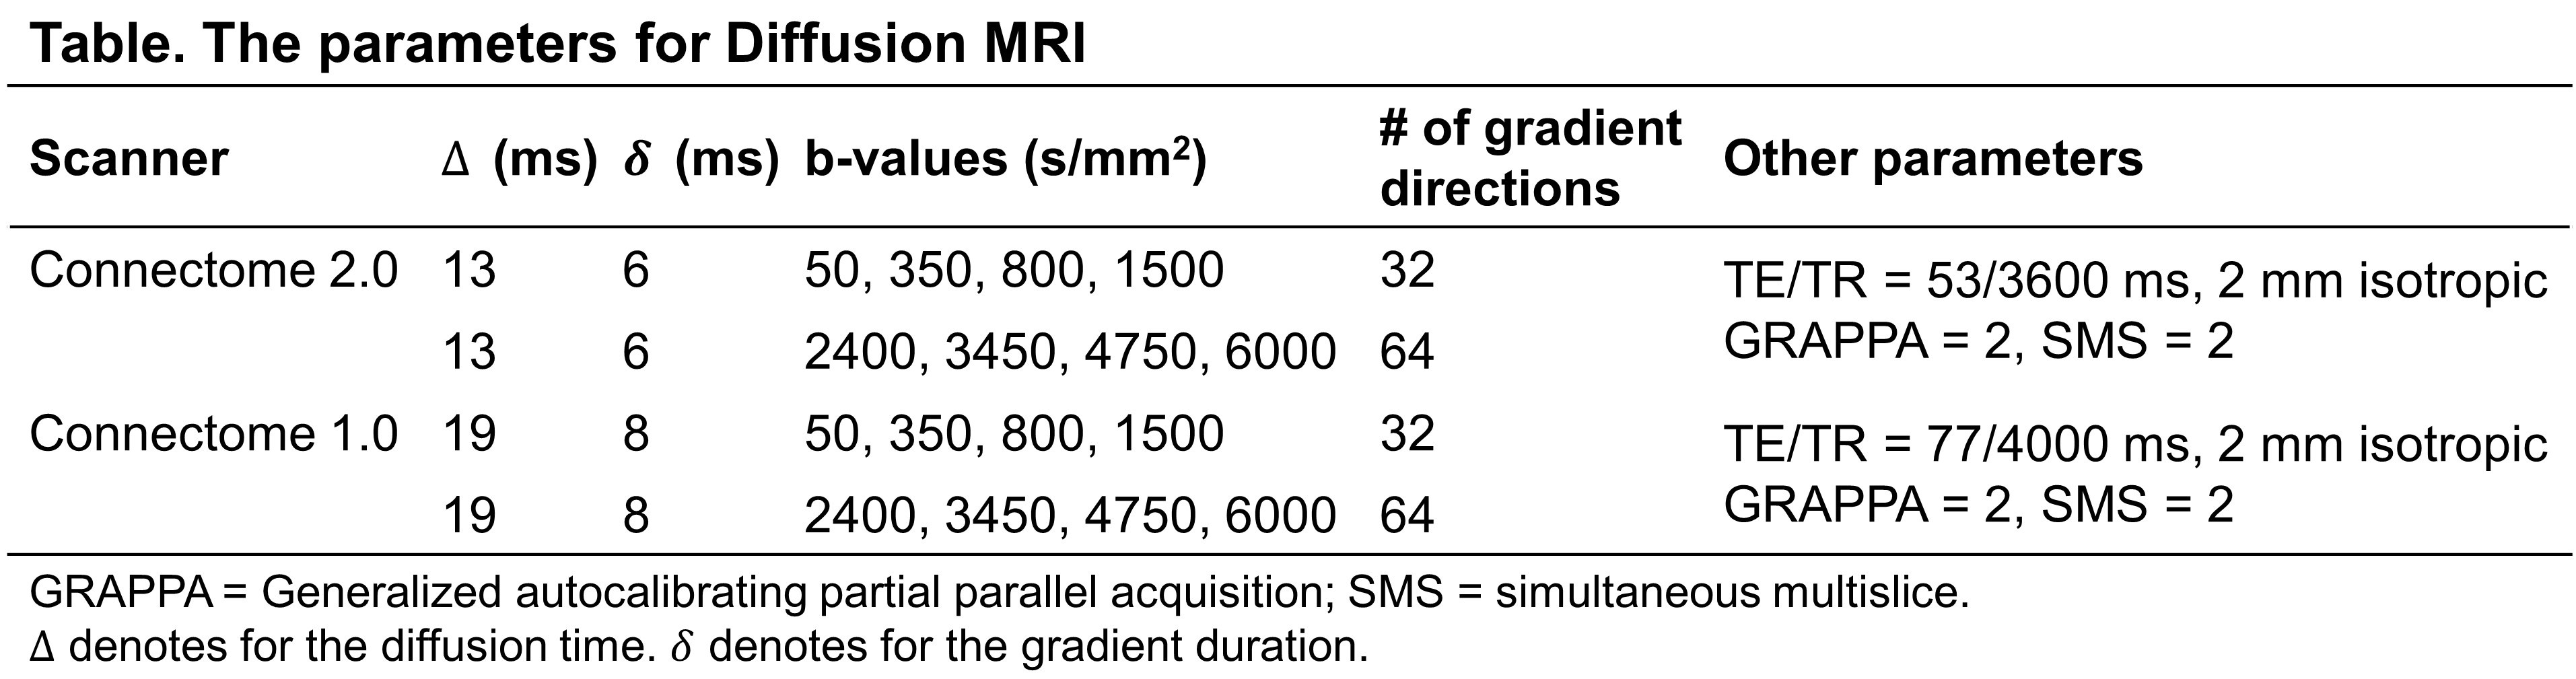
10 healthy adults (34.1±7.2 years, 9 female) were scanned on the 3T Connectome 2.0 MRI scanner (MAGNETOM Connectom.X, Siemens Healthineers, Erlangen, Germany) (Gmax=500 mT/m, SRmax=600 T/m/s) using a custom-built 72-channel in vivo head coil.3 10 age- and sex-matched healthy adults (34.5±6.6 years, 9 female) were scanned on the 3T Connectome MRI scanner (MAGNETOM Connectom, Siemens Healthcare) (Gmax=300 mT/m, SRmax=200 T/m/s). Diffusion-weighted images were obtained using a pulsed gradient spin-echo echo-planar-imaging sequence on each scanner using the minimum accessible diffusion time (Δ=13 ms on C2.0 and Δ=19 ms on C1.0) and 8 b-values linearly spaced in gradient strength up to Gmax (see parameters listed in Figure 1). 3D T1-magnetization-repared rapid acquisition with gradient echo (MEMPRAGE) was acquired for cortical surface reconstruction and segmentation using Freesurfer4 and co-registered to diffusion MRI space.Diffusion MRI data were preprocessed to correct for susceptibility and eddy current-induced artifacts.5 The SANDI model was fitted to the diffusion MRI data using the SANDI MATLAB toolbox.6 The resulting parametric maps of soma radius and signal fractions of intra-soma and intra-neurite spaces were projected onto the Freesurfer-averaged inflated cortical surface and averaged across the 10 subjects scanned on each scanner. A comparison between SANDI metrics from the Connectome 2.0 and Connectome 1.0 scanners was performed using the Mann-Whitney U test.
Results
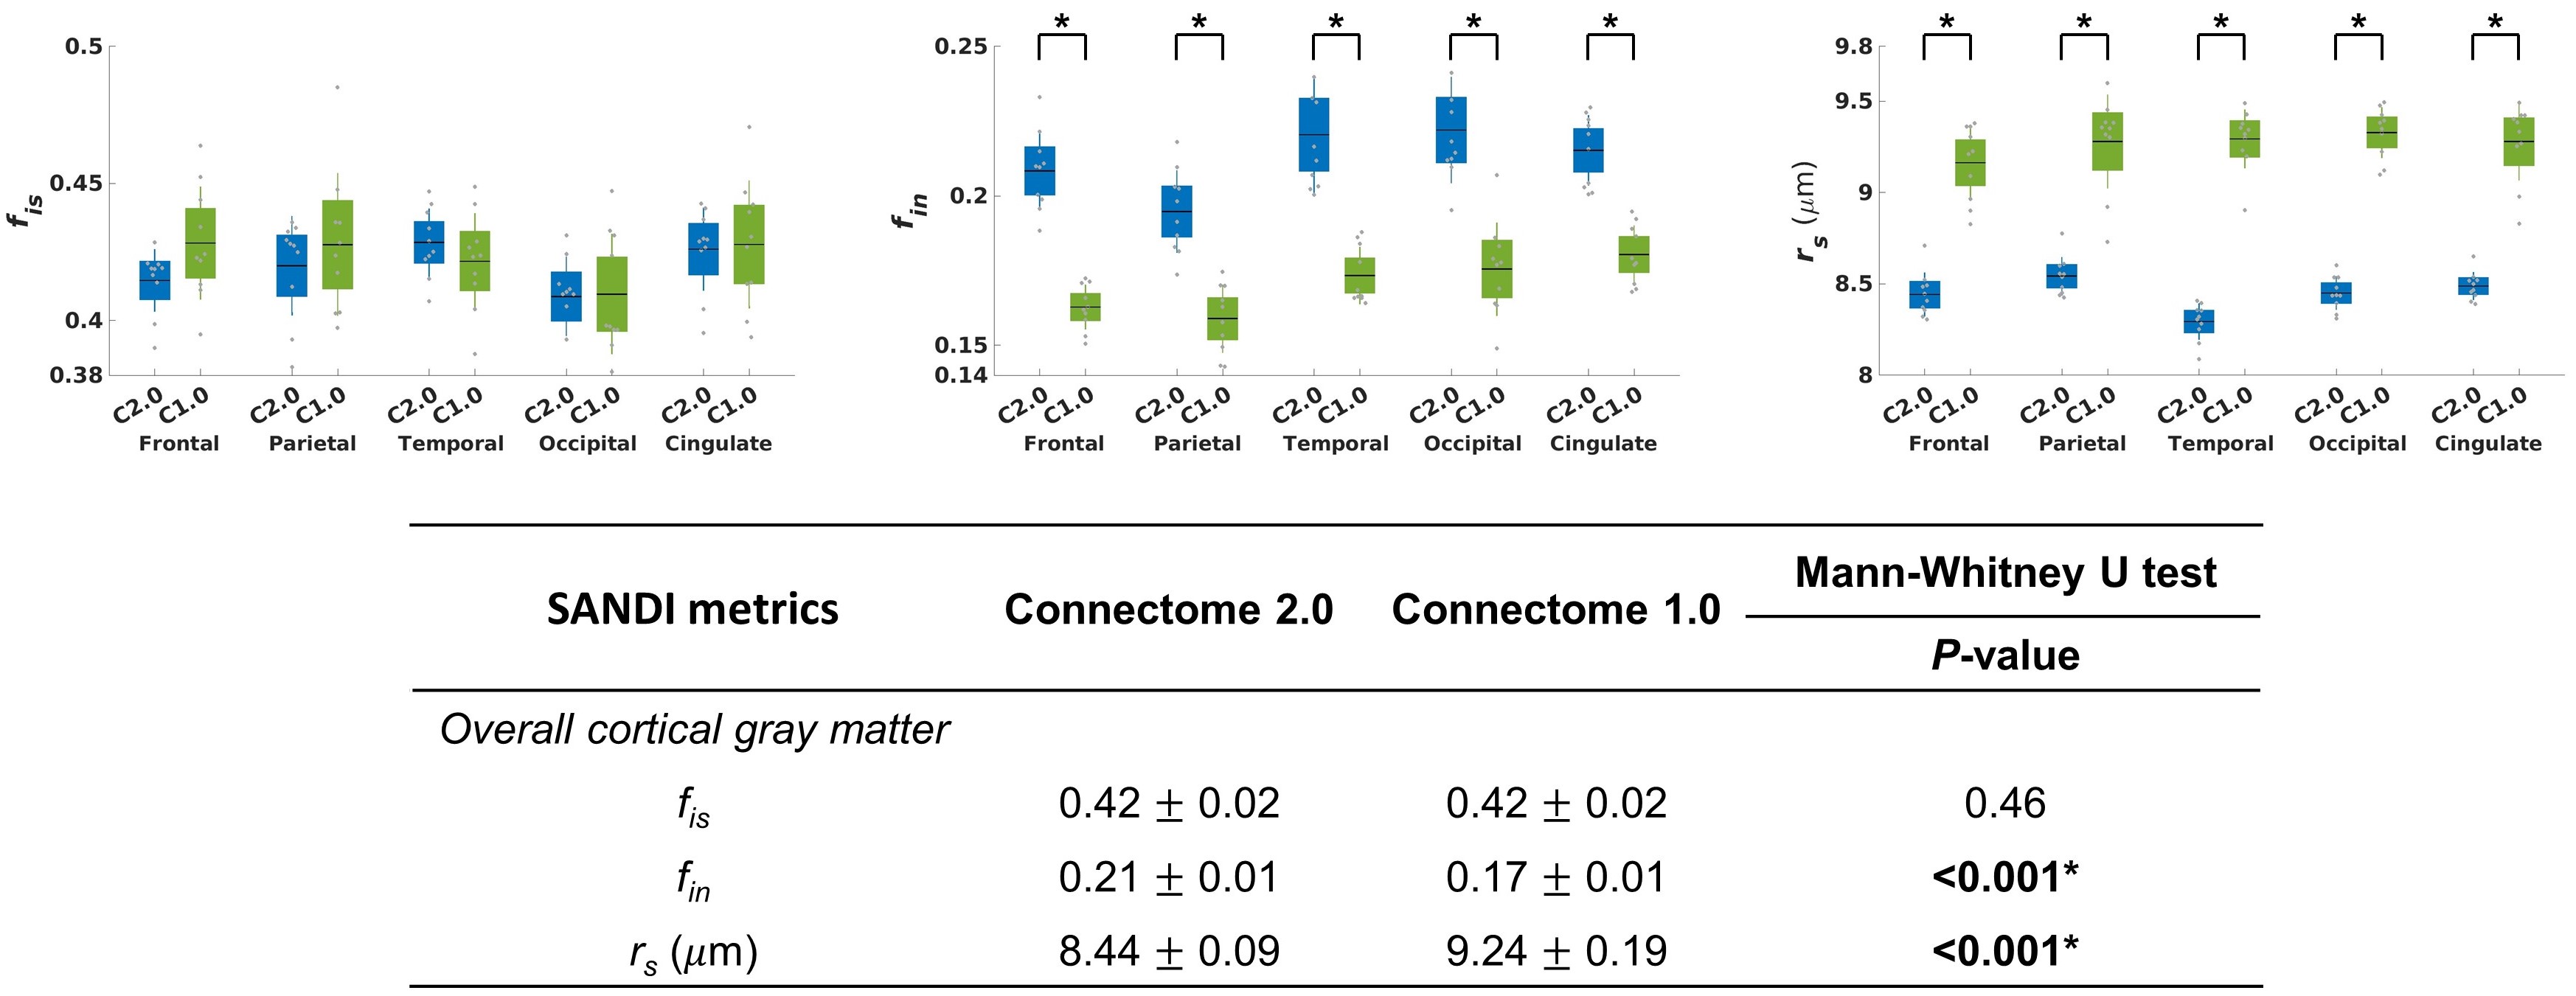
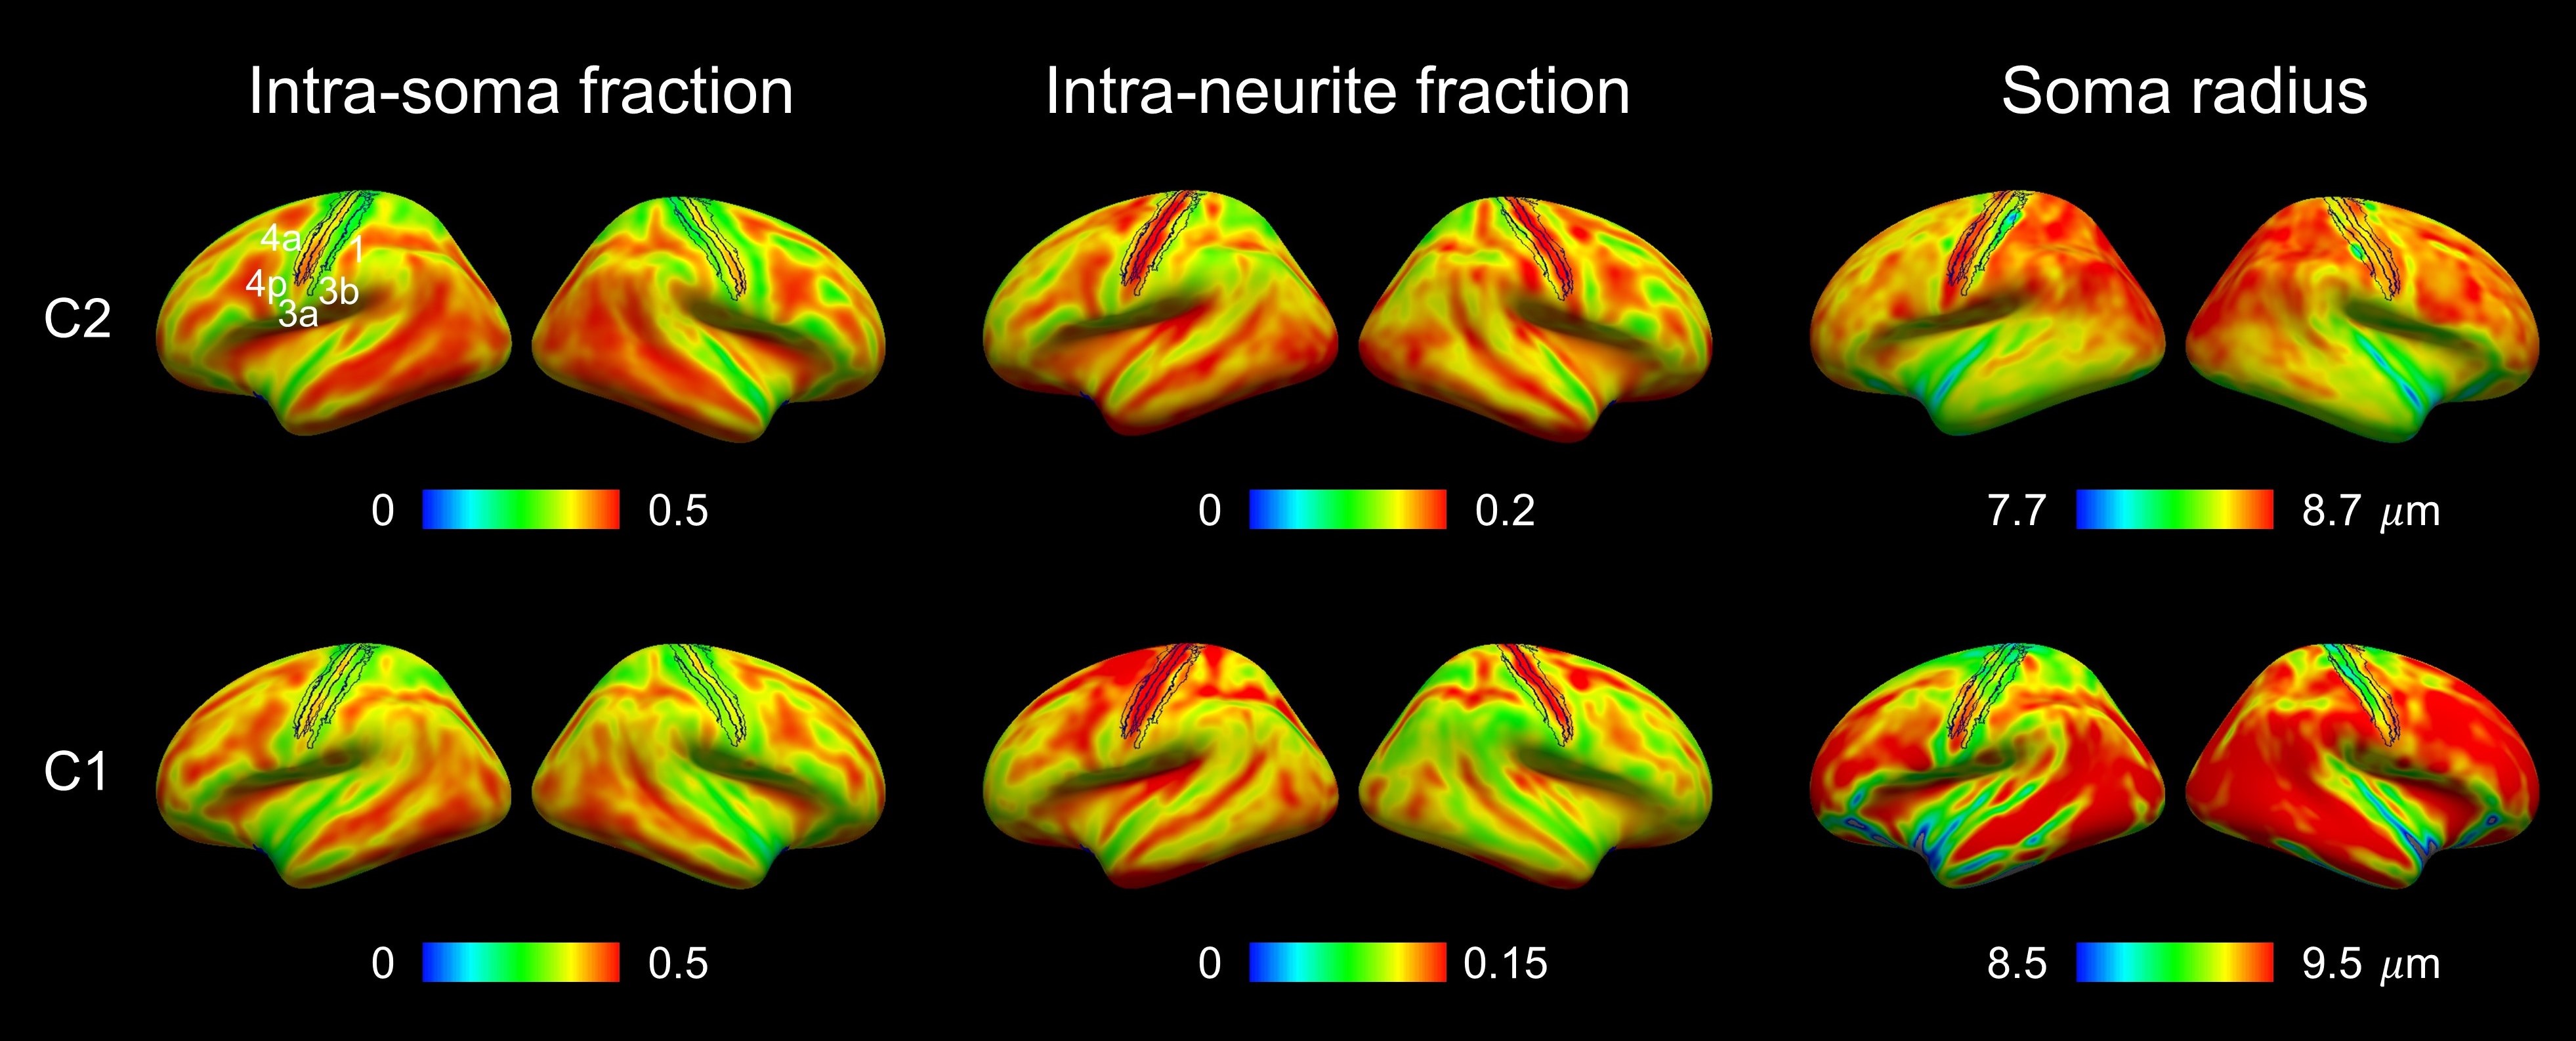
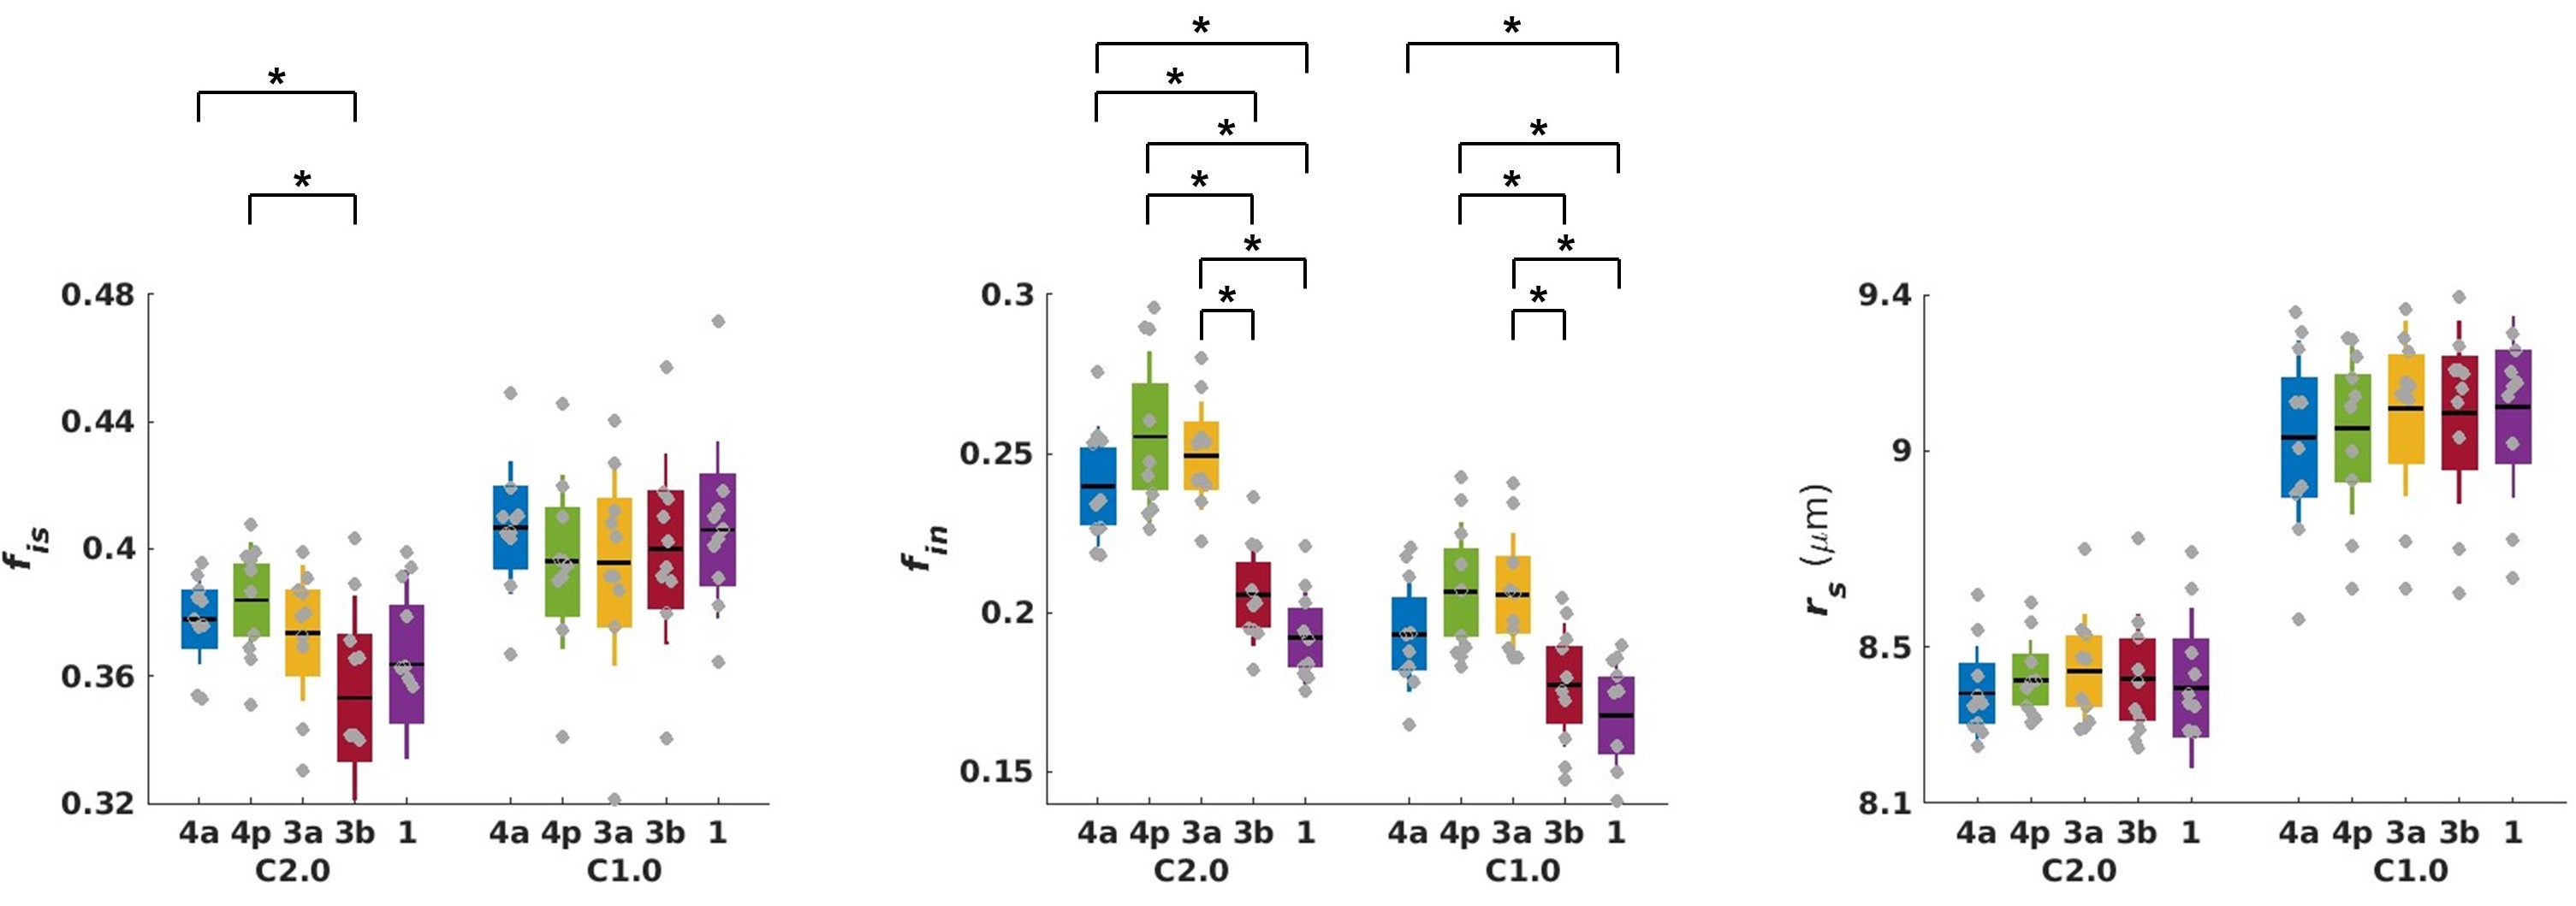
SANDI maps calculated from Connectome 2.0 data showed higher values for intra-neurite signal fraction and lower estimated soma radius across all cortical gray matter areas compared to Connectome 1.0 (P-values < 0.001) (Figure 2). Averaged soma radius, intra-soma and intra-neurite signal fraction maps from the SANDI model are presented on the inflated cortical surface in Figure 3, labeled with sensorimotor cortex encompassing primary motor cortex (Brodmann’s areas 4 anterior (4a) and 4 posterior (4p)) and somatosensory cortex (Brodmann’s areas 3a, 3b, and 1). Sensorimotor cortex showed apparent differences in contrast between Connectome 2.0 and Connectome 1.0. Specifically, a higher intra-soma signal fraction was observed in primary motor cortex (4a and 4p) compared to area 3b of somatosensory cortex in the Connectome 2.0 data (Figure 4). This pattern was not observed in the Connectome 1.0 data. The intra-neurite signal fraction in primary motor cortex (4a and 4p) was also higher than in somatosensory cortex (3b and 1) in both datasets, which is consistent with observations from histology.7Discussions & Conclusion
In this study, we performed SANDI model-fitting on diffusion MRI data acquired on the Connectome 2.0 and Connectome 1.0 scanners and examined differences in cortical gray matter microstructure in the primary motor and somatosensory cortex. The estimated soma radius in the Connectome 2.0 data was lower than that in the Connectome 1.0 data, in line with the greater sensitivity of higher Gmax to smaller compartment sizes.8 The higher intra-neurite signal fractions observed in the Connectome 2.0 data may be attributed to the shorter diffusion times accessible on the Connectome 2.0 protocol. Since the SANDI model does not account for the inter-compartmental water exchange,2 using shorter diffusion times mitigates the effect of water exchange on the estimated signal fractions. Moreover, the SANDI maps on Connectome 2.0 show considerable contrast in intra-soma and intra-neurite signal fractions within the primary motor and somatosensory cortex. The Connectome 2.0 scanner features the world’s highest maximum gradient strength and slew rate for in vivo human scans, enabling access to shorter diffusion times, gradient pulse durations, and echo times. We envision these enhanced capabilities will increase our sensitivity to inter-subject differences in gray matter microstructure, as exemplified through these early results on gray matter microstructural mapping.Acknowledgements
This work was supported by the National Institute of Biomedical Imaging and Bioengineering of the National Institutes of Health under award numbers U01EB026996 and P41EB030006 and by the Office of the Director and the National Institute of Dental & Craniofacial Research of the National Institutes of Health under award number DP5OD031854.References
1. Huang SY, Witzel T, Keil B, et al. Connectome 2.0: Developing the next-generation ultra-high gradient strength human MRI scanner for bridging studies of the micro-, meso-and macro-connectome. 2021;243:118530.
2. Palombo M, Ianus A, Guerreri M, et al. SANDI: a compartment-based model for non-invasive apparent soma and neurite imaging by diffusion MRI. NeuroImage. 2020;215:116835.
3. Mahmutovic M, Shrestha M, Ramos-Llordén G, et al. A 72-channel Head Coil with an Integrated 16-Channel Field Camera for the Connectome 2.0 Scanner. Submitted to ISMRM 2024.
4. Dale AM, Fischl B, Sereno MI. Cortical surface-based analysis: I. Segmentation and surface reconstruction. Neuroimage. 1999;9(2):179-194.
5. Tian Q, Fan Q, Witzel T, et al. Comprehensive diffusion MRI dataset for in vivo human brain microstructure mapping using 300 mT/m gradients. Scientific Data. 2022;9(1),7.
6. https://github.com/palombom/SANDI-Matlab-Toolbox
7. Geyer S, Schleicher A, Zilles K. Areas 3a, 3b, and 1 of human primary somatosensory cortex: 1. Microstructural organization and interindividual variability. Neuroimage. 1999;10(1):63-83.
8. Afzali M, Nilsson M, Palombo M, et al. SPHERIOUSLY? The challenges of estimating sphere radius non-invasively in the human brain from diffusion MRI. Neuroimage. 2021;237:118183.
Figures