3466
Characterizing Brain Tumor Microstructure with SANDI using 300 mT/m Gradients1MR Research Collaboration Team, Siemens Healthineers Ltd., Shanghai, China, 2Huashan Hospital, Fudan University, Shanghai, China, 3Institute of Science and Technology for Brain-Inspired Intelligence, Fudan University, Shanghai, China
Synopsis
Keywords: Microstructure, Microstructure
Motivation: Precisely locating tumor regions is challenging for effective surgery and radiotherapy.
Goal(s): Enhance tumorous area identification accuracy.
Approach: We integrated SANDI to model both stick and spherical cell types, estimating their densities. We introduced a metric quantifying spherical cell ratio relative to total cell volume for characterizing elevated tumor cell density.
Results: Our model effectively characterizes microstructural variations in brain tumor areas. The newly proposed cell number density ratio parameter provides a distinctive marker, highlighting high cell density within tumors. This approach holds promise for improving tumor localization, treatment planning, and patient outcomes.
Impact: Brain tumor microstructure characterization using SANDI showed microstructure changes in tumors and edema. The introduced metric, sensitive to tumor changes, holds promise for early invasion detection, enhancing diagnostic precision.
Introduction
Accurate delineation of tumorous regions is crucial for the surgical and radiotherapy treatment of glioma patients. Conventional T1 and T2 weighted structural imaging often falls short in accurately differentiating tumorous areas. Diffusion imaging offers a noninvasive means of in-vivo water diffusion measurement within tissue. While the apparent diffusion coefficient (ADC) is sensitive to various microstructural factors1, it lacks the ability to pinpoint the specific causes of decreased diffusivity, making it inadequate for assessing tumor cell density2. Oscillating gradient diffusion methods and neurite orientation dispersion and density imaging (NODDI)3 have shown promise in characterizing high-grade tumors4,5 but are less effective when both tumor cells and neurites are presented in tissues. To address these limitations, we implement cell body and neurite density imaging (SANDI)6, which incorporates spherical cells and neurite density. This study aims to employ SANDI to characterize the microstructure in glioma patients and introduce a novel metric to reflect the relative cell number density between cell bodies and total cell volume. Preliminary results show that this new metric distinguishes elevated cell density in tumor regions.Method
We imaged one healthy volunteer and one glioma patient using a 3T Connectom scanner (Siemens, Erlangen, Germany) with the following imaging parameters: TE/TR=49/3000ms, voxel size=2x2x2mm3, matrix size=96x96x96, d/D = 11/20ms, GRAPPA=2, 30 slices, b=0/500/1000/2000/3000/4000/6000 s/mm2 with 40 directions. Diffusion imaging processing procedures were followed as described elsewhere7. Measurements with b ≤ 3000 s/mm2 were used to calculate mean diffusivity (MD), fractional anisotropy (FA), orientation dispersion (OD), and neurite density (ICVF). All measurements were used to calculate SANDI parameters, including intracellular diffusion coefficient (Din), extracellular diffusion coefficient (De), neurite density (fNeurite), cell body density (fSoma), cell radius (rSoma), and extracellular water (fExtra). To quantify increased cell bodies in tumors, new metrics, such as the cell ratio (fSoma/(fSoma+fNeurite)) and the cell number density ratio (fSoma/(fSoma+fNeurite)/rSoma3), were derived.Results and Discussion
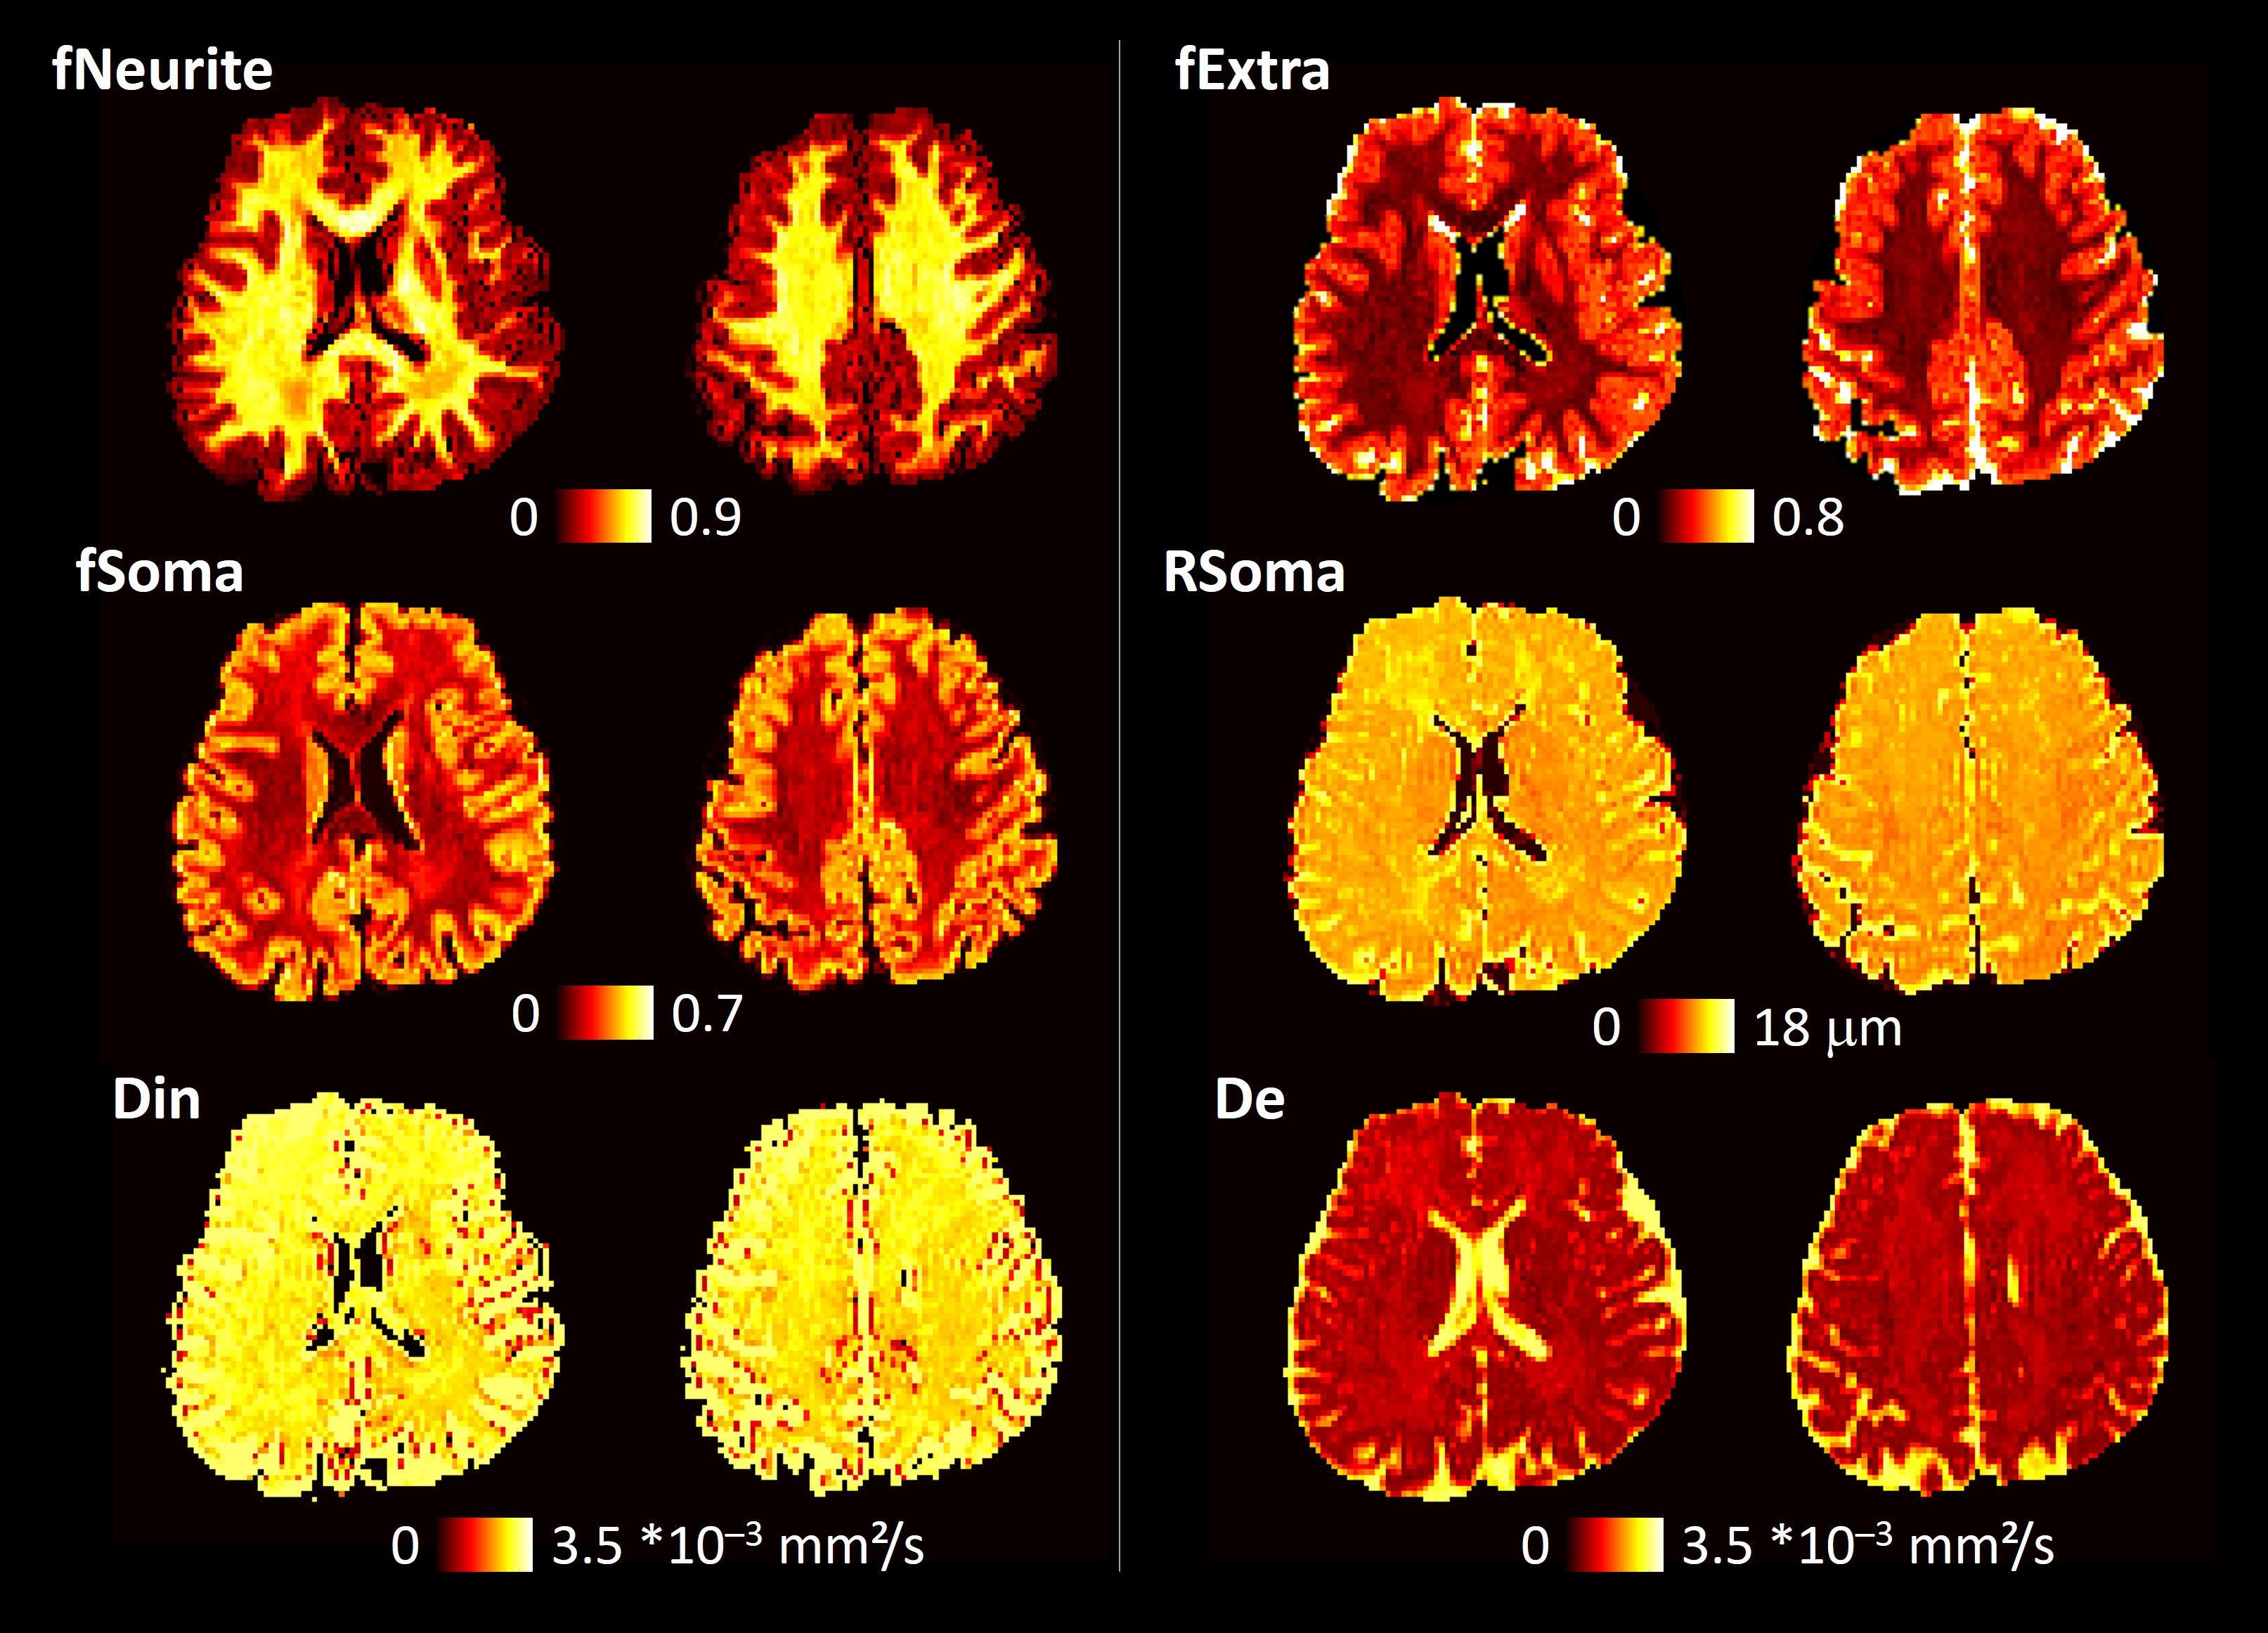
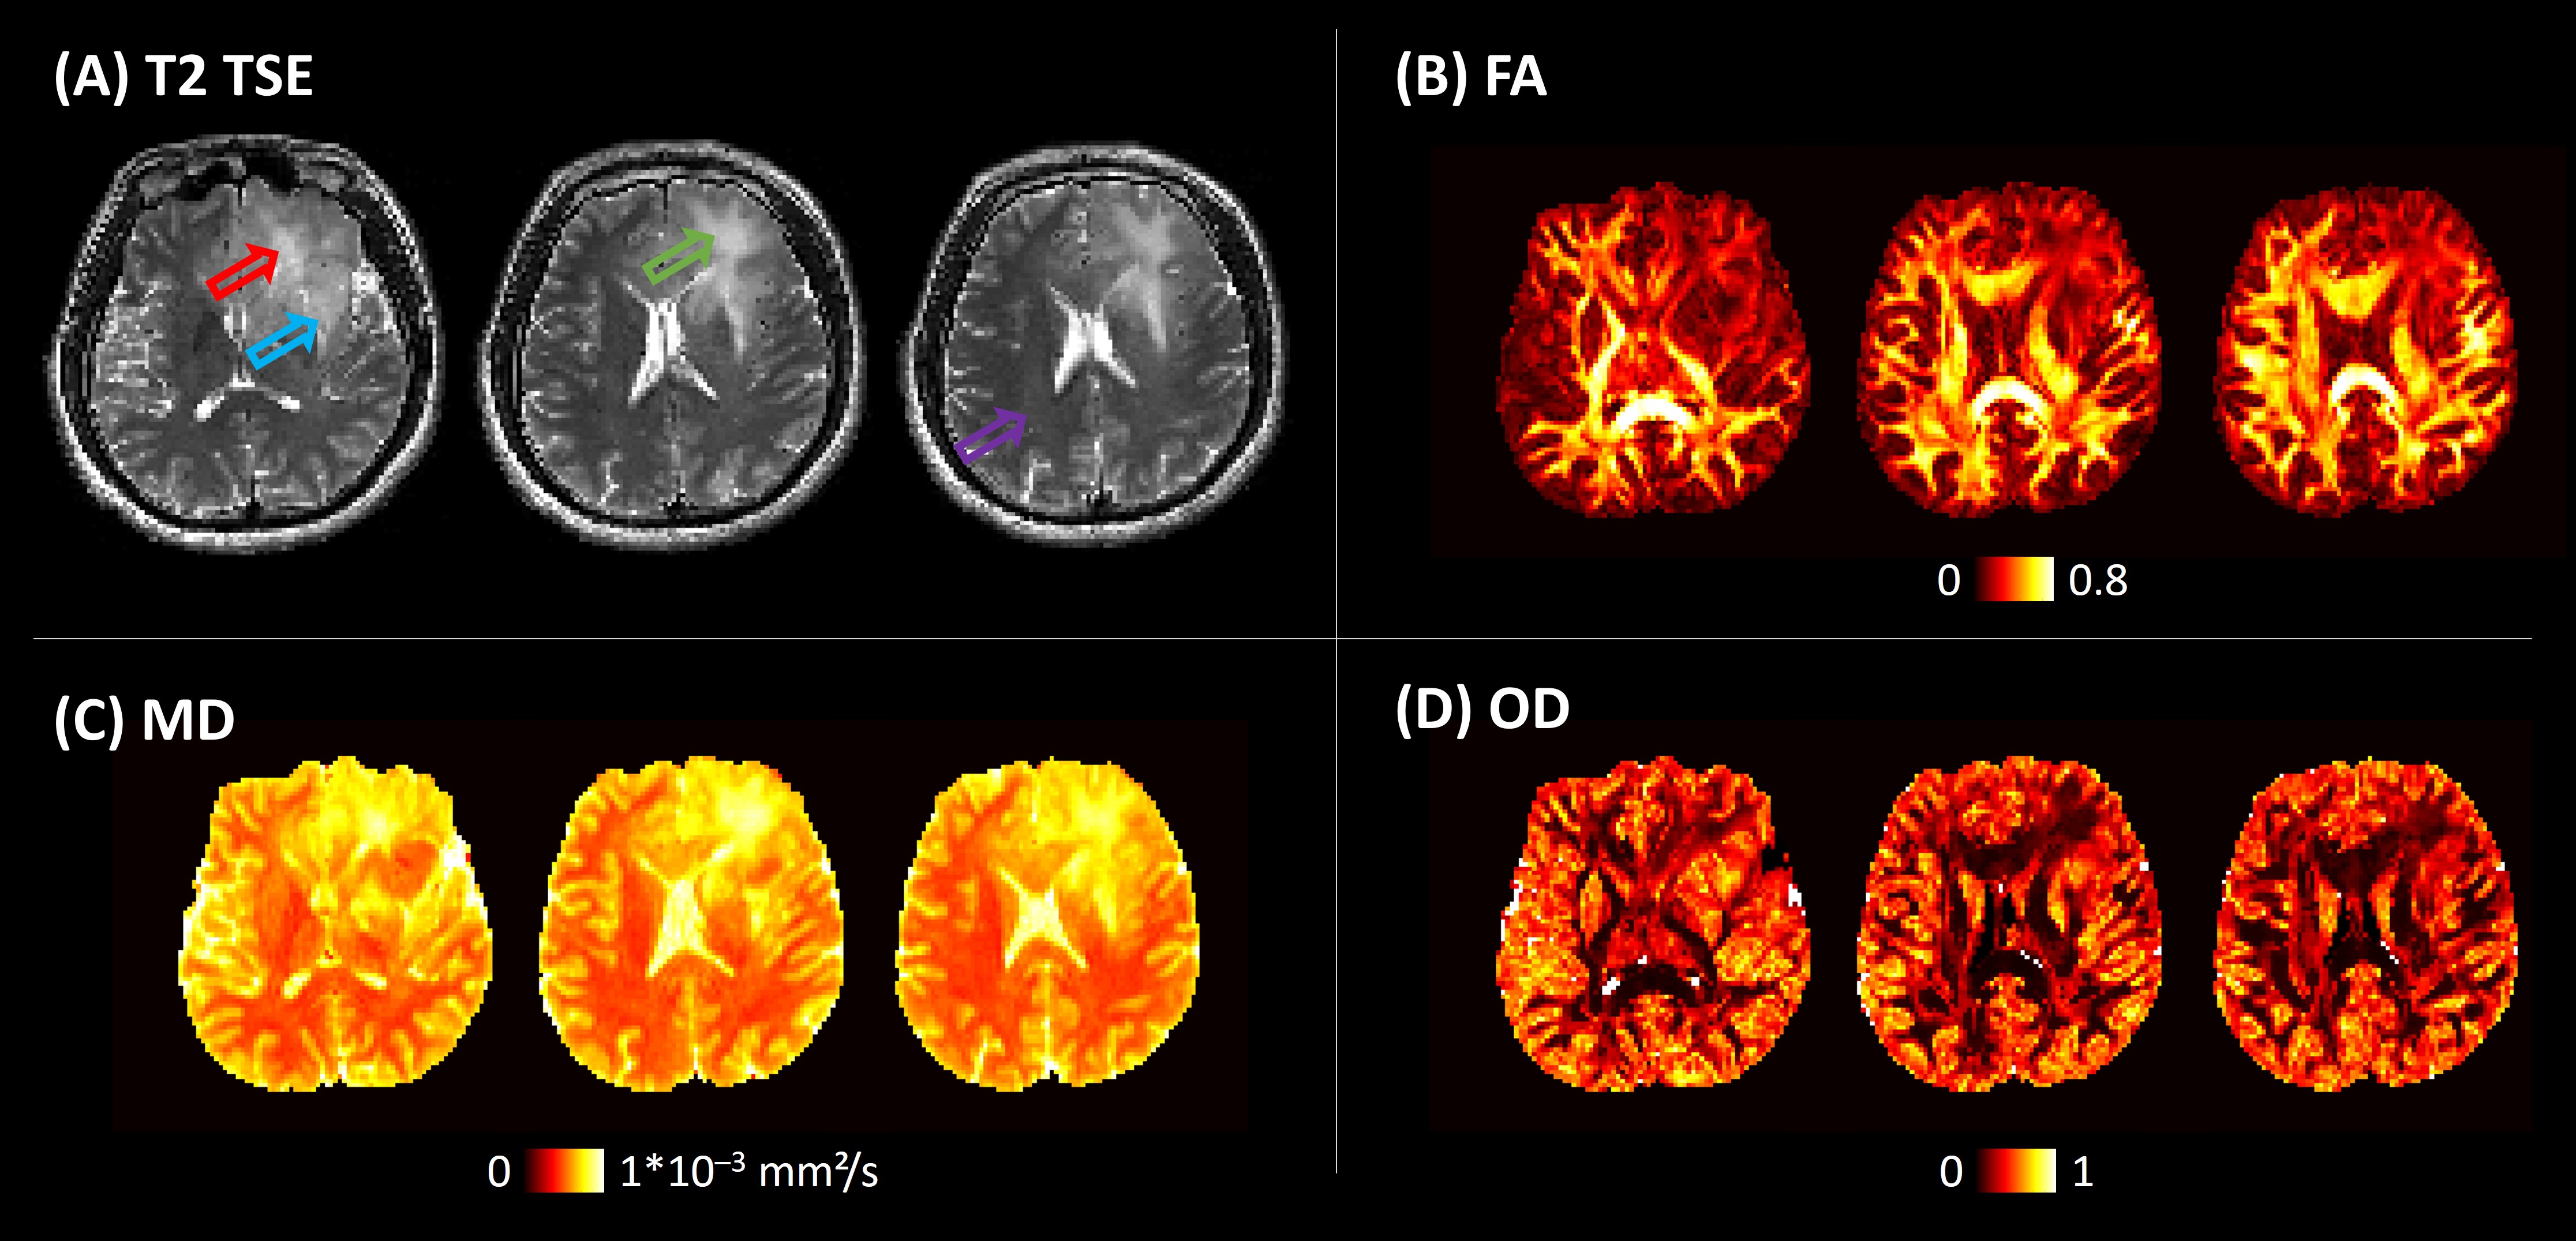
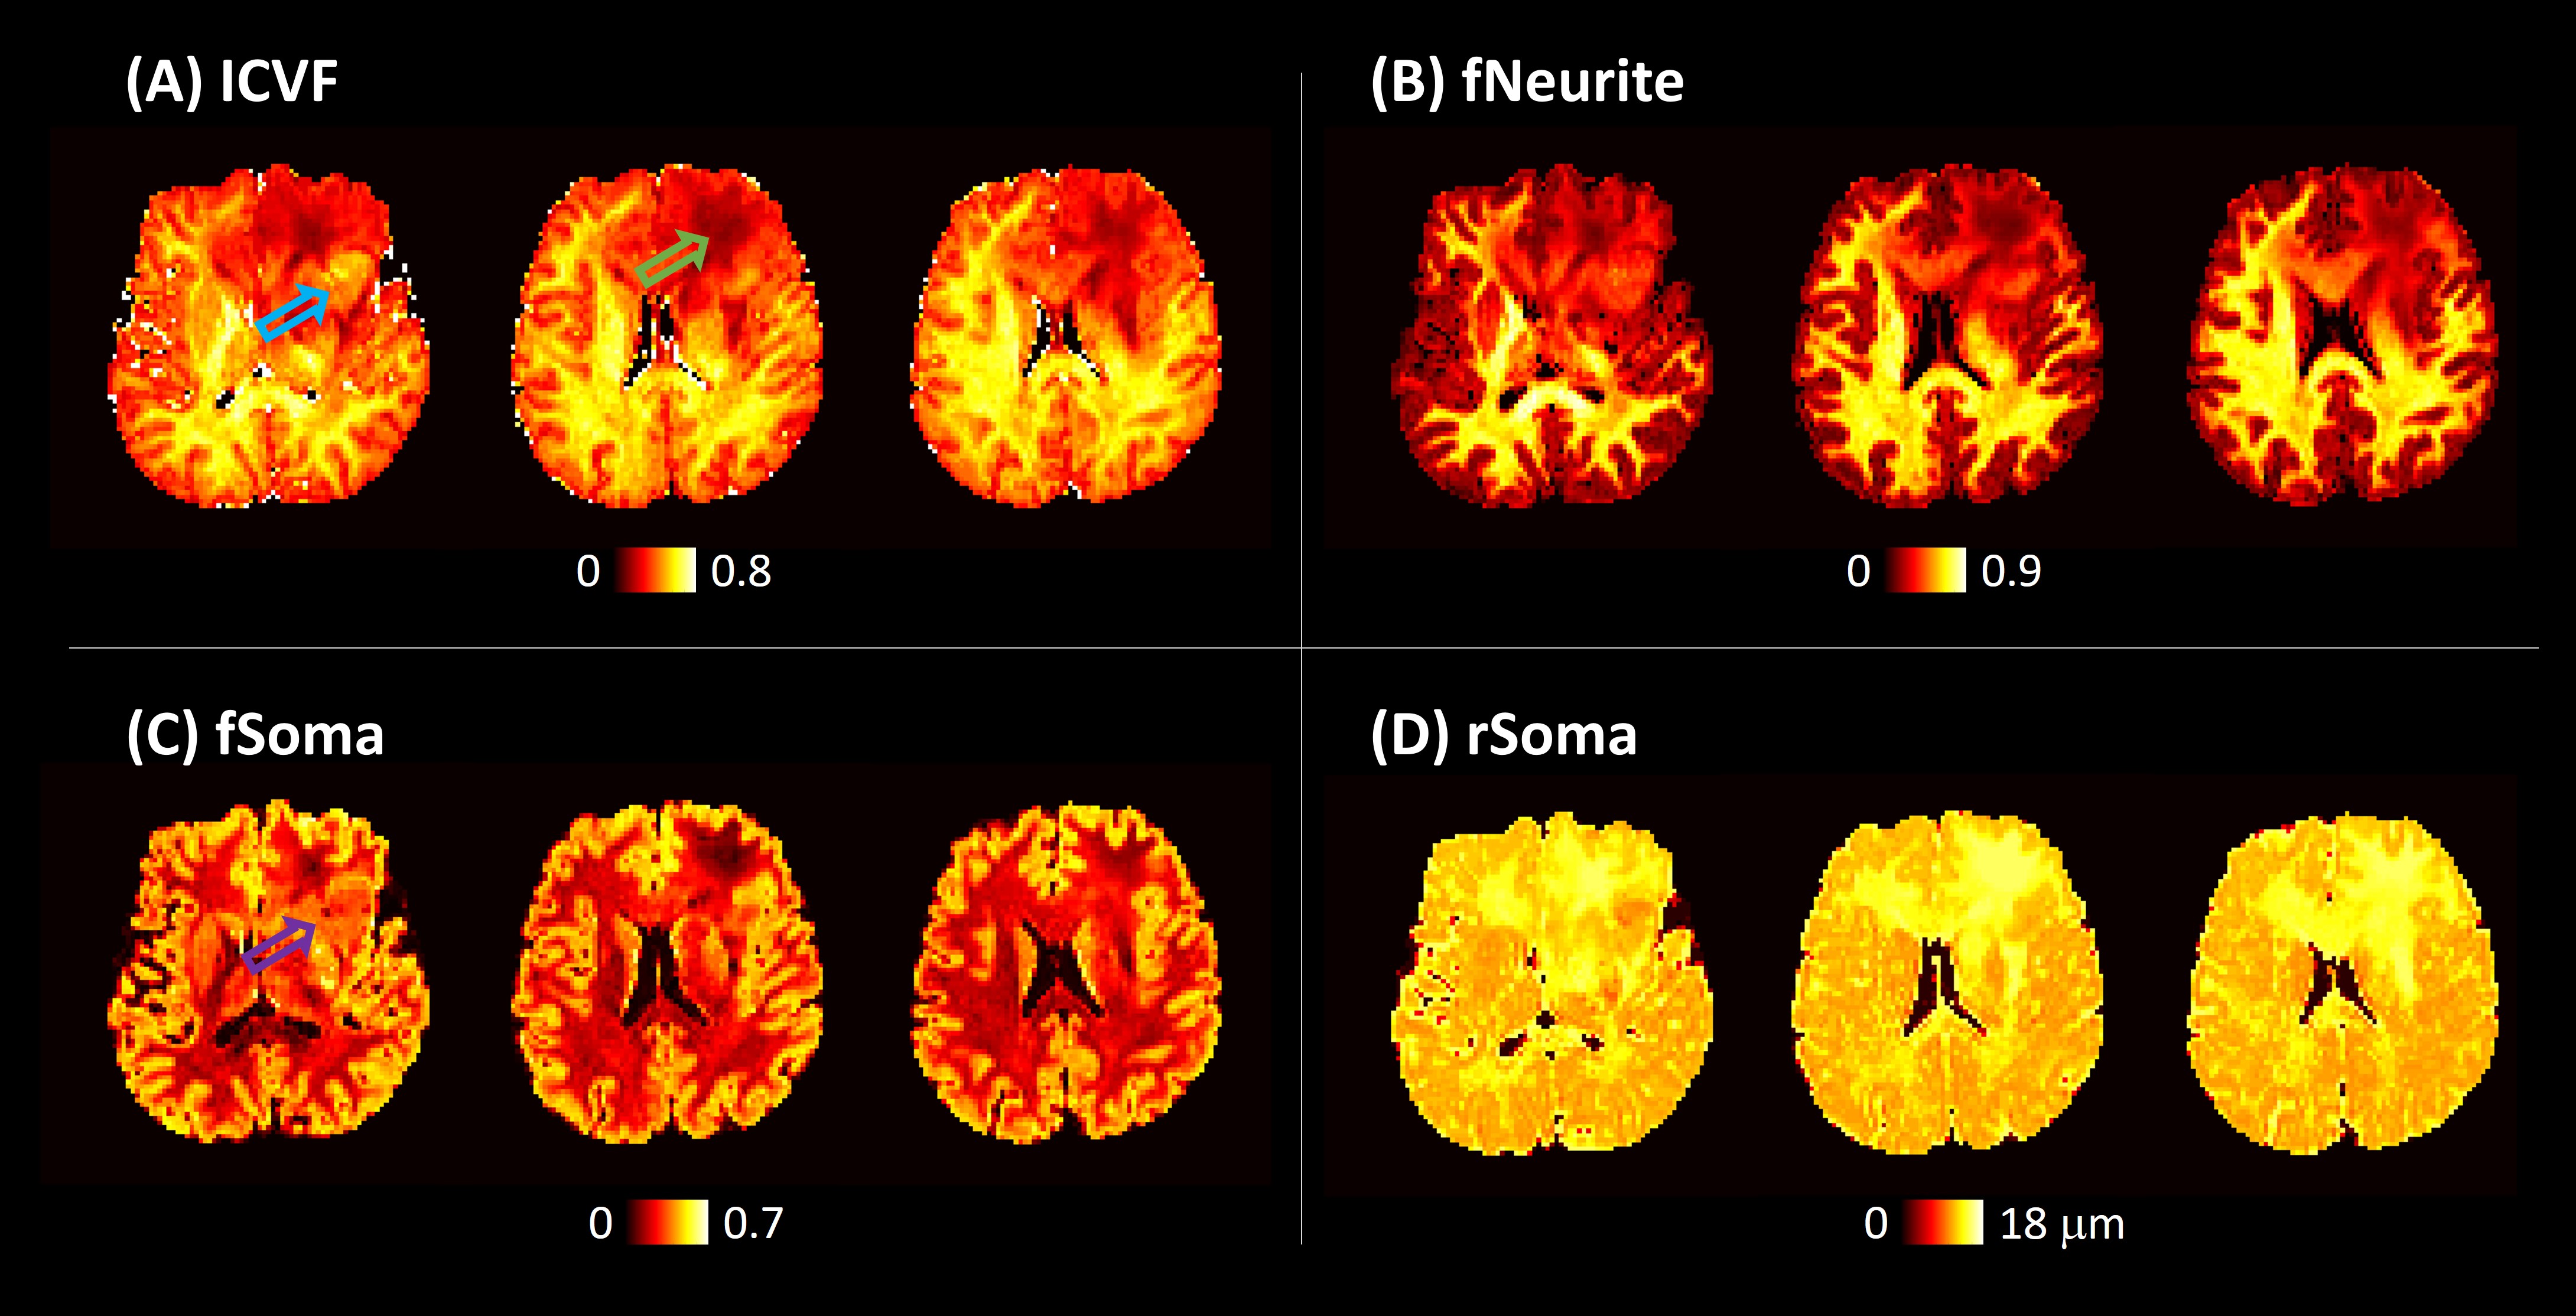
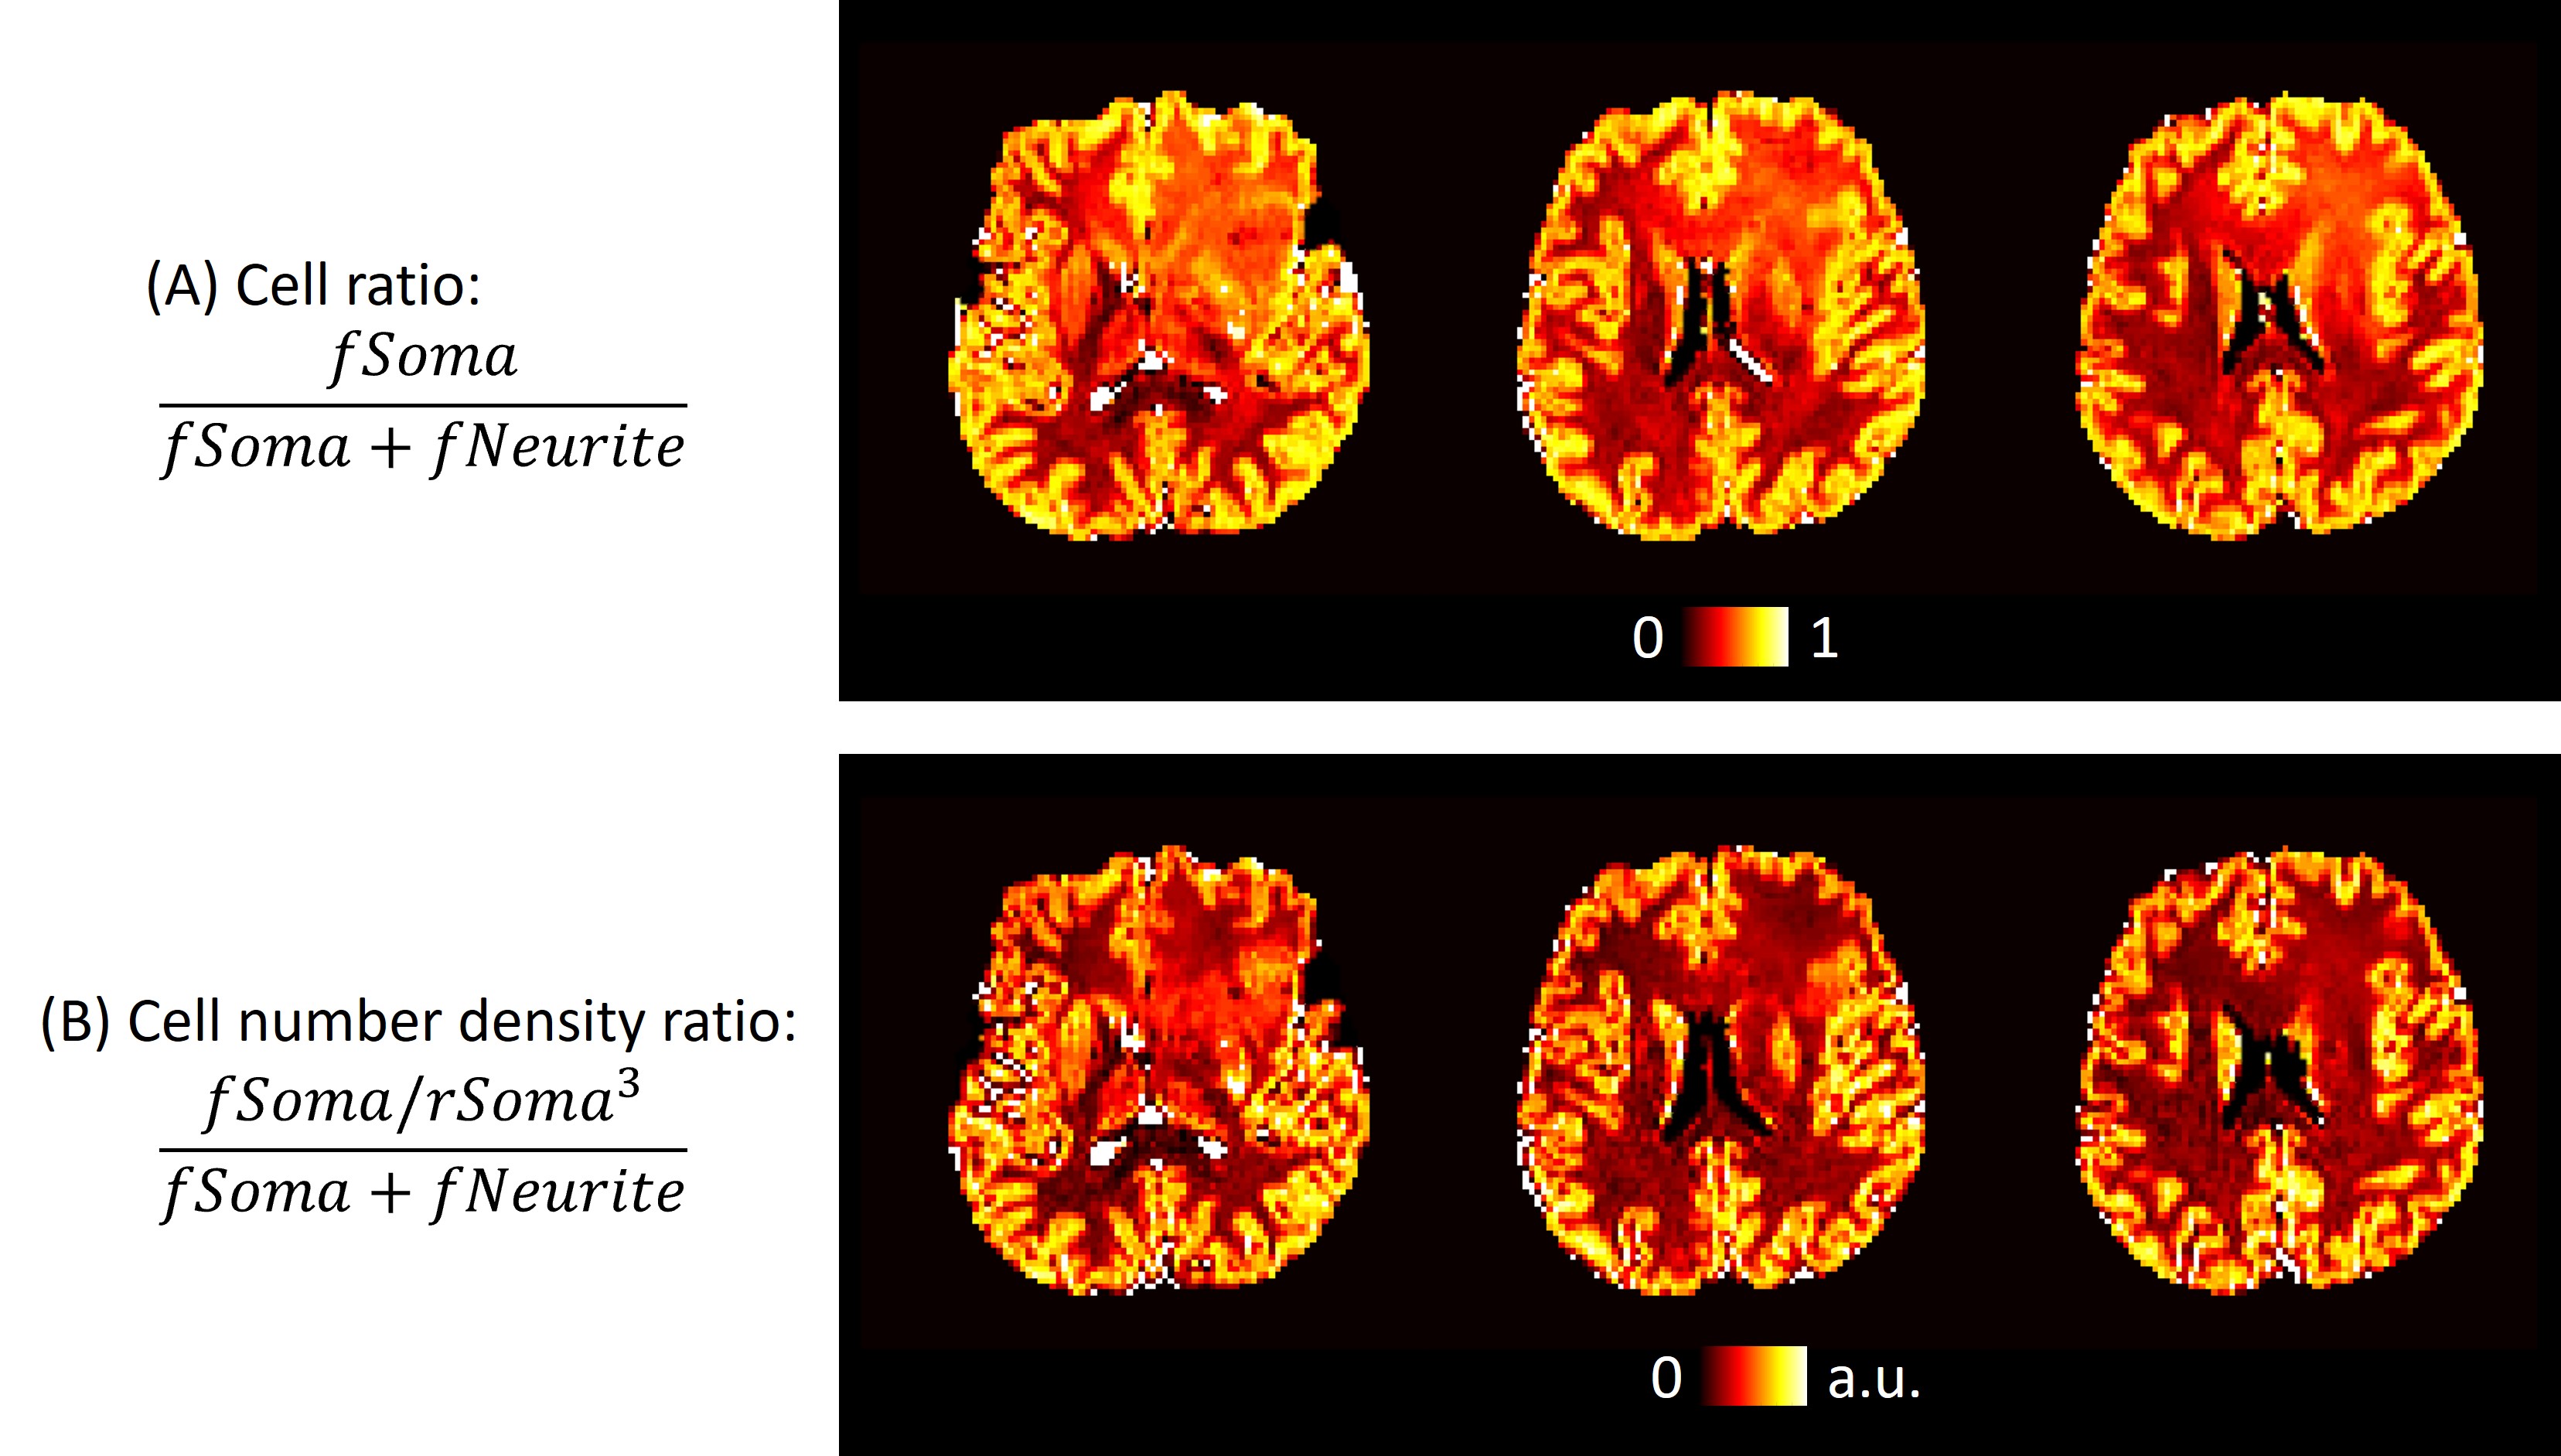
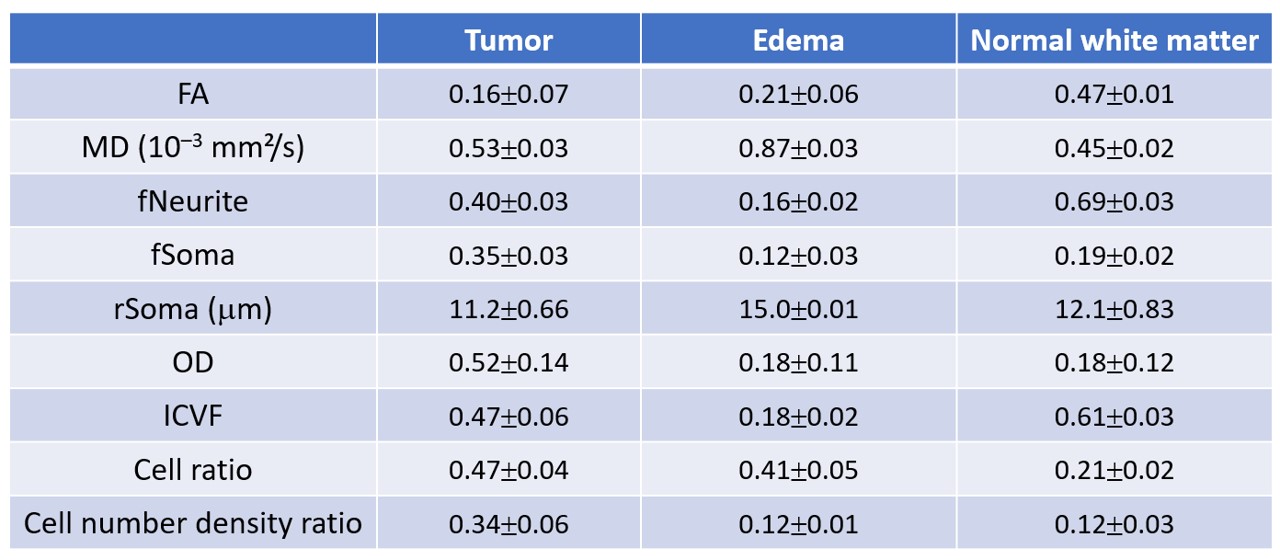
In Figure 1, SANDI analysis of a healthy volunteer revealed distinct microstructure characteristics, with elevated fNeurite values in white matter, high fSoma values in gray matter, and increased fExtra in cerebrospinal fluid. Notably, the rSoma map differed from clinical scanner results7 due to our study's shorter TE and lower acceleration factors, enabling higher SNR measurements. At low SNR, Rician noise manifested as signals at high b-values, leading to misinterpretation as soma components with small radii.In Figures 2A and B, T2 contrast and fractional anisotropy (FA) failed to distinctly differentiate tumoral (blue arrow) and edematous (red arrow) regions, resulting in unclear boundaries. However, Figure 2C revealed lower mean diffusivity (MD) in tumoral areas compared to edematous regions, while Figure 2D depicted higher orientation dispersion (OD) in tumoral regions. Figure 3A displayed neurite fraction estimates from NODDI, showing low neurite fractions in edematous regions (green arrow) and unexpectedly high fractions in tumoral areas (blue arrow). NODDI's shortcomings, such as the lack of spherical cell consideration, led to the misfitting of restricted water in tumor cells as neurite fractions. SANDI, which accounts for both stick and spherical-shaped cells, yielded more accurate neurite fraction estimates. Figure 3B demonstrated lower SANDI-derived neurite fractions in tumors and edematous regions compared to normal white matter. Additionally, cell body fractions exhibited strong signals in tumor regions (purple arrow) in contrast to normal white matter and edema. Figure 3D indicated higher estimated cell radius in edematous areas than in tumors and normal white matter. Figure 4A showed the ratio between cell body and total cell fractions, theoretically reflecting abnormally proliferating tumor cells. However, this ratio was high not only in tumors but also in edematous areas. Adjusting this ratio based on cell radius introduced the cell number density ratio (Figure 4B), uniquely emphasizing tumor regions while maintaining similar profiles between edema and normal white matter. Mean and standard deviation of quantified parameters was summarized in Table 1.
These quantified parameter maps hold potential for improving diagnostic accuracy and surgical planning. Although our study utilized a research scanner with strong gradients, advancements in clinical scanners with similar capabilities offer promising potential for routine clinical application in the near future.
Conclusion
SANDI offers complementary information on brain cyto- and myelo-architecture. This model successfully characterizes microstructural changes in tumorous and edematous regions within brain tumors. The proposed cell number density ratio parameter uniquely highlights high cell number density in tumors and may offer a more accurate method for detecting tumor cells in invaded white matter and edema. As clinical scanners with strong gradients advance, this application may become routine in clinical settings.Acknowledgements
No acknowledgement found.References
- Chenevert TL, Sundgren PC, Ross BD. Diffusion imaging: insight to cell status and cytoarchitecture. Neuroimaging Clinics. 2006 Nov 1;16(4):619-32.
- Kinoshita M, Uchikoshi M, Tateishi S, Miyazaki S, Sakai M, Ozaki T, Asai K, Fujita Y, Matsuhashi T, Kanemura Y, Shimosegawa E. Magnetic resonance relaxometry for tumor cell density imaging for glioma: An exploratory study via 11C-methionine PET and its validation via stereotactic tissue sampling. Cancers. 2021 Aug 12;13(16):4067.
- Wu D, Jiang K, Li H, Zhang Z, Ba R, Zhang Y, Hsu YC, Sun Y, Zhang YD. Time-dependent diffusion MRI for quantitative microstructural mapping of prostate cancer. Radiology. 2022 Jun;303(3):578-87.
- Zhang H, Schneider T, Wheeler-Kingshott CA, Alexander DC. NODDI: practical in vivo neurite orientation dispersion and density imaging of the human brain. Neuroimage. 2012 Jul 16;61(4):1000-16.
- Maximov II, Tonoyan AS, Pronin IN. Differentiation of glioma malignancy grade using diffusion MRI. Physica Medica. 2017 Aug 1;40:24-32
- Palombo M, Ianus A, Guerreri M, Nunes D, Alexander DC, Shemesh N, Zhang H. SANDI: a compartment-based model for non-invasive apparent soma and neurite imaging by diffusion MRI. Neuroimage. 2020 Jul 15;215:116835.
- Schiavi S, Palombo M, Zacà D, Tazza F, Lapucci C, Castellan L, Costagli M, Inglese M. Mapping tissue microstructure across the human brain on a clinical scanner with soma and neurite density image metrics. Human Brain Mapping. 2023 Sep;44(13):4792-811.
Figures