3459
DIMOND: Universal Microstructural Model Solver for Diffusion MRI1Department of Biomedical Engineering, Tsinghua University, Beijing, China, 2Wellcome Centre for Integrative Neuroimaging, FMRIB, Nuffield Department of Clinical Neurosciences, University of Oxford, Oxford, United Kingdom, 3Athinoula A. Martinos Center for Biomedical Imaging, Massachusetts General Hospital, Charlestown, MA, United States, 4Harvard Medical School, Boston, MA, United States, 5Department of Engineering Physics, Tsinghua University, Beijing, China
Synopsis
Keywords: Microstructure, Microstructure, self-superivsed, physics-informed
Motivation: Diffusion modeling is an important tool for quantifying microstructure properties from diffusion data, but its optimization is computationaly expensive.
Goal(s): To achieve rapid microstructure model parameter estimation while outperforming conventional methods.
Approach: DIMOND employs a neural network (NN) to map input diffusion data to model parameters and optimizes NN by minimizing the difference between the input data and the synthetic data generated via the diffusion model parametrized by NN outputs.
Results: DIMOND outperforms conventional methods for fitting kurtosis and NODDI models in terms of metric accuracy. DIMOND reduces NODDI model fitting time from hours to minutes, or even seconds by leveraging transfer learning.
Impact: DIMOND has a high potential to transform diffusion model fitting. Its self-supervised training paradigm, high efficacy and efficiency may dramatically improve the feasibility and accessibility of diffusion MRI based microstructure and connectivity mapping in clinical and neuroscientific applications.
Introduction
Diffusion MRI is a non-invasive technique for mapping brain tissue microstructure. Nonetheless, optimizing microstructural model parameters on diffusion data is a non-linear process and thereby computationally expensive1,2, which hinders its wide applications, such as real-time feedback during scans for diagnosis and neurosurgical guidance.Deep learning techniques utilizing neural networks (NNs) have demonstrated superior performance in generating high-quality diffusion model parameters efficiently3,4. NNs can recover high-quality model parameters from reduced q-space samples, shortening acquisition time3,5. Moreover, NN transforms the iterative parameter optimization into signal-to-parameter mapping, which can be executed in a few seconds once the network is trained.
Nevertheless, current deep learning parameter mappings are mostly supervised. The training targets are generated using conventional methods, requiring additional computation. The fitting errors in targets induced by noise and outliers would propagate to NN, thereby necessitating substantially longer scans to obtain high-quality targets over numerous subjects. Moreover, it is not trivial to generalize NNs across datasets acquired with different hardware systems and imaging protocols, especially different diffusion-encoding directions and b-values.
We propose a self-supervised and physics-informed method “DIMOND” (DIffusion Model OptimizatioN with Deep learning)6 to address these challenges. DIMOND maps diffusion data to model parameters and updates NN’s parameters by minimizing the difference between the input data and synthetic data generated using the forward diffusion model parameterized by NN’s outputs. Previous effort has demonstrated DIMOND’s advantages for fitting tensor model6. In this study, we extend DIMOND for fitting more sophisticated kurtosis and NODDI models and demonstrate DIMOND is a universal solver for microstructure models.
Methods
HCP data. Diffusion data (18×b=0, 90×b=1000, 2000, 3000 s/mm2, 1.25 mm iso.) of 10 healthy subjects from the Human Connectome Project (HCP), WU-Minn-Ox Consortium7,8 were used. Two datasets were generated with six-fold accelerated subsets:(1) HCP-2Shell data. Two-shell data consisting of all 18 b=0 and 90×b=1000, 2000 s/mm2 image volumes were used for computing reference DKI metrics. A subset of the first three, 10, 20 volumes at b=0, 1000, 2000 s/mm2 were constructed.
(2) HCP-3Shell data. Three-shell data consisting of all image volumes were used for computing reference NODDI metrics. A subset of the first three b=0 and the first 15 DWI volumes at b=1000, 2000 and 3000 s/mm2 were constructed.
Framework. DIMOND employs an NN (G) to map input diffusion data (I) to unknown parameters of a diffusion model $$$\textbf{P}=G(I)$$$, and minimizes the difference between the synthetic signal (S) and input data (I) within region of interest (V) which excludes voxels within CSF for kurtosis model, and includes all voxels within brain mask for NODDI model using mean square error loss function (Fig.1):
$$\mathcal{L}=\frac{1}{n}\sum_{i=1}^{n}{MSE_{S_i \in V}\left(I_i,S_i\right)}.$$
For kurtosis model with unknown parameters $$$ \textbf{P} =\left[\textbf{D}^\mathit{T}\ \textbf{K}^\mathit{T}{\ S}_0\right]^\mathit{T}$$$, the diffusion-weighted signal $$$S_i$$$ along diffusion-encoding direction $$$\textbf{v}_\mathit{i}=\left[v_{i1}\ v_{i2}\ v_{i3}\right]$$$ measured at b-value $$$b_i$$$ was9:
$$S_i=kurtosis\left(\textbf{P},\textbf{v}_\mathit{i},b_i\right)=S_0e^{-b_i\sum_{j=1}^{3}\sum_{k=1}^{3}v_{ij}v_{ik}D_{jk}+\frac{1}{6}{b_i}^2\left(\frac{1}{3}\sum_{j=1}^{3}D_{jj}\right)^2K_i^{app}},$$
$$K_i^{app}=\sum_{j=1}^{3}\sum_{k=1}^{3}\sum_{l=1}^{3}\sum_{m=1}^{3}{v_{ij}v_{ik}v_{il}v_{im}K_{jklm}}.$$
Similarly, for NODDI model with unknown parameters $$$\textbf{P}=\left[f_{iso},f_{ic},\boldsymbol{\mu}^\mathit{T},\kappa\right]^T$$$ , the $$$S_i$$$ is calculated using2:
$$S_i=NODDI\left(\textbf{P},\textbf{v}_\mathit{i},b_i,\ S_0\right)=S_0\left(\left(1-f_{iso}\right)\left(f_{ic}A_{ic}+\left(1-f_{ic}\right)A_{ec}\right)+f_{iso}A_{iso}\right).$$
Deployment. NNs and all diffusion models were implemented using Pytorch10 and trained using Adam optimizers11 on 64×64×64 image blocks. The learning rate was 0.001 and 0.0001 for the first 10000 and subsequent 5000 blocks. The Monte Carlo dropout12 was used during inference. Specifically, 20 inferences were generated with dropout and then averaged (denoted DIMOND-MC20).
Comparison. For kurtosis model, ordinary least squared regression of MRtrix3 (MRtrix3-OLS), iterative weighted least squared regression (iterations=10) of MRtrix3 (MRtrix3-IWLS10)13, constrained weighted least squared regression of DESIGNER (DESIGNER-CWLS)14 and DIMOND were compared. For NODDI model, NODDI-Toolbox2, Dmipy15 and DIMOND were compared. Reference kurtosis and NODDI parameters were fitted using MRtrix3-OLS and NODDI-Toolbox respectively.
Results
DIMOND successfully fitted the kurtosis model and outperformed conventional methods (Fig.2, 3). MRtrix3-OLS and MRtrix3-IWLS10 failed to estimate MK and RK for numerous voxels on sub-sampled data, highlighting the necessity of prolonged acquisition time for training target generation in supervised learning.DIMOND generated NODDI parameters more efficiently and effectively (Fig.4, 5). DIMOND-MC20 results from three training strategies were generally similar, demonstrating high generalization capability of the subject-specific trained NN. DIMOND took 24.1 minutes, 7.9 minutes or even 32 seconds by directly applying the NN trained on another subject to generate high-quality NODDI parameters, remarkably faster than other methods especially NODDI-Toolbox (12.3 hours, parallel computation on 32 CPU processes).
Discussion and Conclusion
This study demonstrated DIMOND can extend to any microstructural model for fast and self-supervised diffusion model parameter estimation. More importantly, DIMOND’s ability to generate high-quality results using the simplest implementation (MSE loss) and easy deployment using mature deep learning platforms make it a next-generation tool to simplify and accelerate diffusion MRI analysis for a wider range of applications in neuroscientific studies and clinical practice.Acknowledgements
The diffusion data were provided by the Human Connectome Project, WU-Minn-Ox Consortium (Principal Investigators: David Van Essen and Kamil Ugurbil; U54-MH091657) funded by the 16 NIH Institutes and Centers that support the NIH Blueprint for Neuroscience Research; and by the McDonnell Center for Systems Neuroscience at Washington University.
References
1. Alexander DC, Hubbard PL, Hall MG, et al. Orientationally invariant indices of axon diameter and density from diffusion MRI. Neuroimage. 2010;52(4):1374-1389.
2. Zhang H, Schneider T, Wheeler-Kingshott CA, Alexander DC. NODDI: practical in vivo neurite orientation dispersion and density imaging of the human brain. Neuroimage. 2012;61(4):1000-1016.
3. de Almeida Martins JP, Nilsson M, Lampinen B, et al. Neural networks for parameter estimation in microstructural MRI: Application to a diffusion-relaxation model of white matter. NeuroImage. 2021;244:118601.
4. Golkov V, Dosovitskiy A, Sperl JI, et al. q-Space deep learning: twelve-fold shorter and model-free diffusion MRI scans. IEEE transactions on medical imaging. 2016;35(5):1344-1351.
5. Tian Q, Bilgic B, Fan Q, et al. DeepDTI: High-fidelity six-direction diffusion tensor imaging using deep learning. NeuroImage. 2020;219:117017.
6. Zihan Li BB, Hong-Hsi Lee, Kui Ying, Hongen Liao, Susie Huang, Qiyuan Tian, . DIMOND: DIffusion Model OptimizatioN with Deep learning. Proceedings of the 32st Annual Meeting of the International Society for Magnetic Resonance in Medicine (ISMRM) 2023. 2023;
7. Glasser MF, Sotiropoulos SN, Wilson JA, et al. The minimal preprocessing pipelines for the Human Connectome Project. Neuroimage. 2013;80:105-124.
8. Glasser MF, Smith SM, Marcus DS, et al. The human connectome project's neuroimaging approach. Nature Neuroscience. 2016;19(9):1175-1187.
9. Jensen JH, Helpern JA, Ramani A, Lu H, Kaczynski K. Diffusional kurtosis imaging: the quantification of non‐gaussian water diffusion by means of magnetic resonance imaging. Magnetic Resonance in Medicine: An Official Journal of the International Society for Magnetic Resonance in Medicine. 2005;53(6):1432-1440.
10. Paszke A, Gross S, Massa F, et al. Pytorch: An imperative style, high-performance deep learning library. Advances in neural information processing systems. 2019;32
11. Kingma DP, Ba J. Adam: A method for stochastic optimization. arXiv preprint arXiv:14126980. 2014;
12. Avci MY, Li Z, Fan Q, Huang S, Bilgic B, Tian Q. Quantifying the uncertainty of neural networks using Monte Carlo dropout for deep learning based quantitative MRI. arXiv preprint arXiv:211201587. 2021;
13. Tournier J-D, Smith R, Raffelt D, et al. MRtrix3: A fast, flexible and open software framework for medical image processing and visualisation. Neuroimage. 2019;202:116137.
14. Ades-Aron B, Veraart J, Kochunov P, et al. Evaluation of the accuracy and precision of the diffusion parameter EStImation with Gibbs and NoisE removal pipeline. Neuroimage. 2018;183:532-543.
15. Fick RH, Wassermann D, Deriche R. The dmipy toolbox: Diffusion mri multi-compartment modeling and microstructure recovery made easy. Frontiers in neuroinformatics. 2019;13:64.
Figures
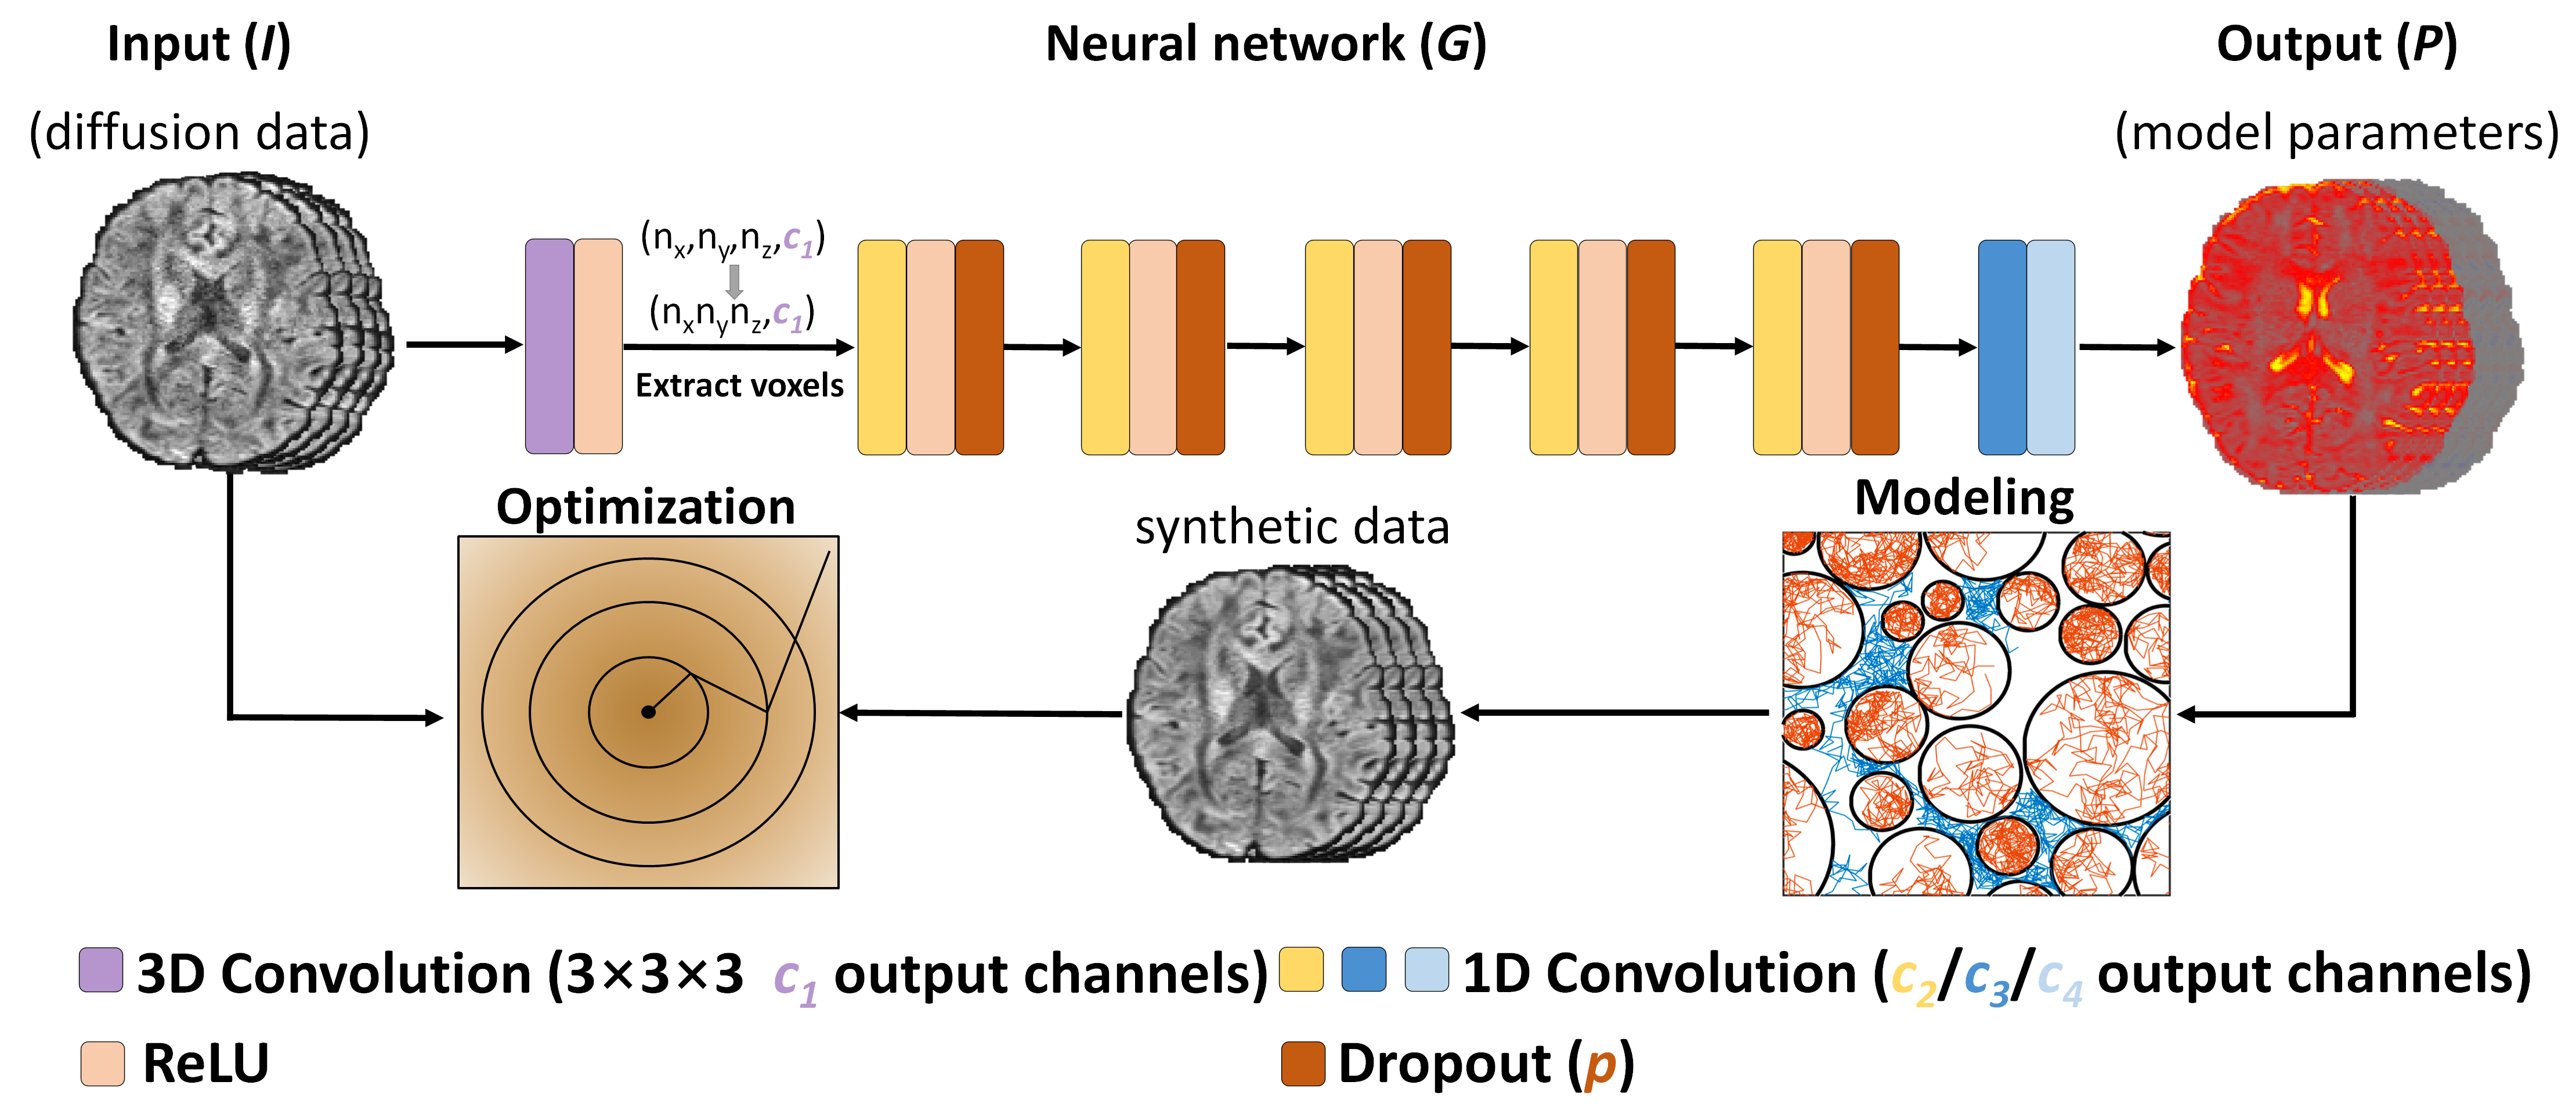
Figure 1. DIMOND framework. DIMOND employs a neural network (G) to map input diffusion data (I) to unknown parameters (P) of a diffusion model. The synthetic data are then generated by the diffusion model parameterized by P. The NN is trained by minimizing the difference (e.g., MSE) between the input and synthetic data using gradient descent. G consists of one 3×3×3 convolution layer for spatial information integration and six fully connected layers for feature processing. The features of each voxel are concatenated before inputting the fully connected layers. The dropout rate p=0.05.
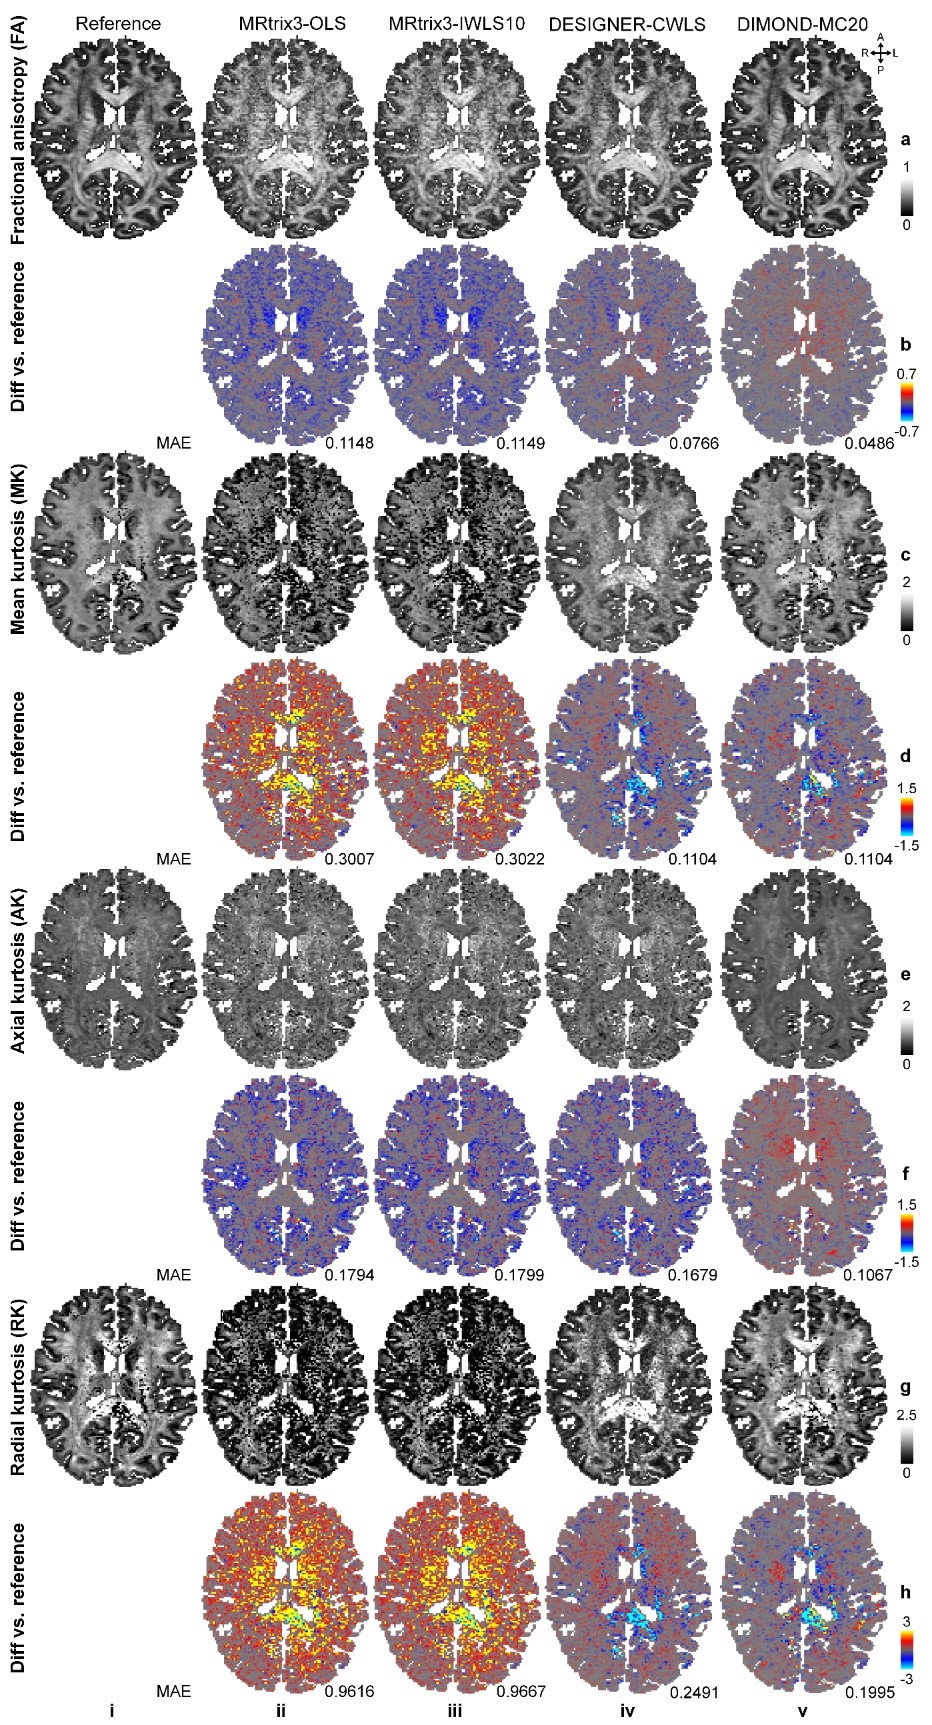
Figure 2. DKI metrics. Exemplary axial maps of DKI metrics including fractional anisotropy (a), mean kurtosis (c), axial kurtosis (e) and radial kurtosis (g) derived from kurtosis results generated from MRtrix3-OLS using all available HCP-2Shell data (i, reference), and those generated from MRtrix3-OLS (ii), MRtrix3-IWLS10 (iii), DESIGNER-CWLS (iv) and DIMOND-MC20 (v) using sub-sampled data of a representative HCP subject are shown. The difference maps compared to the reference are also displayed (b, d, f, h), with mean absolute errors (MAEs) listed to quantify the similarity.
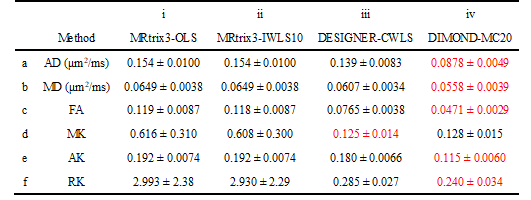
Figure 3. DKI metric accuracy quantification. The group means (± group standard deviations) of the mean absolute error (MAE) of DKI metrics between the reference and those from MRtrix3-OLS (i), MRtrix3-IWLS10 (ii), DESIGNER-CWLS (iii) and DIMOND-MC20 (iv) across 10 HCP subjects are listed. The red text and blue text highlight the lowest and second lowest MAEs respectively.
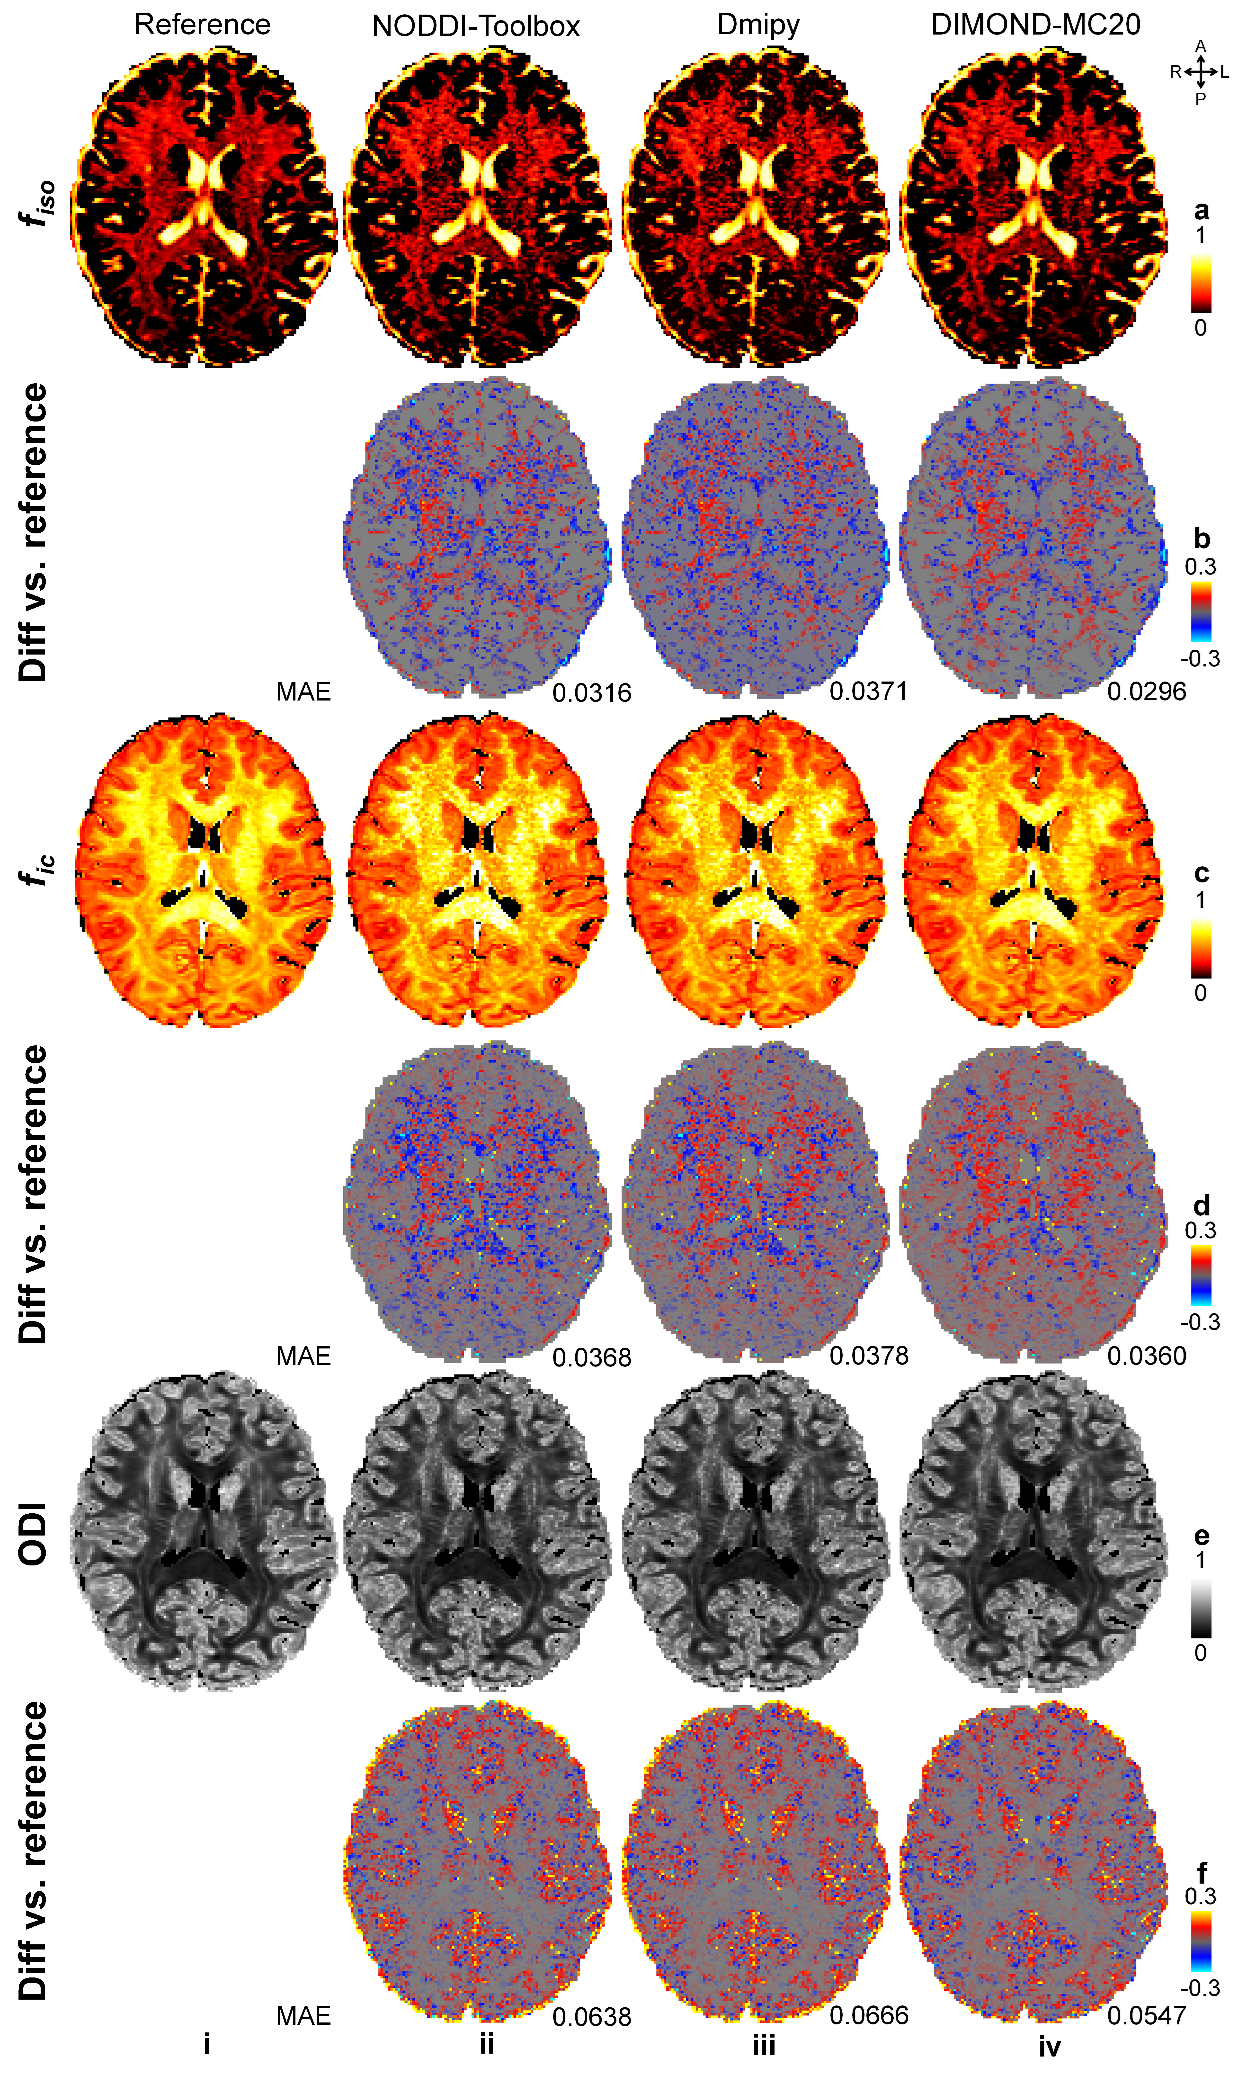
Figure 4. NODDI metrics. Exemplary axial maps of isotropic volume fraction ($$$f_{iso}$$$) (a), intracellular volume fraction ($$$f_{ic}$$$) (c) and orientation dispersion index (ODI, e) generated from NODDI-Toolbox on all available HCP-3Shell data (i, reference), and those generated using NODDI-Toolbox (ii), Dmipy (iii) and DIMOND-MC20 (iv) from the sub-sampled data of a representative HCP subject are shown. The residual maps compared to the reference are also displayed (b, d and f), with the mean absolute errors (MAEs) listed to quantify the similarity.
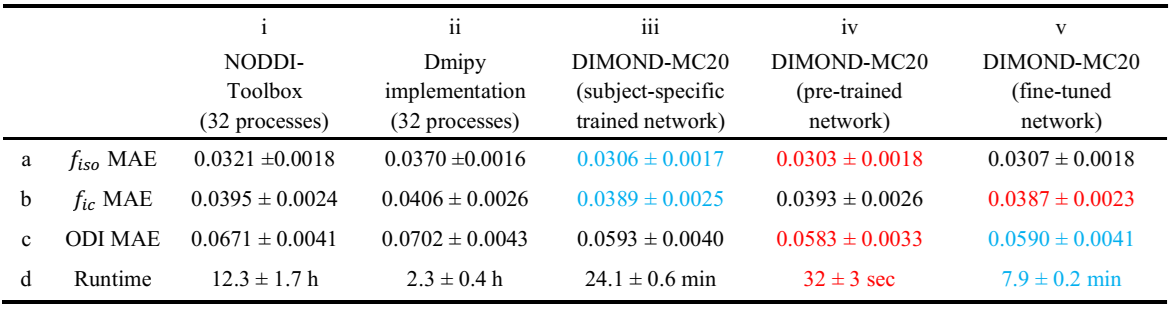
Figure 5. NODDI metric accuracy quantification. The group means (± group standard deviations) of the mean absolute error (MAE) of NODDI metrics (a-c) between the reference and those generated from different methods, and time cost (s) across 10 HCP subjects are listed. For DIMOND, results were generated using a subject-specific trained network (iii), a network pre-trained on the data of a representative HCP subject (iv), or a pre-trained network fine-tuned on the data of each individual subject (v). The red and blue text highlights the lowest and second lowest MAEs or runtime.