3458
Estimating transcytolemmal water exchange from the Kärger model using a Bayesian method in the human brain1Biomedical Engineering, Zhejiang University, Hangzhou, China
Synopsis
Keywords: Microstructure, Brain
Motivation: Transcytolemal water exchange time (tex) can be estimated using diffusion-time-dependent diffusion kurtosis imaging (tDKI) acquired at long diffusion times(td). However, dMRI signals acquired at long td's using STEAM sequence are noisy, fitting of tDKI model accumulates errors.
Goal(s): proposed a Bayesian strategy to improve the accuracy and robustness of tex mapping based on the Kärger model (KM).
Approach: we fitted the tex map based on the simulation and in vivo human brain data using Bayesian and the nonlinear least square methods to compare the fitting results.
Results: Bayesian fitting significantly reduced the estimation error and variance in the simulation and in vivo scan.
Impact: The proposed a Bayesian strategy significantly reduced the estimation error and variance and improved microstructural maps in vivo. And the proposed 10-minute td-dMRI protocol showed potential value for water exchange mapping in the human brain in clinical practice.
Introduction
The exchange time (tex) is a potential biomarker reflecting changes in cell volume regulation by active or passive transportations1, which has recently been quantified by diffusion-weighted MRI (dMRI) in simulation and preclinical studies2–5. Among various models6–9, diffusion-time(td) dependent diffusional kurtosis imaging (tDKI) 7 based on the Kärger model (KM) shows promise for measuring transcytolemmal water exchange using stimulated echo acquisition mode (STEAM)-DWI pulse sequences. However, since data acquired with STEAM sequences have intrinsically low SNRs5,8, and the accumulated estimation errors from kurtosis fitting and KM fitting, and the feasibility of tDKI in clinical applications remains unknown. This study proposed a Bayesian strategy10 for tDKI fitting as an alternative to the nonlinear least square (NLLS) approach. Computer simulations and in vivo human experiments were performed under clinically feasible settings.Methods
Simulation data: A finite difference (FD) method9,11,12 incorporating the transmembrane permeability was utilized to generate td-MRI signals. The tissue was modeled as tightly packed face-centered spheres, with a fixed diameter (d) of 8 μm, intracellular fraction (fin) of 0.45, intracellular diffusivity (Din) of 1 μm2/ms, extracellular diffusivity (Dex) of 2 μm2/ms and varying exchange rates of 10, 20, 100 s-1, Gaussian noise was added to the signal to achieve SNR from 10 to 50.Data acquisition: Five healthy adult participants were recruited. The MRI was performed on a 3T Siemens Prisma scanner (Gmax=80 mT/m, SRmax=200 m/T/s) and a 64-channel head array coil. STEAM sequences were performed at seven td (from 100 to 500ms) with one b = 0, and two b-shells (b = 1 and 2 ms/μm2) in thirty diffusion directions. Slices with 4mm-thickness were acquired with TR/TE = 3500/65 ms, FOV = 220 mm, resolution = 1.75×1.75 mm2. The scan time for one td was 3:44 min.
Data analysis: In vivo dMRI data were pre-processed with MRtrix13 and fitted using DKE toolbox14 to obtain diffusivity and kurtosis at individual td. The simulated data were fitted with cumulative expression using MATLAB. K(t) was fed into tDKI model to estimate K0 and tex while fixing K∞=0. NLLS curve fitting was performed and repeated 50 times with randomized initialization in MATLAB. A house-made Bayesian fitting pipeline was developed according to Gustafsson et al10 with lognormal priors, and we took the mean and media as central tendency measures of K0 and tex estimations. Methods were evaluated by root-mean-square-error (RMSE) and standard deviation (STD) at each tex and SNR level. The averaged RMSE of all tex values between two methods and the error at each SNR level were compared. For in vivo experiments, ROIs were manually delineated including white matter regions such as corpus callosum (CC) and internal capsule (IC), and gray matter regions including thalamus, putamen, and cortex.
Results
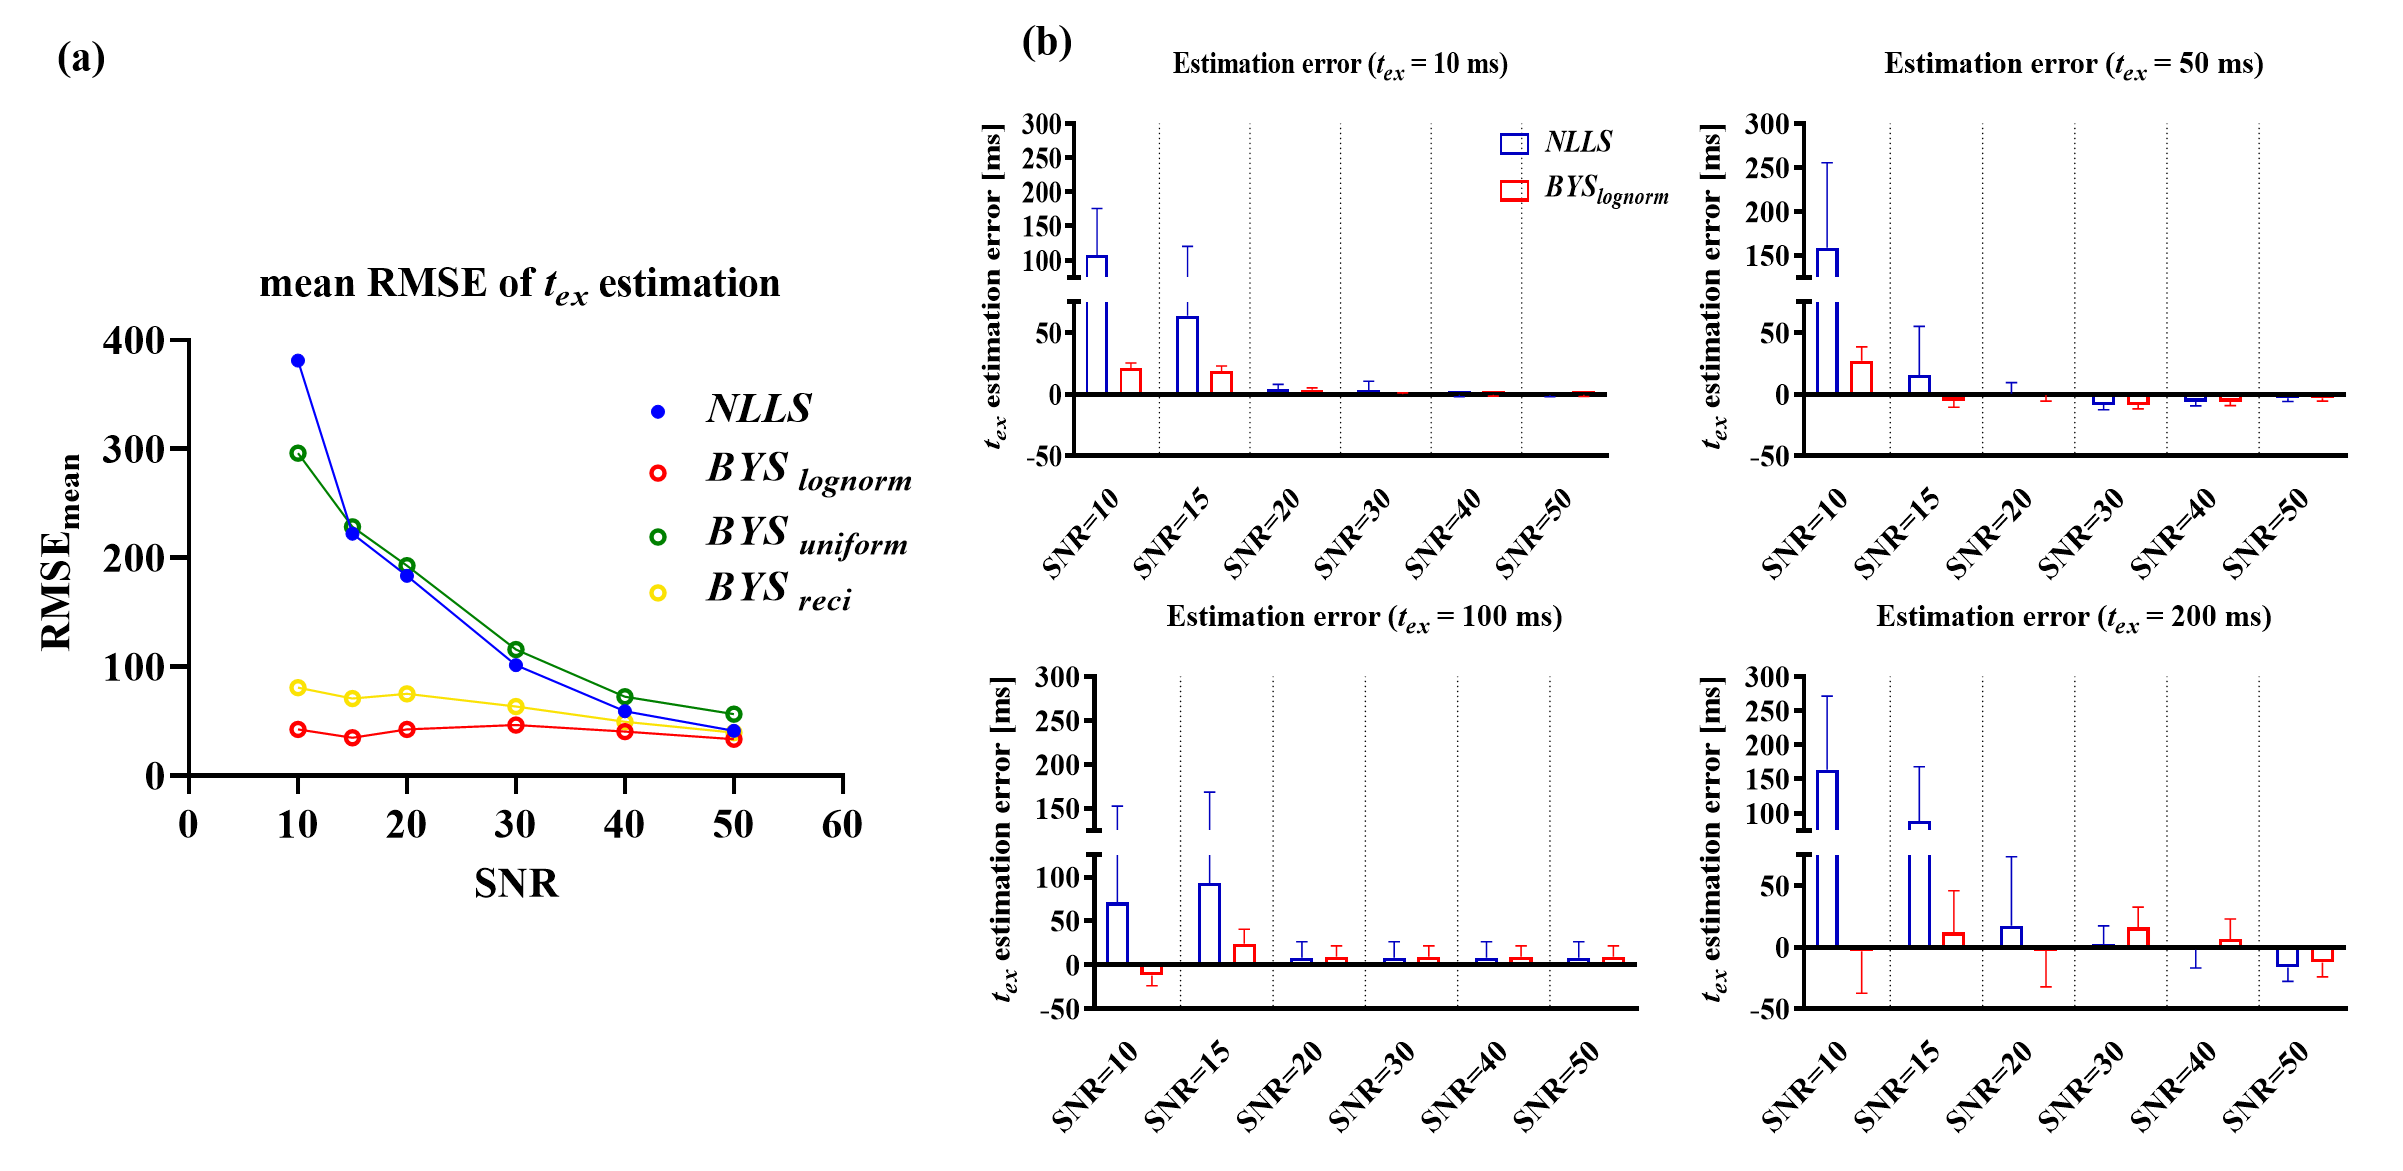
Simulation experimentFigure 1a showed mean RMSEs of estimated tex using NLLS and Bayesian methods at SNR levels from 10 to 50. All RMSEs decreased with the increase of SNR levels, except for the Bayesian method using lognormal prior, which kept constantly low RMSEs regardless of SNR and significantly lower STD, lower mean error, and fewer outliers than the NLLS method (Figure 1b).
Human experiments
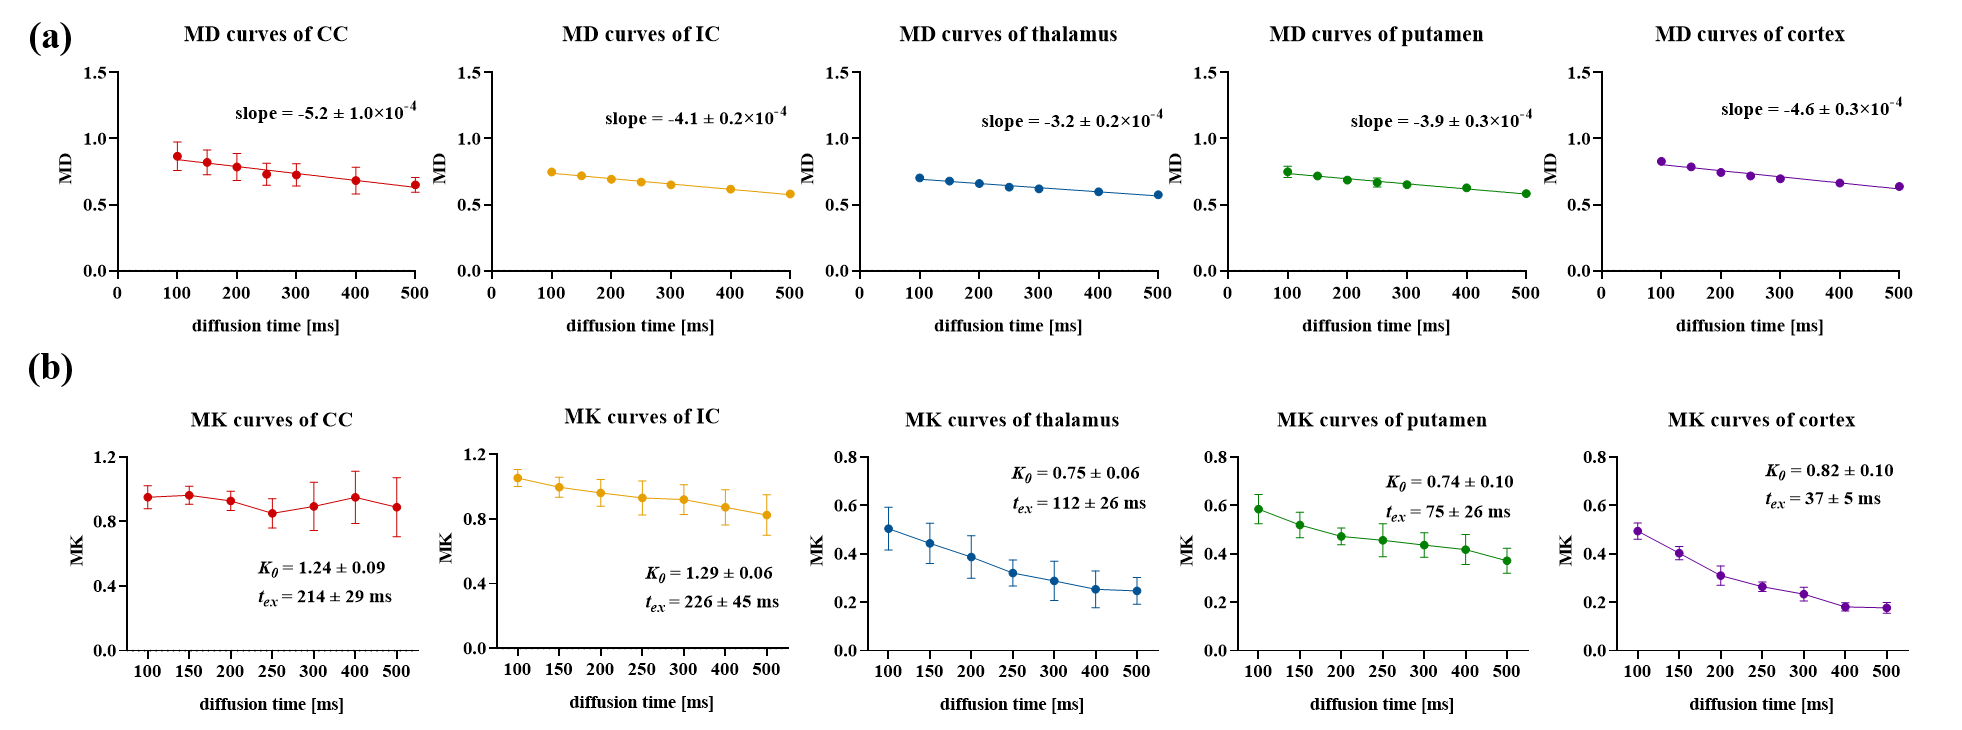
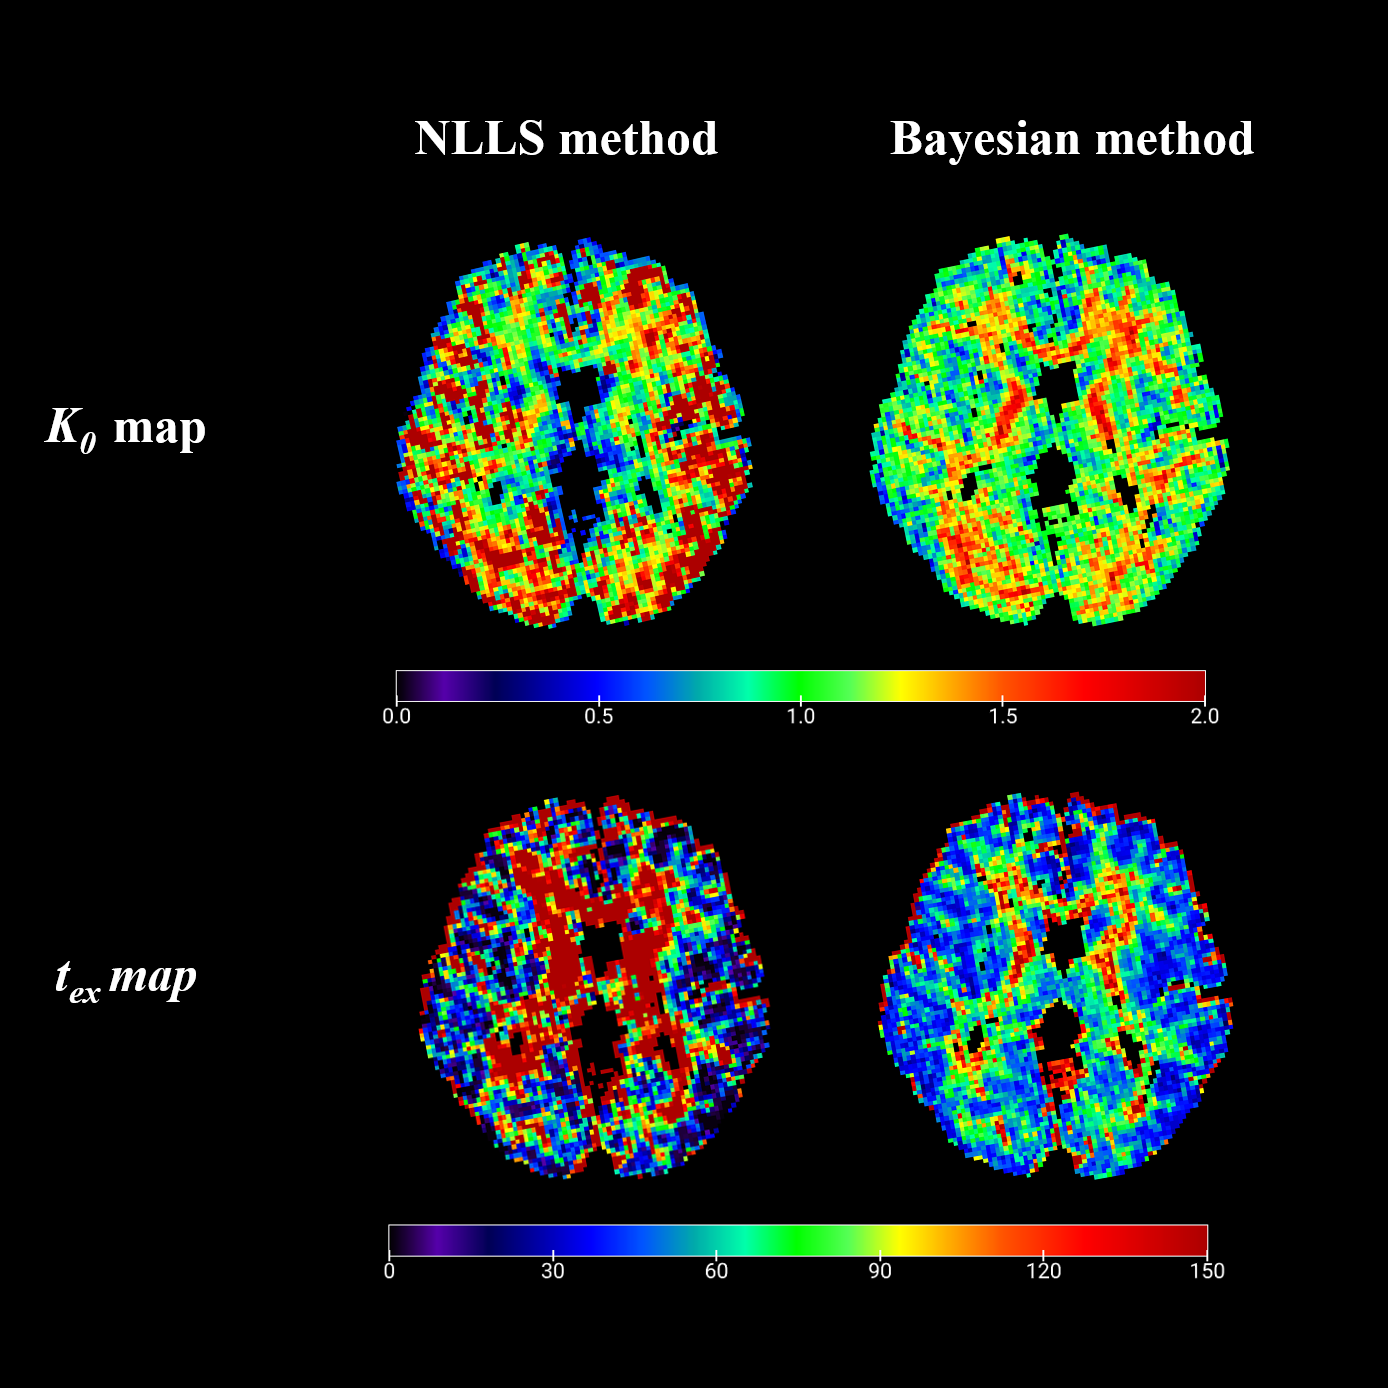
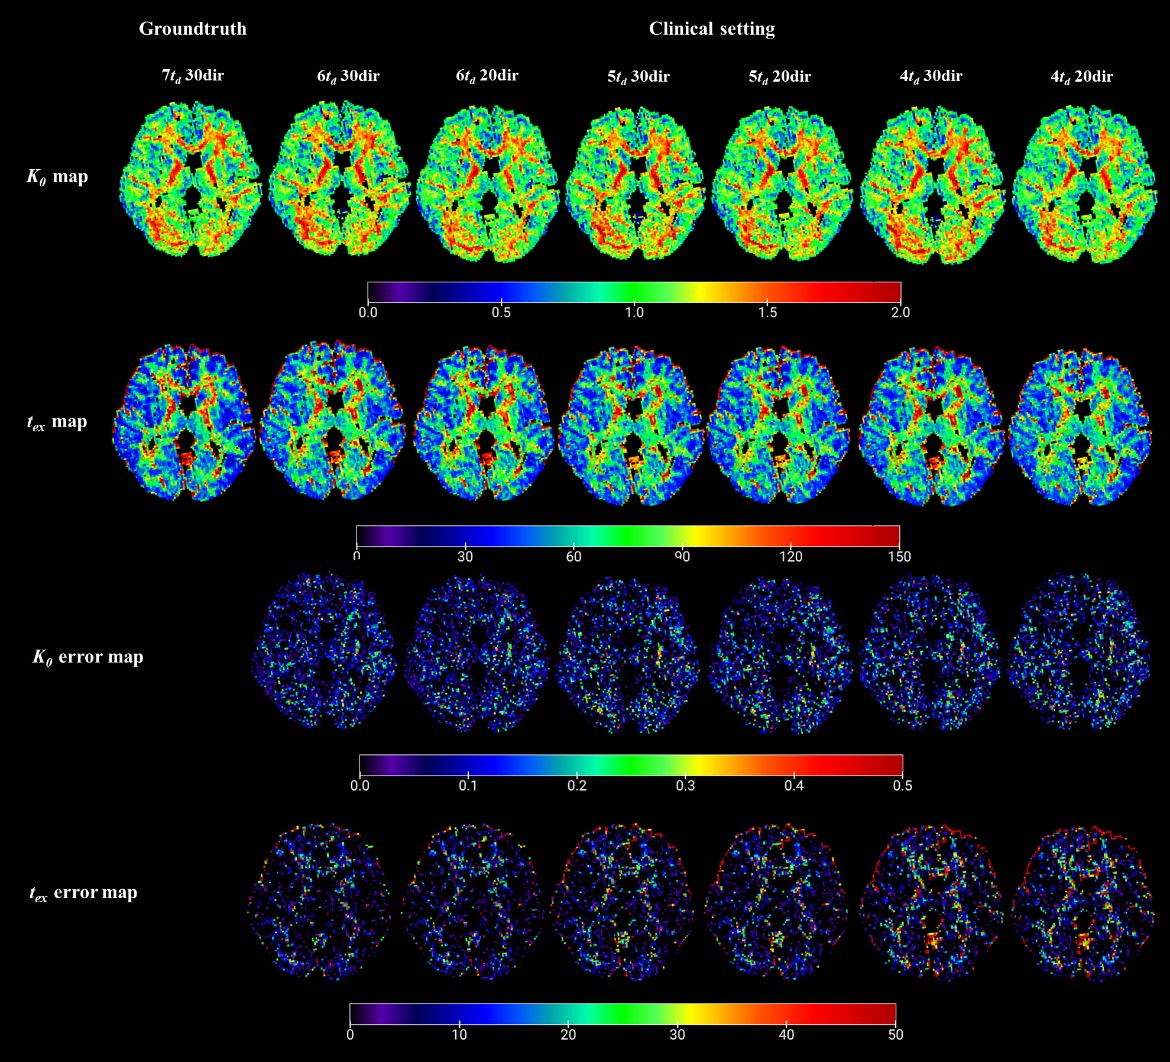
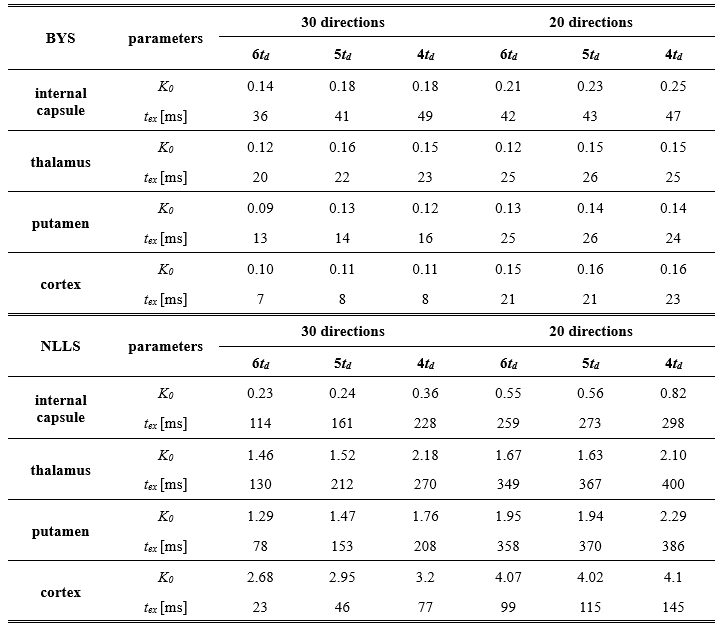
Figure 2 showed the td-dependence of diffusivity and kurtosis in all participants. The diffusivity demonstrated weak td-dependence while the kurtosis exhibited decreased pronounced td-dependent curves. KM-based fitting in Figure 2b showed the lowest tex of 37±5 ms, 75±26 ms, 112±26 ms in cortex, putamen, and thalamus, and relatively longer tex of 214±29 ms and 226±45 ms in CC and IC. The KM parameter maps showed that K0 and tex fitted by Bayesian method yield more cleaner maps and less outliers (Figure 3). We further optimized a clinically feasible tDKI protocol by downsampling the existing data. Figure 4 showed the K0 and tex maps and their error maps using different combinations of td and diffusion directions. The values in gray matter are close to the ground truth even when using 4 td’s (100, 200,400,500 ms) and 20 gradient directions, leaving a protocol that only takes ~10min.
Discussion and Conclusion
This study demonstrates the effectiveness of the tDKI method with Bayesian fitting in quantifying transcytolemal water exchange in gray matter of the human brain. Compared with the NLLS method, the Bayesian fitting achieved higher robustness while ensuring accuracy, especially in low SNR situations. Furthermore, we optimized the tDKI protocol for clinical scans that enabled tex measurement feasible within 10 minutes. Statistical analysis with a larger sample size and more combinations of diffusion times will be performed in future studies. The impact of the crusher gradient should also be taken into consideration.Acknowledgements
This work is supported by the National Natural Science Foundation of China (81971606, 82122032), and Science and Technology Department of Zhejiang Province (2022C03057, 202006140)References
1. Lampinen, B. et al. Optimal experimental design for filter exchange imaging: Apparent exchange rate measurements in the healthy brain and in intracranial tumors. Magnetic Resonance in Medicine 77, 1104–1114 (2017).
2. Li, C., Fieremans, E., Novikov, D. S., Ge, Y. & Zhang, J. Measuring water exchange on a preclinical MRI system using filter exchange and diffusion time dependent kurtosis imaging. Magnetic Resonance in Medicine 89, 1441–1455 (2023).
3. Solomon, E. et al. Time-dependent diffusivity and kurtosis in phantoms and patients with head and neck cancer. Magnetic Resonance in Medicine 89, 522–535 (2023).
4. Zhang, J. et al. Measurement of cellular-interstitial water exchange time in tumors based on diffusion-time-dependent diffusional kurtosis imaging. NMR in Biomedicine 34, e4496 (2021).
5. Fieremans, E., Novikov, D. S., Jensen, J. H. & Helpern, J. A. Monte Carlo study of a two-compartment exchange model of diffusion. NMR in Biomedicine 23, 711–724 (2010).
6. Kärger, J. NMR self-diffusion studies in heterogeneous systems. Advances in Colloid and Interface Science 23, 129–148 (1985).
7. Jensen, J. H., Helpern, J. A., Ramani, A., Lu, H. & Kaczynski, K. Diffusional kurtosis imaging: The quantification of non-gaussian water diffusion by means of magnetic resonance imaging. Magnetic Resonance in Medicine 53, 1432–1440 (2005).
8. Jelescu, I. O., de Skowronski, A., Geffroy, F., Palombo, M. & Novikov, D. S. Neurite Exchange Imaging (NEXI): A minimal model of diffusion in gray matter with inter-compartment water exchange. NeuroImage 256, 119277 (2022).
9. Li, Z. et al. The direction-dependence of apparent water exchange rate in human white matter. NeuroImage 247, 118831 (2022).
10. Gustafsson, O., Montelius, M., Starck, G. & Ljungberg, M. Impact of prior distributions and central tendency measures on Bayesian intravoxel incoherent motion model fitting. Magnetic Resonance in Medicine 79, 1674–1683 (2018).
11. Hwang, S. N., Chin, C.-L., Wehrli, F. W. & Hackney, D. B. An image-based finite difference model for simulating restricted diffusion. Magnetic Resonance in Medicine 50, 373–382 (2003).
12. Xu, J., Does, M. D. & Gore, J. C. Numerical study of water diffusion in biological tissues using an improved finite difference method. Physics in Medicine & Biology 52, N111 (2007).
13. Tournier, J.-D. et al. MRtrix3: A fast, flexible and open software framework for medical image processing and visualisation. NeuroImage 202, 116137 (2019).
14. Tabesh, A., Jensen, J. H., Ardekani, B. A. & Helpern, J. A. Estimation of tensors and tensor-derived measures in diffusional kurtosis imaging. Magnetic Resonance in Medicine 65, 823–836 (2011).
Figures