3453
Data-driven analysis of cerebrovascular reactivity mapping with breath-hold challenges in brain tumor patients1Imaging Physics, The University of Texas MD Anderson Cancer Center, Houston, TX, United States, 2Biomedical Engineering and Environmental Sciences, National Tsing Hua University, Hsinchu, Taiwan, 3Medical Imaging, Taoyuan General Hospital, Ministry of Health and Welfare, Taoyuan, Taiwan, 4Radiology, University of Colorado School of Medicine, Aurora, CO, United States, 5Neuroradiology, The University of Texas MD Anderson Cancer Center, Houston, TX, United States
Synopsis
Keywords: fMRI Analysis, fMRI
Motivation: Cerebrovascular reactivity (CVR) mapping can provide valuable information for the evaluation of lesion and neurovascular uncoupling in brain tumors.
Goal(s): To evaluate the robustness of data-driven CVR analysis in patients with brain tumors.
Approach: CVR MRI of brain tumor patients (n=18) was performed with a breath-holding task paradigm. CVR map was obtained using GLM with four regressors for comparison: (1) gray matter (GM), (2) GM with lesion removed, (3) whole brain (WB), and (4) WB with lesion removed.
Results: Proper temporal and spatial filtering reduced the differences between the four regressors, resulting in similar CVR maps with highly correlated BOLD contrast.
Impact: The study demonstrated that with proper temporal processing, robust data-driven CVR analysis can be obtained in patients with brain tumors.
Introduction
CVR mapping using T2*-weighted BOLD MRI with breath-hold technique can be easily applied in clinical settings and can help evaluate disease status and neurovascular uncoupling in patients with brain tumors [1]. Data-driven analysis typically requires segmentation of gray matter and suggests removing lesions for generating the signal model [2,3]. This study aimed to derive relative cerebrovascular reactivity maps from breath-holding challenges and to investigate the impact of lesion inclusion of such approach in brain tumor patients.Methods
Image acquisitionMR datasets from 18 brain tumor patients were analyzed retrospectively (age [mean/sd] = 47.6/13.6 years, 9 females). Images were collected at a 3 T clinical scanner (GE Healthcare, Waukesha, WI, USA) as part of the presurgical planning protocol. Functional imaging was acquired with a 2D gradient-echo echo-planar imaging (GE-EPI) readout (TR/TE/FA=3000 ms/25 ms/90°, in-plane matrix size = 64x64, 32 slices, resolution = 3.75 x 3.75 x 4 mm3, 70 repetitions). Cerebrovascular reactivity mapping was implemented via a breath-holding (BH) technique. After a 30-s natural breathing baseline, patients were instructed to perform three cycles of breath-holding tasks, each consisting of a 15-s breath-holding followed by a 45-s natural breathing. High-resolution structural images were acquired to provide anatomical landmarks and tissue/lesion segmentations, including pre- and post-contrast T1-weighted (T1w) inversion recovery-prepared spoiled gradient echo, T2-weighted (T2w) fluid-attenuated inversion recovery (FLAIR), and T2w fast-spin echo sequence.
Image processing
The streamlined processing pipeline was conducted using FSL v6.0.7.4 (FMRIB, Oxford, UK) and seeVR toolbox v1.6 [3], including motion correction, skull stripping, registration, segmentation, despiking, spatial smoothing (FWHM = 4 mm), nuisance regression, and general linear modeling. The gray matter (GM) masks were calculated from the pre-contrast T1w images. Tumor lesions were automatically segmented using the cancer imaging phenomics toolkit (CaPTk) [4] and then revised by a neuroradiologist. Anatomical references were aligned to the native EPI space. An EPI-based whole brain (WB) mask was calculated based on the signal and noise levels without prior knowledge of anatomical references. The BOLD time course was normalized to the baseline average. Relative CVR amplitude maps were calculated by correlating BOLD response to averaged reference curves extracted from user-defined masks. Four sets of reference signals were tested based on the following conditions: (1) lesion-excluded GM [GM L(-)], (2) lesion-excluded WB [WB L(-)], (3) GM, and (4) WB. The pairwise correlation was computed using MATLAB 2023a (The MathWorks, Inc., Natick, MA, USA) to test the agreement in the resultant relative CVR amplitudes of the tested conditions. Relative CVR amplitude maps were scaled to corresponding 98th percentile values for visual comparison.[5]
Results
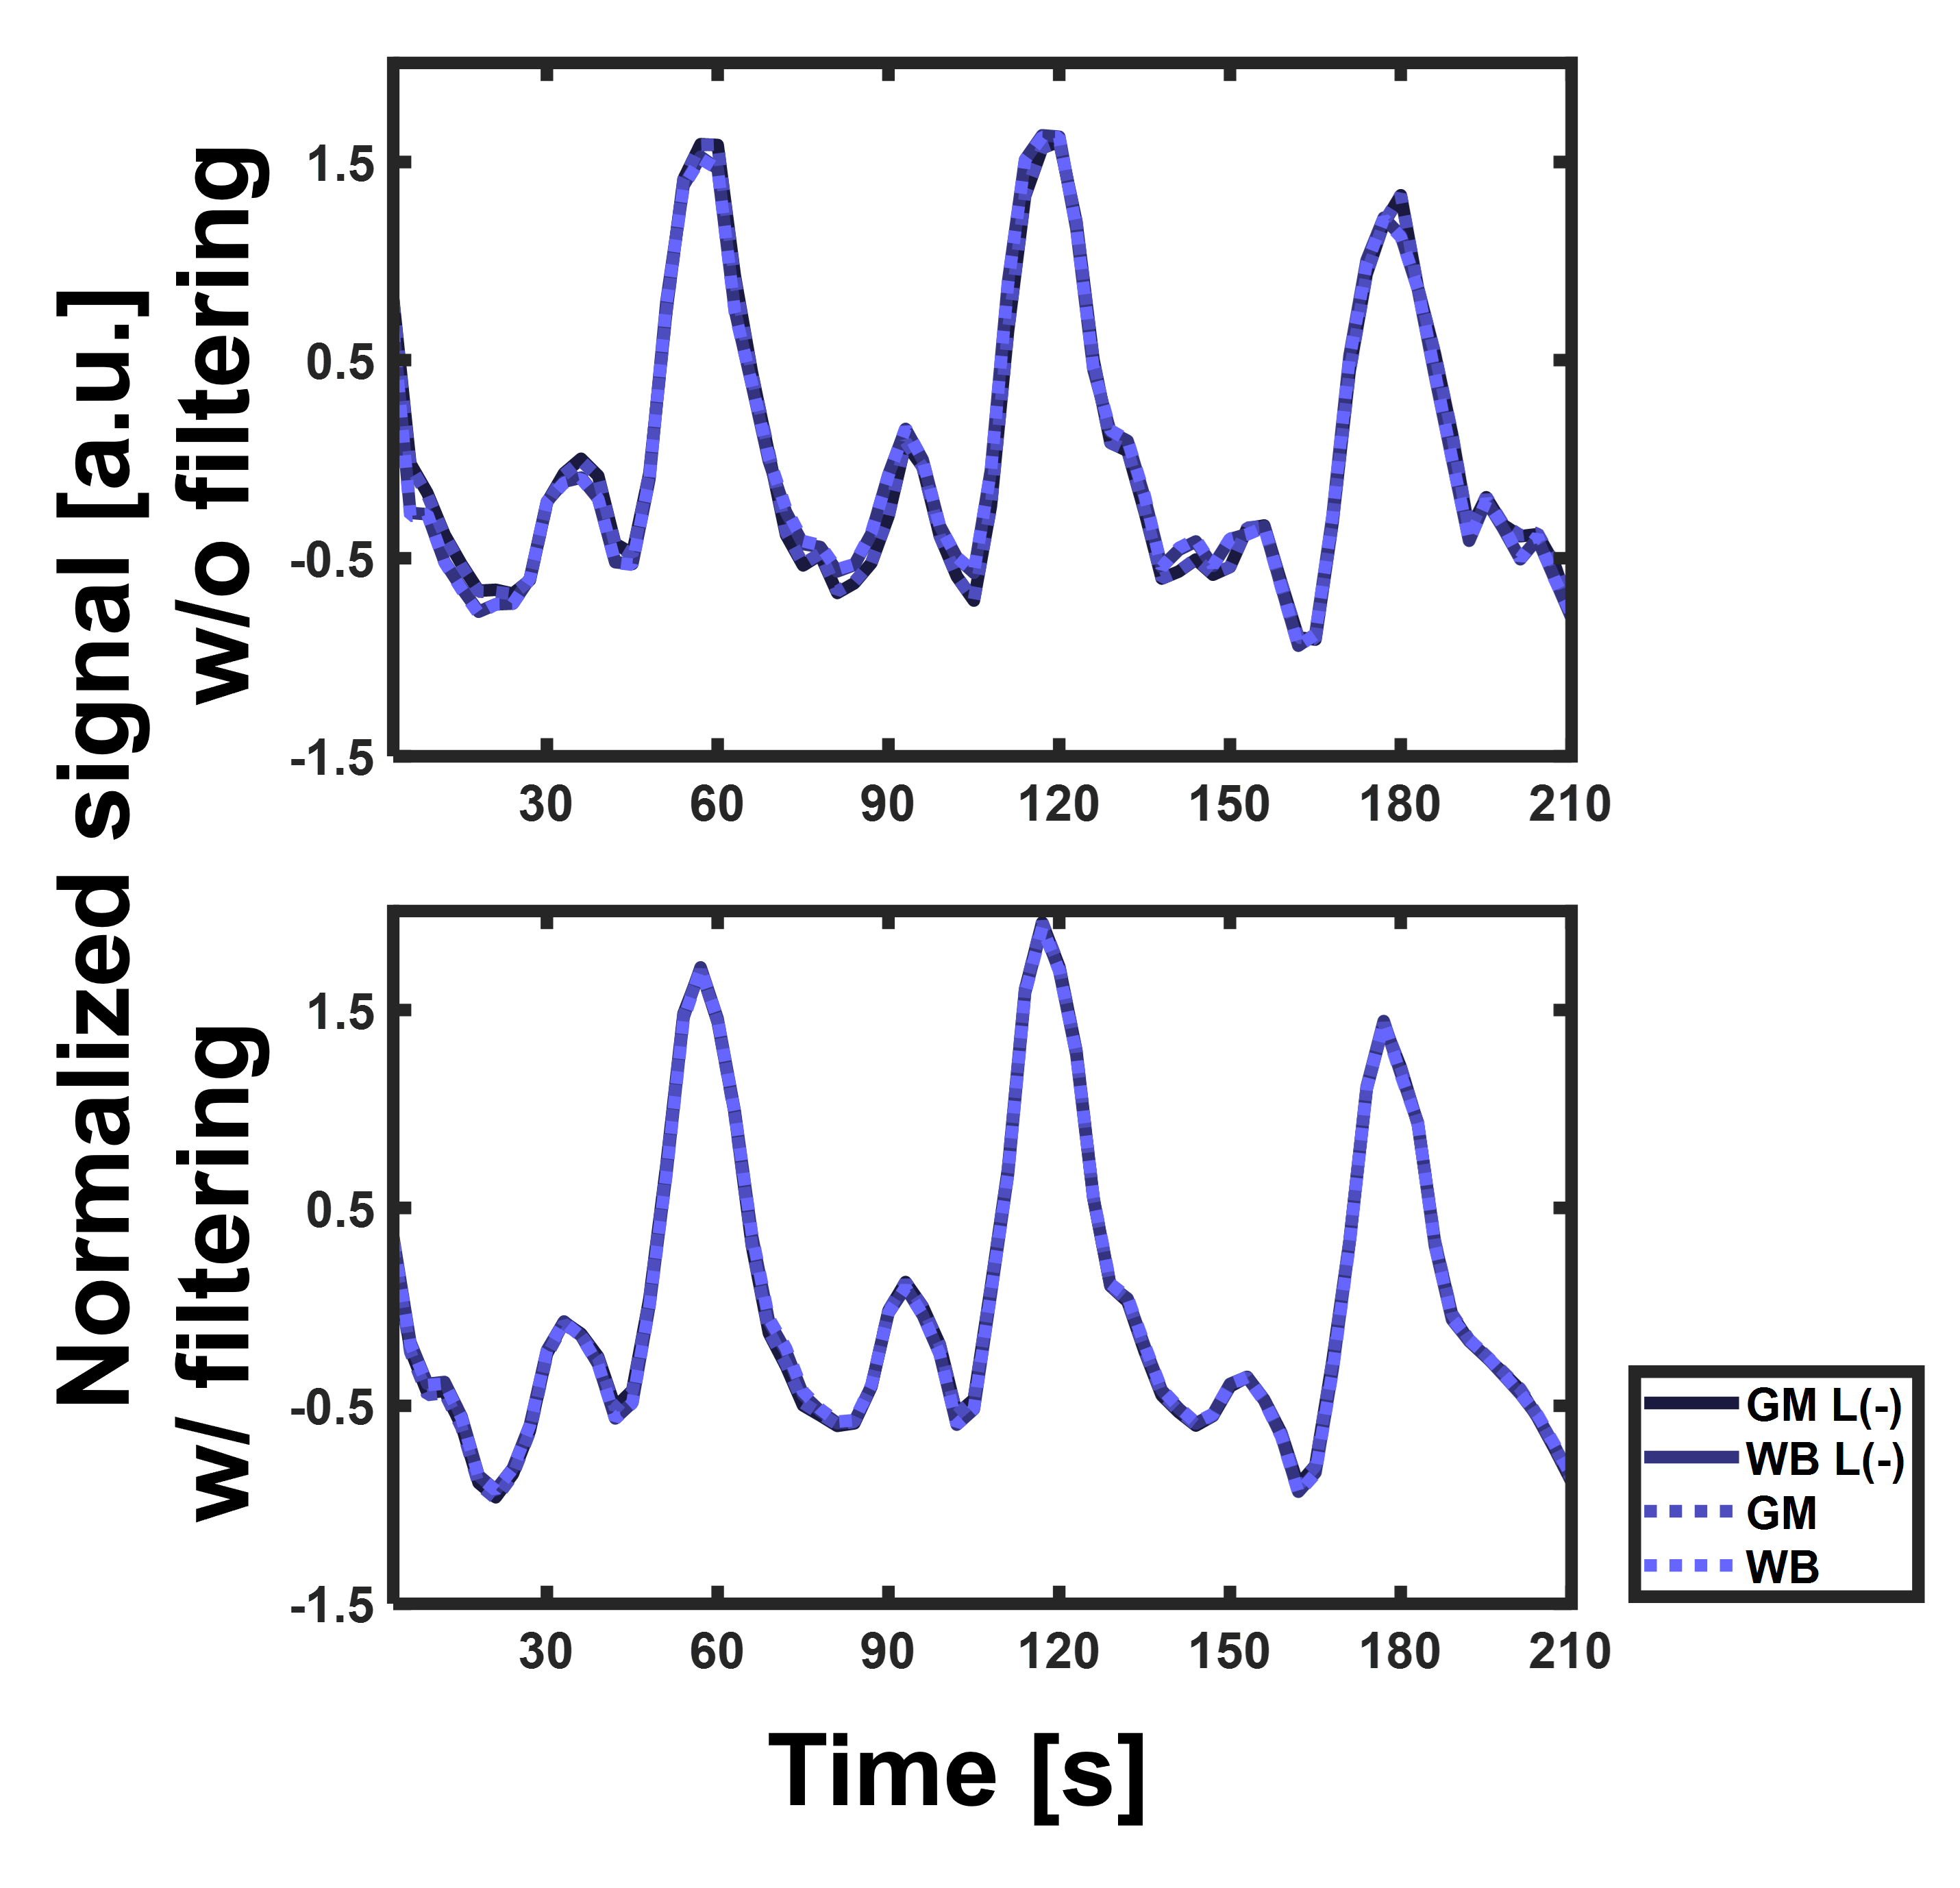
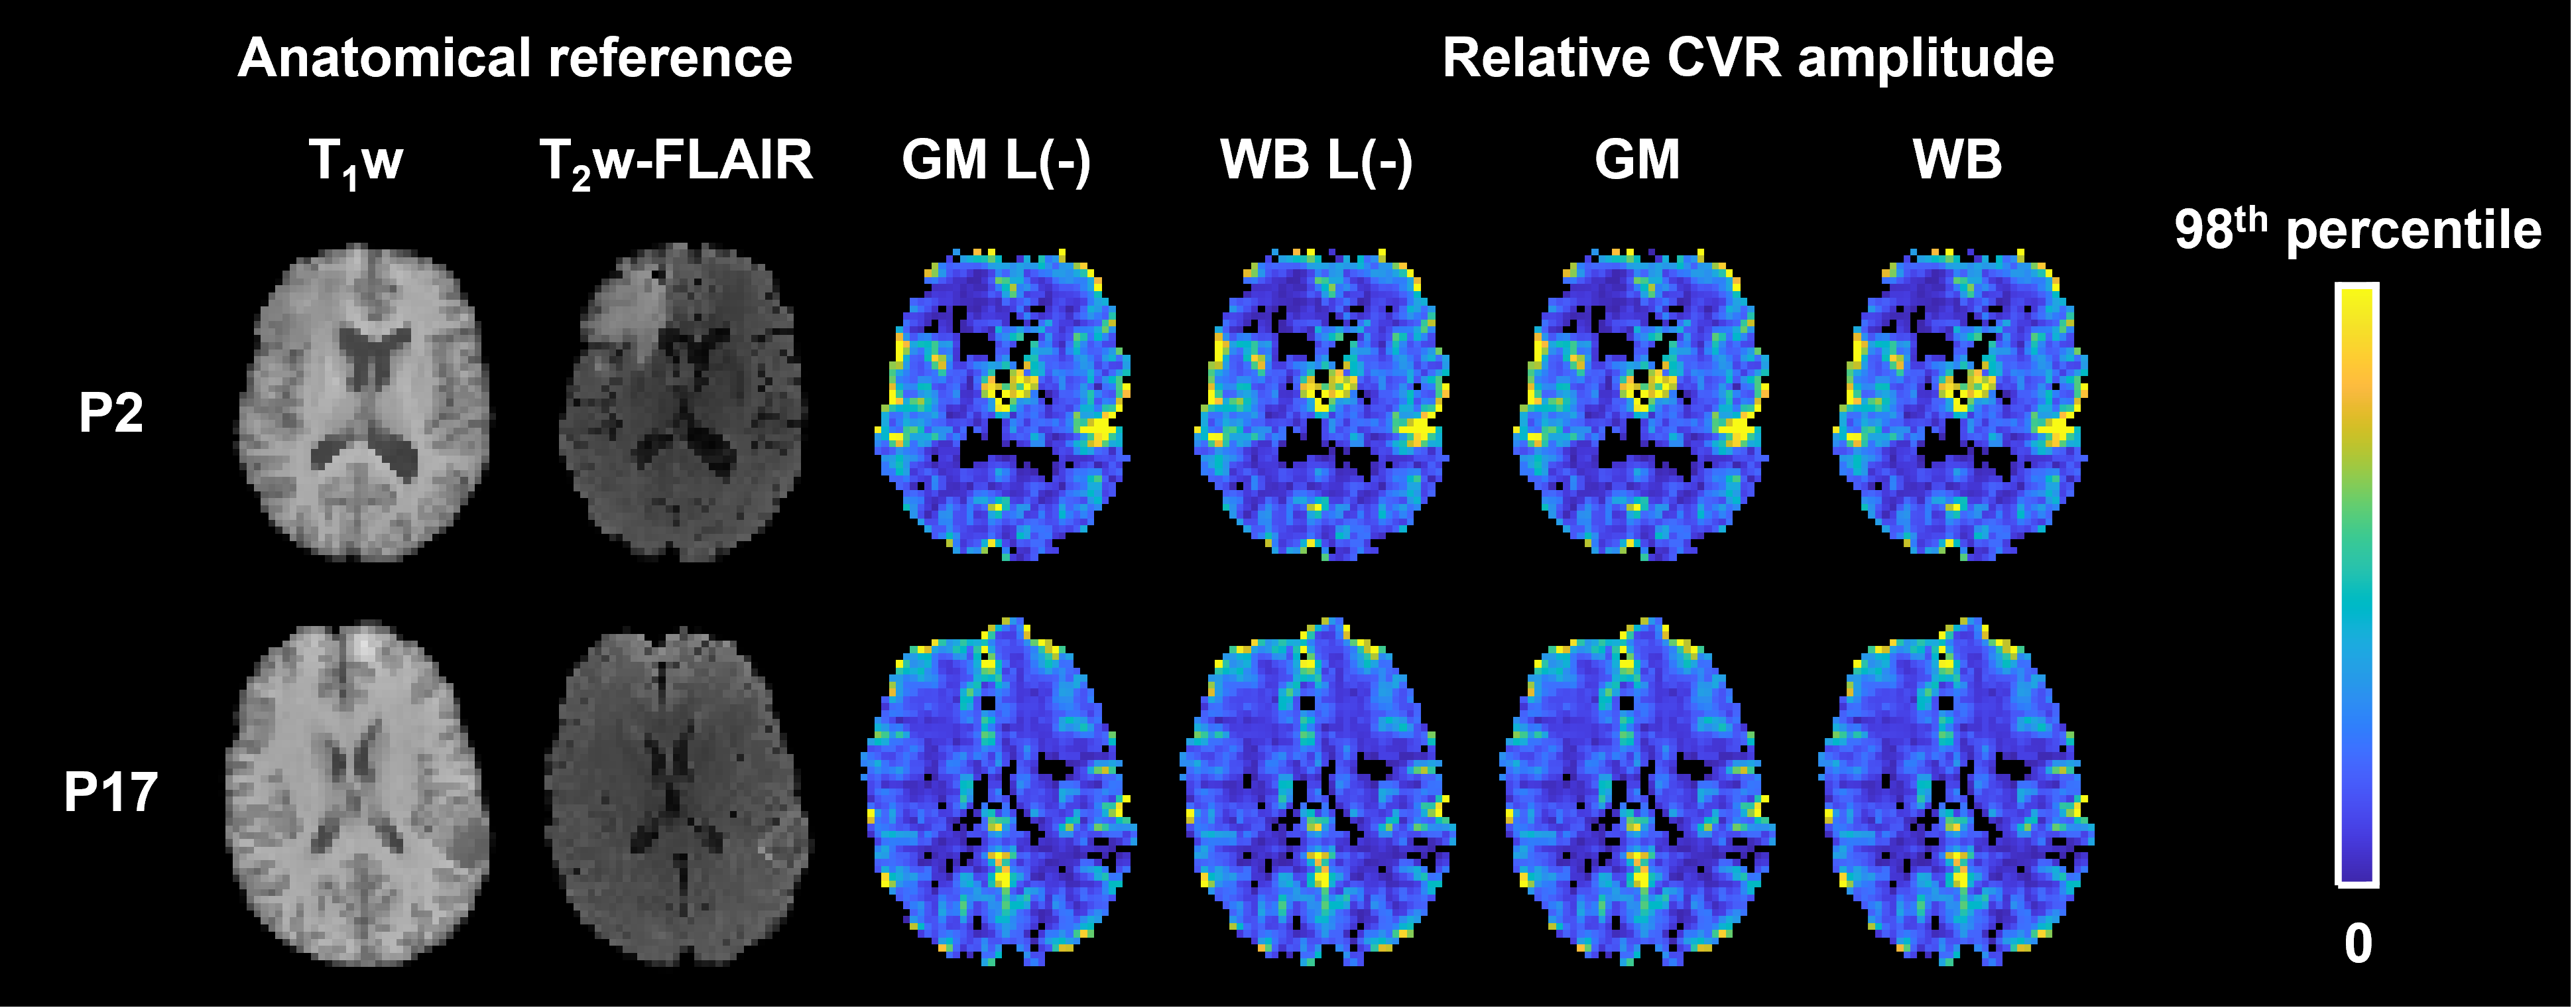
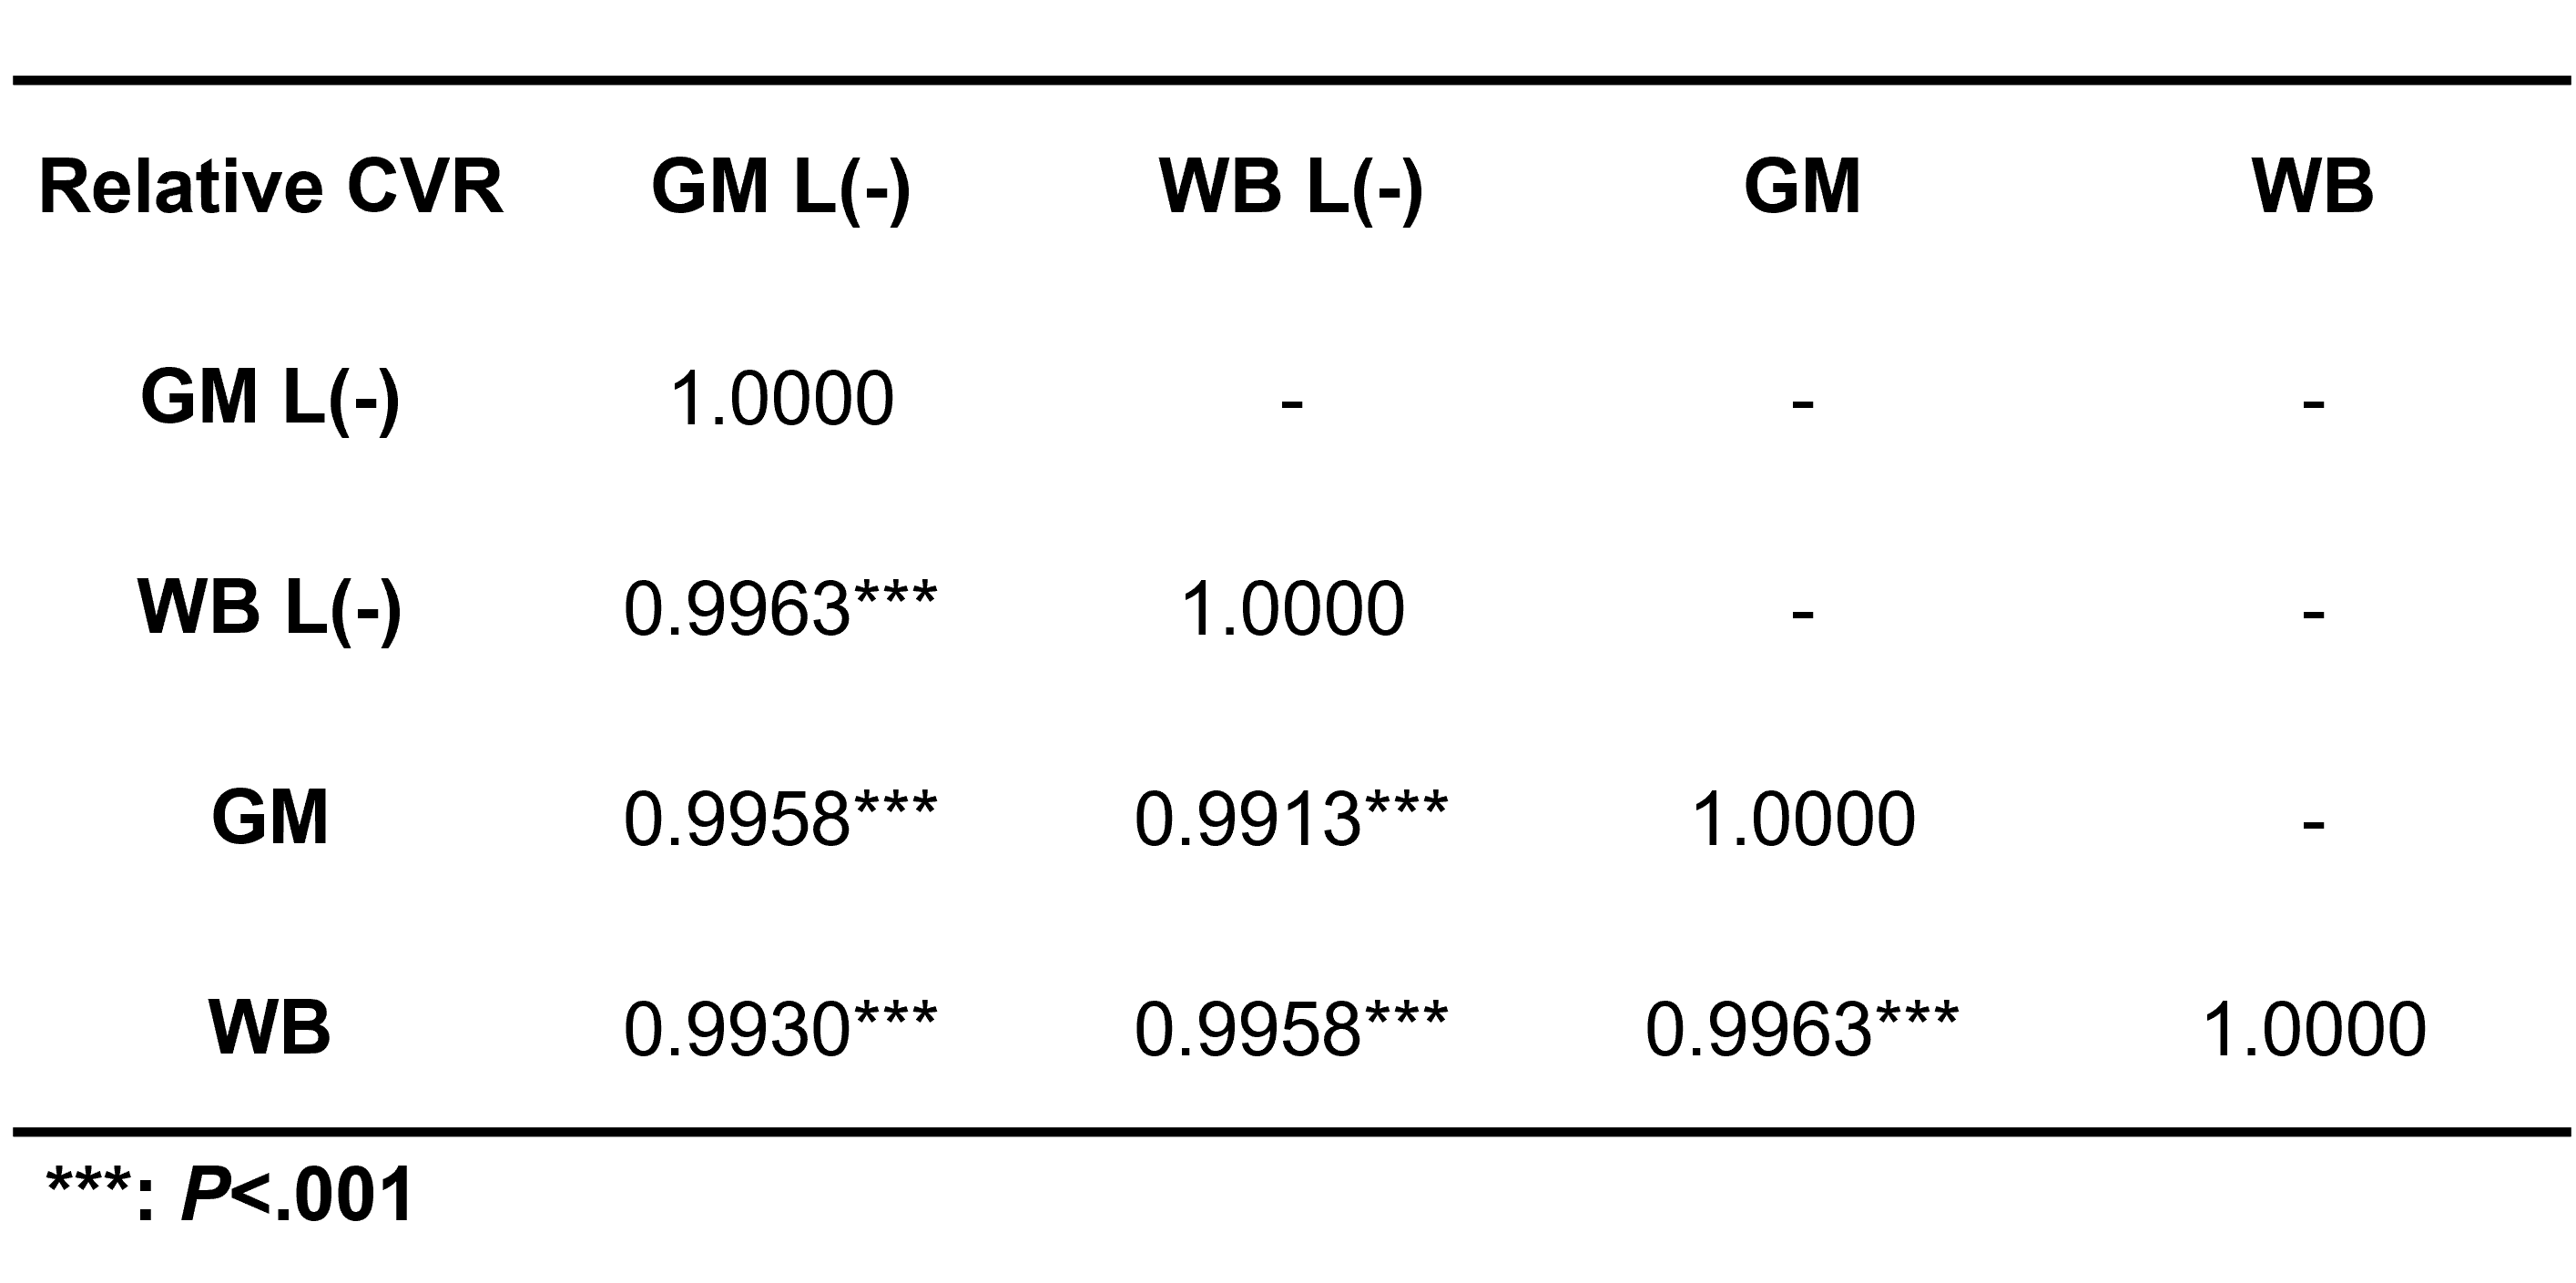
Figure 1 demonstrates the group mean normalized time courses extracted from the reference tissues. Overall, the reference curves were found to have similar appearances of temporal BOLD response when extracted from different reference tissues. Minor variations were found in signal time curves before spatial and temporal smoothing, whereas the differences were minimized with the processing steps. This implies that a properly handled processing pipeline could reduce the dependency on sources of errors, such as lesion inclusion and misalignment.Figure 2 shows the four sets of CVR maps that reported low relative CVR in brain tumors. The relative CVR maps indicated negligible differences between the image contrast. The pairwise correlation (Table 1) showed significant correlations (P<.001) between the relative CVR amplitudes generated with the choice of reference signals. The inclusion of the lesion did not alternate the overall appearance of the relative CVR maps. Note that WB masks were derived without information from a separate image. This suggested the feasibility of measuring relative CVR with a data-driven approach when anatomical information is unavailable.
Discussion
This study provided insight into the robustness of relative CVR mapping derived from reference tissue signals when lesions are present. Our results suggested relative CVR mapping can be acquired without additional prior knowledge of anatomical references, respiratory recordings, or end-tidal CO2. The current approach provided a relative measure to identify the overall appearance of CVR contrast. One potential drawback is that using WB reference signals may degrade the accuracy of detected lag time. While the current findings suggested limited differences from the choice of reference signals, the results may be compromised by partial volume blurring and temporal aliasing from the clinical acquisition.Acknowledgements
No acknowledgement found.References
[1] Yeh MY, et al., Cerebrovascular Reactivity Mapping Using Resting-State Functional MRI in Patients With Gliomas, J Magn Reson Imaging., 2022.
[2] Liu P, et al., Cerebrovascular reactivity mapping without gas challenges, NeuroImage, 2017
[3] Zvolanek KM, et al., Comparing end-tidal CO2, respiration volume per time (RVT), and average gray matter signal for mapping cerebrovascular reactivity amplitude and delay with breath-hold task BOLD fMRI, NeuroImage, 2023.
[4] Bhogal AA, Medullary vein architecture modulates the white matter BOLD cerebrovascular reactivity signal response to CO2: observations from high-resolution T2* weighted imaging at 7T, Neuroimage, 2021.
[5] Pati S, et al., The cancer imaging phenomics toolkit (CaPTk): Technical overview, Brain, 2020.
Figures