3452
Visualization framework for voxel-wise adjacency matrices for graph-theorical based analysis methods on fMRI data1Oncology-Pathology, Karolinska Institute, Stockholm, Sweden, 2Medical Radiation Physics and Nuclear Medicine, Karolinska University Hospital, Stockholm, Sweden, 3Clinical Sciences, Intervention and Technology, Karolinska Institute, Stockholm, Sweden
Synopsis
Keywords: fMRI Analysis, Visualization
Motivation: Graph-theoretical methods to analyze fMRI data can be powerful and flexible. Common to such methods is the construction of a graph adjacency matrix, which cannot be intuitively understood when visualized in itself.
Goal(s): We aim to develop a framework to visualize adjacency matrices intuitively while retaining intuitive spatial localizability in relation to the brain.
Approach: By stratify voxel-wise functional connectivity adjacency matrices through agglomerative clustering to form edge bundles, we 3D-render them with their end-point locations in a brain contour to ease localization.
Results: 3D rendered, color-coded, edge bundles and their end-points can be distinctly identified in relationship to the brain.
Impact: Our visualization framework allows both scientist and clinicians to employ graph theoretical analysis methods on fMRI data in a intuitive manner while retaining spatial localizability in the brain.
Introduction
Network-based analysis methods for functional connectivity on functional MRI data typically operate on nodes rather than edges[1]. Also, dimensionality reduction through stratifying the data into functional regions, or ROIs, according to functional atlases is done prior to network construction to ease computation load[2].There are two main issues with this type of approach: Firstly, since there is currently no atlas that is perfect for every occasion. The entire analysis pipeline will be biased towards the bias of the atlas chosen. Furthermore, implicitly stratifying data into a chosen functional atlas weakens the data-driven aspect of the analysis. Second, the definition of functional connectivity is most natural when defined between nodes, whether they represent voxels, ROIs, or brain regions. Allocating functional connectivity values to single nodes is not entirely intuitive, and enforcing this invariably leads to diminished intuitive meaning, and explicit information is lost.
Typically, functional connectivity measures and their values are associated to a spatial location, either assigned to individual voxels or ROIs (groups of voxels). This is done to facilitate interpretability of visualizations of analysis results since connectivity matrices and none spatially specific graph visualization methods such as node-ring may be difficult to interpret intuitively as they lack spatial coordination. Graph visualization methods such as node-links, which feature spatial localization are easily overwhelmed visually by excessive number of nodes are connections.
We aim to develop an analysis pipeline that tackles these issues. The proposed pipeline will be completely data-driven without the need to stratify data prior into ROIs using functional atlases, instead opting for voxel-based analysis, and will use functional connectivity measures solely as defined as values between pairs of voxels.
Methods
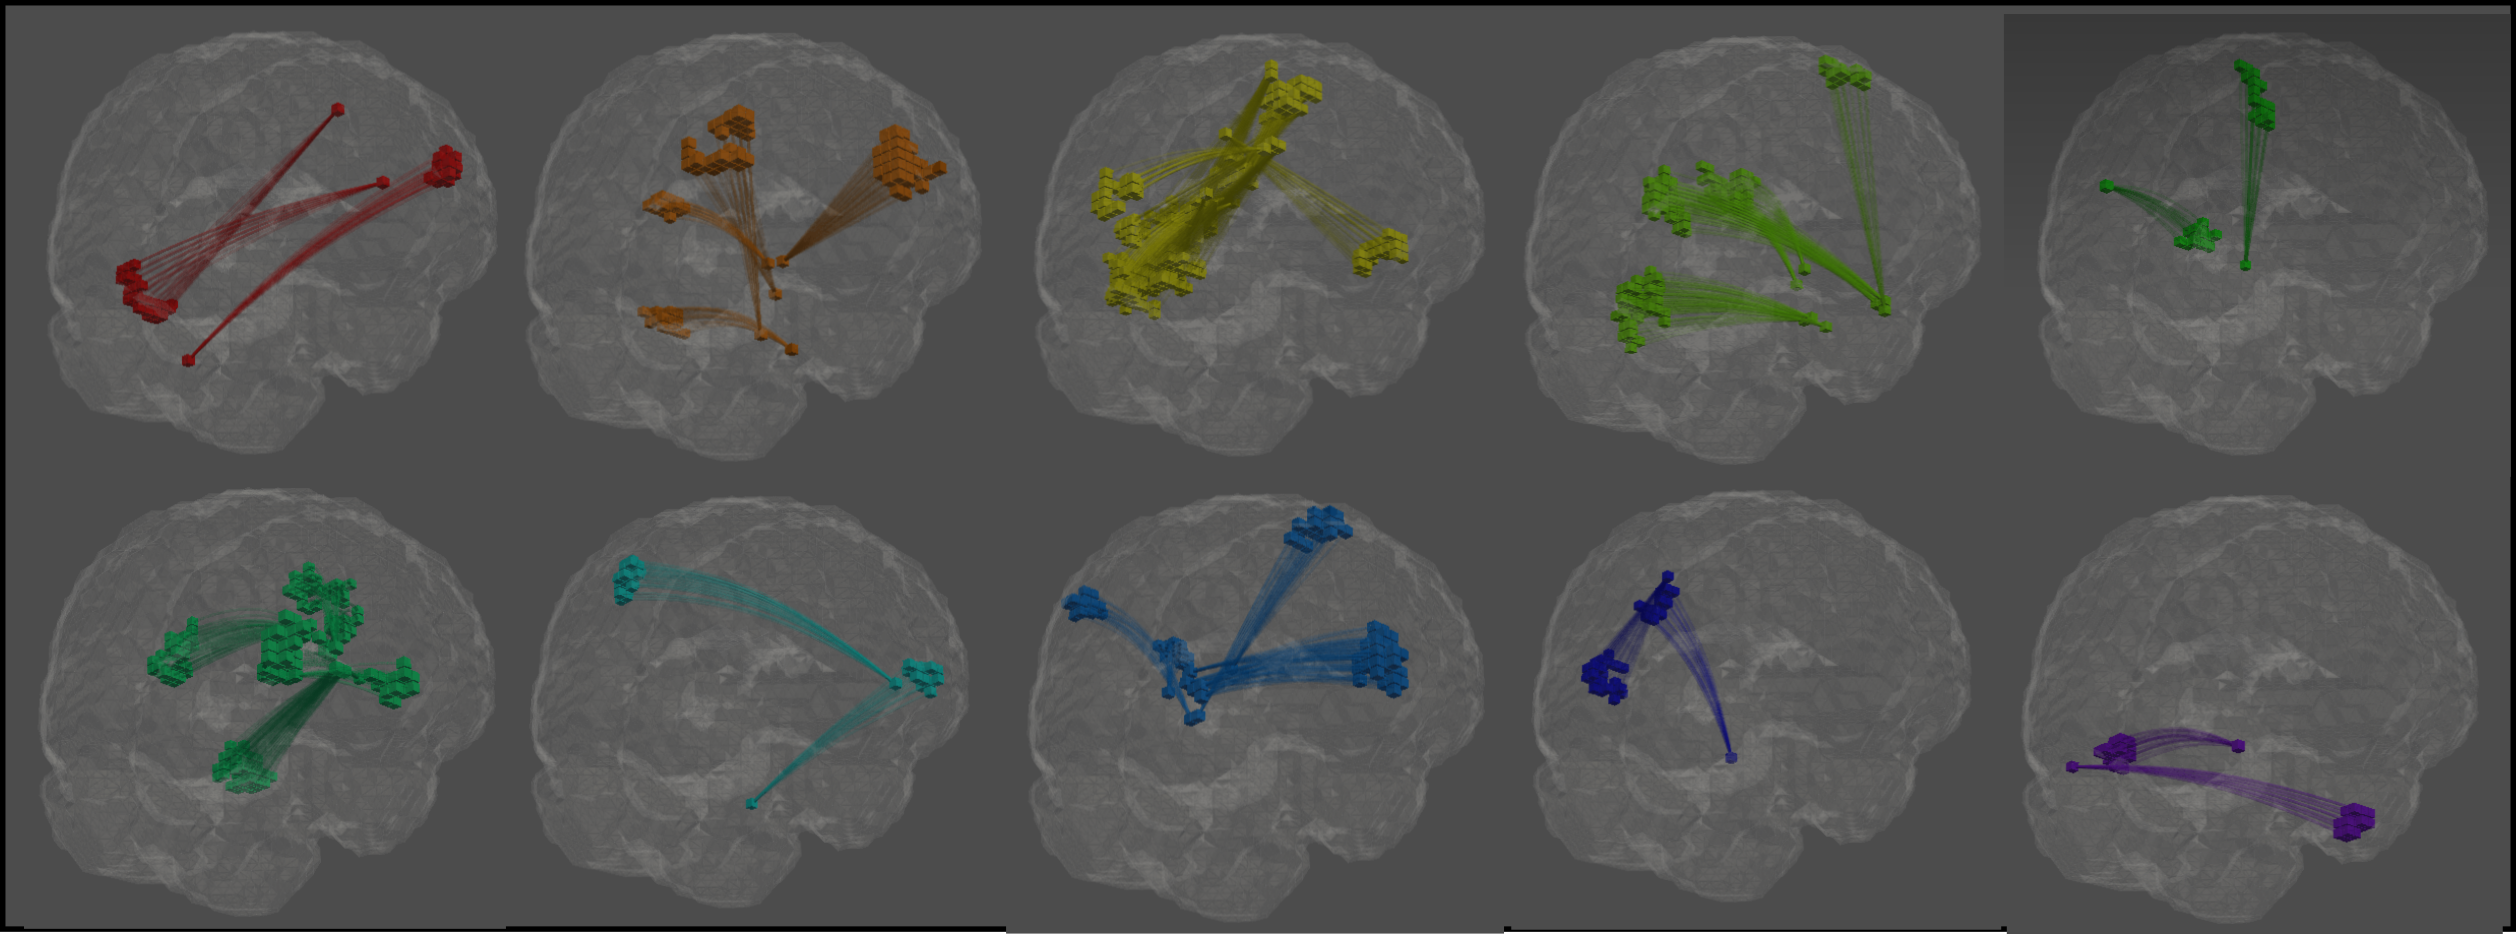
As a proof-of-concept, a previously acquired dataset was used to generate a preliminary voxel-wise functional connectivity matrix group statistic. Resting-state fMRI data were acquired for 25 subjects, two sessions each, once with 2mg Haloperidol and another with placebo ingested prior to scanning. After preprocessing, voxel-wise correlation matrices were calculated for each dataset and for each element in the correlation matrix t-tests were made between placebo and drug groups and the 1% highest t-scores were kept as significant differences between the groups and binarized to act as significant differences between the groups in functional connectivity. First, we stratify connections into connection bundles using complete-linkage agglomerative clustering. The distance between edges is defined as the maximum distance between any endpoint of one edge to any endpoint of the other (max-min metric). 2) Stratify connection bundles into functional connectivity networks by applying agglomerative clustering again using distance (between bundles) as the minimum distance between any edge in a bundle with any edge in another bundle. Strategies to determine optimal cut levels are discussed in the Discussion section. Clustered results are rendered using pyvista visualization framework[3] creating a 3D render of the brain and connections are visualized as colored arcs between endpoints. The different connection bundles may be color-coded and visualized all at once, or individual functional connectivity networks visualized separately to avoid overflowing of information and facilitate endpoint localization in the brain.Results
Visualization of the clustered fiber bundles as functional connectivity network stratification is shown in Fig. 1. Rotating the 3d render allows easy spatial localization of functional connectivity endpoints in relation to the brain.Discussion
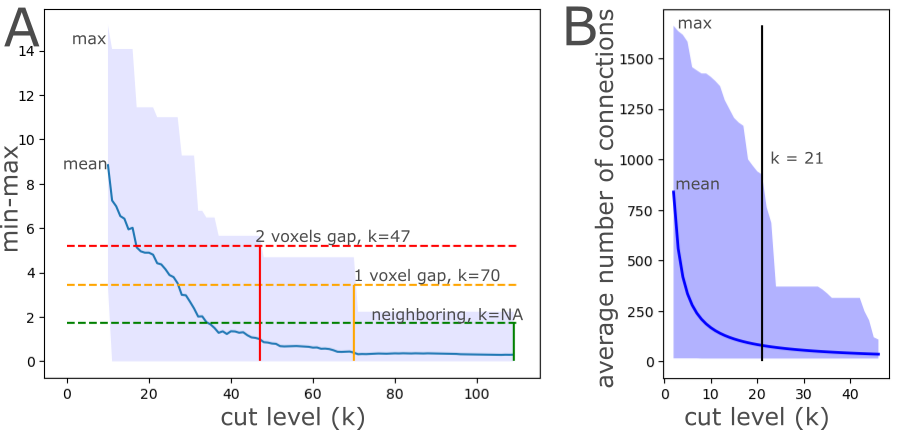
Construction of functional connectivity networks using connections bundles is not entirely free of user input since for each stage of agglomerative clustering, a cut level must be determined, which determines the number of output “clusters”.The min-max metric is a relatively intuitive term that determines whether connection endpoints are neighboring, both in spatial location and inferring similar function. Hence a cut-level at which the maximum min-max metric drops below what is “neighboring” is intuitively justifiable (Fig. 2a).
The cut-level during functional connectivity network formation at the second agglomerative clustering is not easily justifiable. In this case, the cut level is obtained from visual inspection of largest cluster size against number of output networks (Fig. 2b). This approach might not be generally applicable, or the value is not immediately obvious from post-hoc analyses. However, since dimensionality reduction through the construction of connection bundles is already performed at this stage, any statistic based on this dimensionally reduced data is considerably easier to grasp compared to individual connections, facilitating the decision-making process.
Conclusion
Our approach to visualizing thresholded adjacency matrices corresponding to functional connectivity both retains the spatial specificity of voxel-wise analysis and intuitive spatial localizability of functional connectivity endpoints in relation to the brain.Acknowledgements
No acknowledgement found.References
[1] N. Chinichian et al., ‘A fast and intuitive method for calculating dynamic network reconfiguration and node flexibility’, Front. Neurosci., vol. 17, 2023, Accessed: Nov. 08, 2023. [Online]. Available: https://www.frontiersin.org/articles/10.3389/fnins.2023.1025428
[2] Z. Li et al., ‘Study of brain network alternations in non-lesional epilepsy patients by BOLD-fMRI’, Front. Neurosci., vol. 16, 2023, Accessed: Nov. 08, 2023. [Online]. Available: https://www.frontiersin.org/articles/10.3389/fnins.2022.1031163
[3] C. B. Sullivan and A. A. Kaszynski, ‘PyVista: 3D plotting and mesh analysis through a streamlined interface for the Visualization Toolkit (VTK)’, J. Open Source Softw., vol. 4, no. 37, p. 1450, May 2019, doi: 10.21105/joss.01450.
Figures