3450
Human Resting-State Complexity of BOLD fMRI in Ultra-High-Field MRI at 7T: a primer1Translational Research Center, University Hospital of Psychiatry and Psychotherapy, University of Bern, Bern, Switzerland, Bern 60, Switzerland, 2Laboratory of FMRI Technology, USC Stevens Neuroimaging and Informatics Institute, University of Southern California, Keck School of Medicine, Los Angeles, California, USA, Los Angeles, CA, United States, 3Clinic Suedhang, Kirchlindach, Switzerland, Kirchlindach, Switzerland, 4Department of Neurosurgery, University Hospital of Zurich, Zurich, Switzerland, Zürich, Switzerland
Synopsis
Keywords: fMRI Analysis, fMRI (resting state), complexity
Motivation: BOLD-fMRI intrinsic functional connectivity has limited capability to assess the temporal dynamics of complex brain networks. The insufficient signal-to-noise ratio of 3T MRI might prevent the detection of subtle alterations.
Goal(s): Detecting resting-state complexity alterations in healthy subsamples using 7T MRI.
Approach: Multiscale entropy was computed for ten scales from 0.1 to 1 Hz. A whole-brain ANCOVA was conducted to assess entropy differences of the scales between 30 healthy adults with spider phobia and 45 without.
Results: Spider phobia showed decreased entropy in several fear-related brain regions in all scales except 1 Hz.
Impact: 7T fMRI detected reduced high-frequency resting-state multiscale entropy related to spider phobia, indicating worse local processing of fear and memory-related brain regions.
Introduction
Intrinsic functional connectivity (iFC) derived from BOLD-fMRI data is still widely used to map the brain’s functional architecture at rest. Despite the substantial insight gained into diseased brain networks and corroborated markers for cognitive symptomatology, the method’s major shortcoming, one correlative metric over the entire scanning time, fails at characterizing the temporal dynamics of complex brain systems. Recently, multiscale entropy (MSE) analyses of resting-state BOLD fMRI signals have gained increased attention in basic and clinical neuroscience. MSE detects self-similarity of complex signals across multiple time scales in a random noise environment1. The MSE’s main advantage is that it can assess alterations and interactions of neuronal circuits on spatial and temporal scales. Hence, numerous studies have yielded novel insights into temporal dynamics of the brain’s functional reorganization2-4. Both iFC and MSE rely on a sufficient temporal and spatial signal-to-noise ratio (SNR) of the data. With advances in image processing algorithms, and especially with the availability of 7T MRI, images with increased SNR allow the detection of more subtle effects5,6. Hence, this study explored the MSE of a set of 7T BOLD-fMRI data that consisted of healthy participants, who were subdivided into a spider phobia (PH) and a control group (HC) sample. The rationale was to test whether MSE at 7T is sufficiently sensitive to detect MSE differences between these groups even though no spider images, the fear-triggering stimulus defining spider phobia, were shown during data acquisition. Nevertheless, assuming a hyperactive fear circuit in PH, we hypothesized decreased local processing complexity as measured with high-frequency MSE in brain regions involving the amygdala, hippocampus, parahippocampus, medial temporal lobe, fusiform gyrus, and anterior cingulate cortex7.Methods
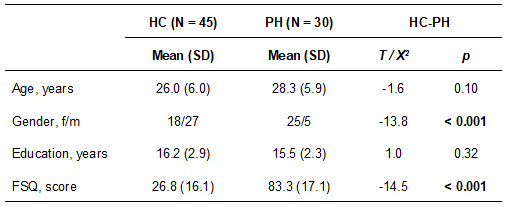
Study participant demographics and statistics are depicted in Figure 1. Resting-state fMRI data was obtained with a 32-channel head/neck coil in a Siemens Magnetom Terra 7T machine at the University Hospital Bern. A multiband echo-planar protocol with 360 measurements, 60 slices, TR/TE = 1000/25 ms, and iso-voxel size = 2 mm3 was applied. Image preprocessing included motion-realignment, slice-time correction, detrending, denoising, normalization, and 3-mm-smoothing. MSE was computed using the LOFT Complexity Toolbox8 with pattern matching threshold r = 0.2, pattern length = 2, scales = 1 – 10 (1 – 0.1 Hz)9-11. All images were masked with a mean grey matter mask of all subjects. Voxel-wise statistics were computed in SPM12 and comprised an ANCOVA with factors scale (1 – 10) and diagnosis (HC, PH), and age as a covariate. The significance threshold was pFWE < 0.05 and a cluster-size threshold of 5 voxels. Significant clusters were overlaid with the aal atlas12-14 and segmented accordingly for a post-hoc ROI analysis, a non-parametric ANOVA investigating mean ROI entropy for each scale between the diagnosis groups.Results
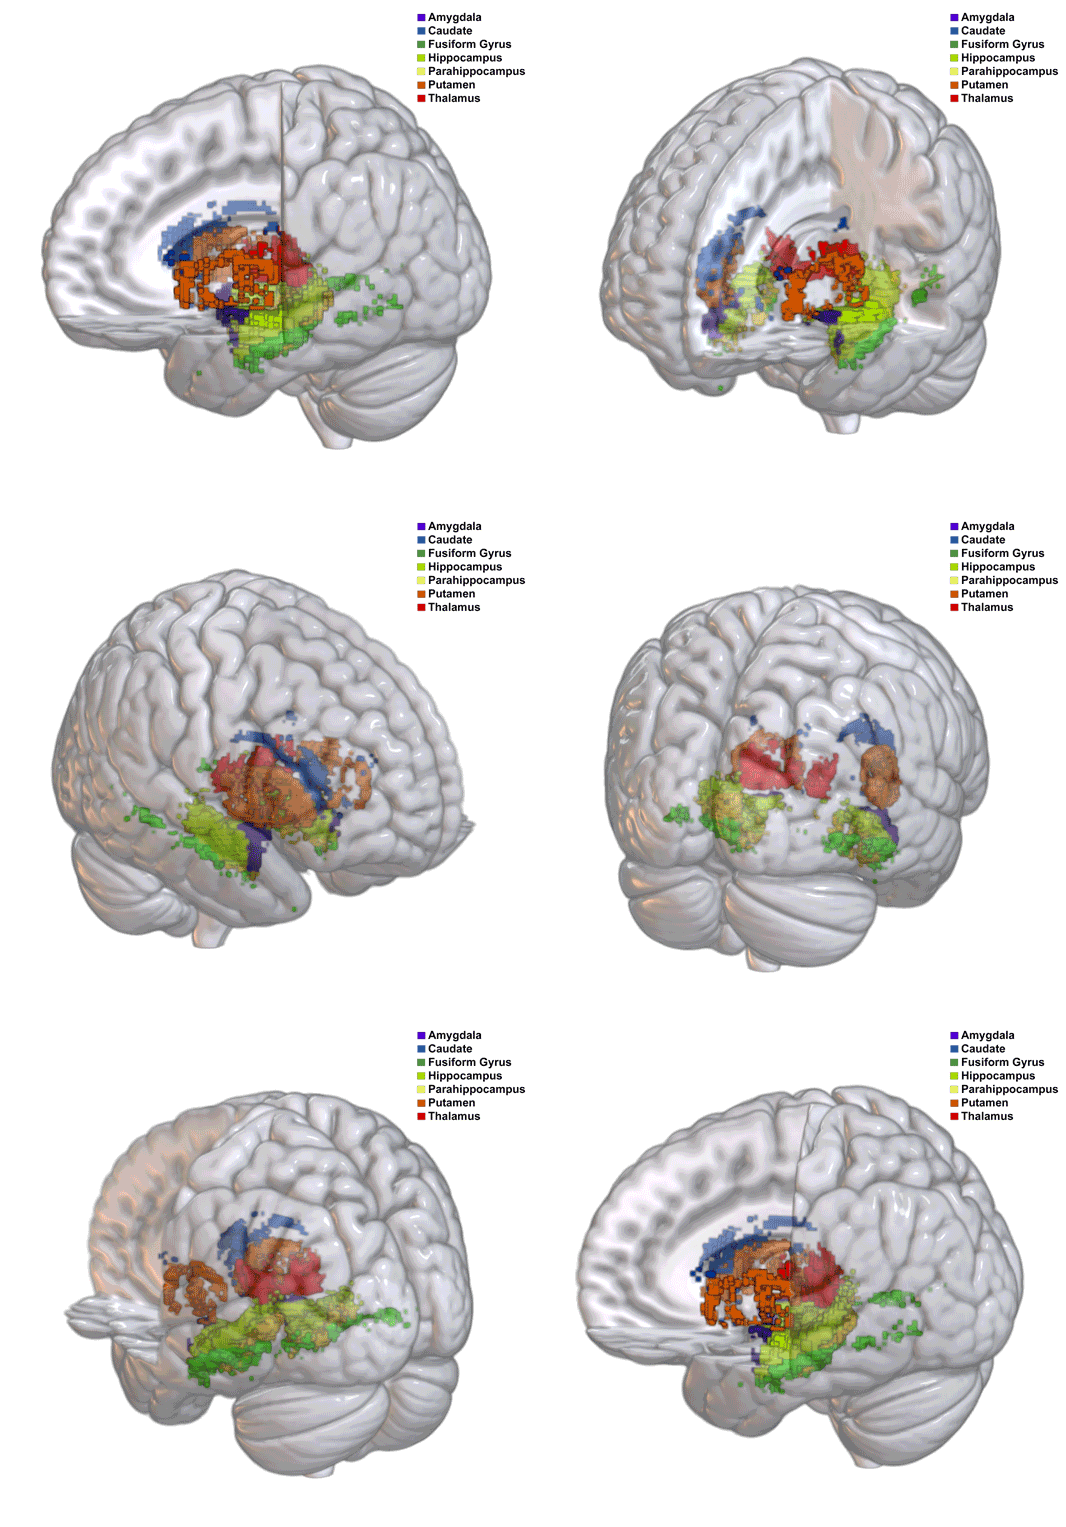

The voxel-wise interaction of the 2 × 10 ANCOVA revealed several significant clusters (F9,729 = 5.49, pFWE = 0.05, cluster-size threshold = 5 voxels), which were subdivided into seven major regions of interest (ROIs): amygdala, caudate nucleus, fusiform gyrus, hippocampus, parahippocampus, putamen, and thalamus (Figure 2). To disentangle the two-way interaction involving these ROIs, the post-hoc ANOVA revealed the main effects of diagnosis (F1 = 5.26, p = 0.02), ROI (F3.8 = 20.0, p < 0.0001), and scale (F1.5 = 114.8, p < 0.0001, see Figure 3). Merely the scale × ROI two-way interaction was significant (F14 = 5.0, p < 0.0001). Note that the three-way interaction diagnosis × ROI × scale was not significant.Discussion
This proof-of-concept study revealed reduced entropy in anxiety, memory, and emotion-regulation brain regions in PH compared to HC. Most brain regions with decreased MSE, such as the amygdala, hippocampus, parahippocampus, and fusiform gyrus, are hyperactive in PH7. The thalamus has been linked with autonomous arousal in PH15, while the striatum, including putamen and caudate nucleus, was shown active during threat monitoring16. These MSE reductions were found in 9 of 10 frequencies (0.1 – 0.5 Hz). In the 1 Hz frequency, no group differences could be observed (Figure 3). With the scanning protocol used in this study, lower frequencies could not be assessed (i.e., < 0.1 Hz), which is a limitation and might explain the uniformity of the effects between most scales.Conclusions
MSE analysis is a promising method that takes advantage of the higher temporal SNR of 7T fMRI, as demonstrated in this study. Using MSE as an add-on to iFC measures, a more refined picture of the dynamics of complex neuronal systems can be achieved.Acknowledgements
This study was supported by the University Hospital for Psychiatry and Psychotherapy Bern, Switzerland. We thank the following contributors: Andrea Federspiel and Piotr Radojewski of the Translational Imaging Center (TIC), Swiss Institute for Translational and Entrepreneurial Medicine, Bern, Switzerland, for technical and clinical support at the MRI scanner site; Dilmini Wijesinghe of the Laboratory of FMRI Technology, USC Stevens Neuroimaging and Informatics Institute, University of Southern California, Keck School of Medicine, Los Angeles, California, USA, for providing valuable insight in fMRI complexity developments; Thomas Dierks of the Translational Research Center, University Hospital of Psychiatry and Psychotherapy, University of Bern, Switzerland, for conceptual advice.References
1. Costa M, Goldberger AL, Peng CK. Multiscale Entropy Analysis of Complex Physiologic Time Series. Phys Rev Lett. 2002;89(6):068102
2. Jann K, Boudreau J, Albrecht D, Cen SY, Cabeen RP, Ringman JM, Wang DJJ. FMRI Complexity Correlates with Tau-PET and Cognitive Decline in Late-Onset and Autosomal Dominant Alzheimer’s Disease. J Alz Dis. 2023;95(2):437-451
3. Grieder M, Wang DJJ, Dierks T, Wahlund LO, Jann K. Default Mode Network Complexity and Cognitive Decline in Mild Alzheimer’s Disease. Front Neurosci. 2018;12(770)
4. Xin X, Long S, Sun M, Gao X. The Application of Complexity Analysis in Brain Blood-Oxygen Signal. Brain Sci. 2021;11(11):1415
5. Dumoulin SO, Fracasso A, van der Zwaag W, Siero JCW, Petridou N. Ultra-high field MRI: Advancing systems neuroscience towards mesoscopic human brain function. NeuroImage. 2018;168:345-357
6. Pohmann R, Speck O, Scheffler K. Signal-to-noise ratio and MR tissue parameters in human brain imaging at 3, 7, and 9.4 tesla using current receive coil arrays. Magn Res Med. 2016;5(2):801-809
7. Soravia LM, Orosz A, Schwab S, Nakataki M, Wiest R, Federspiel A. CBT reduces CBF: cognitive-behavioral therapy reduces cerebral blood flow in fear-relevant brain regions in spider phobia. Brain Behav. 2016;6(9):e00510
8. Laboratory of Functional MRI Technology (LOFT), Department of Neurology, USC Developed by Jothi A, Sharma N, Adhikari S, Wang DJJ, Jann K
9. Li X, Zhu Z, Zhao W, Sun Y, Wen D, Xie Y, Liu X, Niu H, Han Y. Decreased resting-state brain signal complexity in patients with mild cognitive impairment and Alzheimer’s disease: a multi-scale entropy analysis. Biomed Opt Express. 2018;9(4):1916-1929
10. Smith RX, Yan L, Wang DJJ. Multiple time scale complexity analysis of resting state FMRI. Brain Imaging Behav. 2014;8:284–291
11. Sokunbi MO. Sample entropy reveals high discriminative power between young and elderly adults in short fMRI data sets. Front Neuroinform. 2014;8:69
12. Maldjian JA, Laurienti PJ, Kraft RA, Burdette JH. An automated method for neuroanatomic and cytoarchitectonic atlas-based interrogation of fMRI data sets. NeuroImage. 2003;19(3):1233-9
13. Maldjian JA, Laurienti PJ, Burdette JH. Precentral gyrus discrepancy in electronic versions of the Talairach atlas. NeuroImage. 2004;21(1):450-5
14. Tzourio-Mazoyer N, Landeau B, Papathanassiou D, Crivello F, Etard O, Delcroix N, Mazoyer B, Joliot M. Automated anatomical labeling of activations in SPM using a macroscopic anatomical parcellation of the MNI MRI single-subject brain. NeuroImage. 2002;15(1):273-89
15. Del Casale A, Ferracuti S, Rapinesi C, Serata D, Piccirilli M, Savoja V, Kotzalidis GD, Manfredi G, Angeletti G, Tatarelli R, Girardi P. Functional neuroimaging in specific phobia. Psychiatr Res Neuroimaging. 2012;202(3):181-197
16. Mobbs D, Yu R, Rowe JB, Eich H, FeldmanHall O, Dalgleish T. Neural activity associated with monitoring the oscillating threat value of a tarantula. Proc Natl Acad Sci U S A. 2010;107(47):20582-20586
Figures