3446
An Eigenmode-Based GLM Method For Task-fMRI Data Analysis1Department of Biomedical Engineering, School of Medicine, Tsinghua University, Beijing, China, 2MR Research Collaboration Team, Siemens Healthcare Ltd., Beijing, China
Synopsis
Keywords: fMRI Analysis, Data Analysis, Cortical eigenmode, GLM analysis
Motivation: In traditional fMRI experiments, the BOLD signal is influenced by the spatial distribution of veins, which is closely linked to the morphological characteristics of the cortex.
Goal(s): Cortical eigenmode decomposition represents a frequency-domain approach for analyzing brain structures, yielding a set of spatial bases for dissecting large-scale brain activities.
Approach: In this study, we introduced an eigenmode-based General Linear Model method to investigate the influence of spatial patterns on the activation of specific fMRI tasks.
Results: The results reveal a strong correlation in spatial distribution between the reconstructed z-map and the conventional activation map.
Impact: Quantitative cortical eigenmode analysis offers a frequency-domain perspective for integrating structural and functional neuroimages. Eigenmodes encode connectivity patterns within the cortical structure, offering a promising avenue for unveiling implicit connections across cortical surface through their application to brain activity analysis.
PURPOSE
Cortical eigenmodes serve as quantitative measures of brain morphology. By solving the Laplace-Beltrami equation of the cortical surface structure, the entire brain's geometry can be decomposed into a set of Fourier-like spatial bases. Previous studies have demonstrated that these eigenmodes can be employed to reconstruct large-scale spontaneous and task-related activities, highlighting the significance of the brain's geometric characteristics in elucidating neuronal dynamics [1]. Nonetheless, there remains a need for more quantitative applications of eigenmodes in analyzing neuroimages and gaining deeper insights into their role in explaining functional networks from a connectivity perspective. In this study, we present an eigenmode-based GLM analysis method for the examination of task-fMRI data and the prediction of task-related activation maps.METHODS
The MRI examination comprises high-resolution T1-MPRAGE, field-map, and two task-fMRI sessions. All subjects were presented with two block-design visual tasks: checkerboard stimuli, and contracting-and-expanding random dots. The parameters for task-fMRI are as follows: 2D GRE-EPI with simultaneous multi-slice acquisition, TR=1000ms, TE=35ms, flip angle=52°, 72 slices, slice thickness=2.0mm, SMS factor=8, FOV=208×208 mm2, matrix=104×104. All data were collected using a MAGNETOM Prisma 3T MR scanner (Siemens Healthcare, Erlangen, Germany) with a 64-channel head-neck coil.The preprocessing steps for T1 images included: 1) surface reconstruction (Freesurfer), 2) solving Laplace-Beltrami equation of the pial surface to obtain the top 200 eigenmodes (lapy package).The preprocessing steps for task-fMRI images involved: 1) slice-timing correction, 2) motion correction, 3) fieldmap correction, 4) projecting the volumetric data from individual's native voxel space to their individualized pial surface space. For each subject, we first conducted conventional GLM analysis and computed the contrast of 'stimuli-rest,' resulting in a transformed z-score map (z-map). These volumetric z-maps were then projected onto the individualized surface as ground truth for comparison with our eigenmode-based results. Secondly, the functional time-series were decomposed into each eigenmode to obtain coefficients for each eigenmode at each time-frame. This was achieved by solving the pseudo-inverse of eigenmode matrix and then multiplying the pseudo-inverse matrix with the functional data matrix. This yielded a coefficient matrix with a size of eigenmode number times timeframe number. Thirdly, coefficients' GLM analysis was conducted using the same design matrix and t-test parameters as used in the conventional GLM. This produced 200 z-scores in all, after which a set of significant contributive eigenmodes were selected. Reconstructed z-maps were then calculated by reconstructing the surface-based timeseries using selected or all eigenmodes and conducting a surface-based GLM.RESULTS
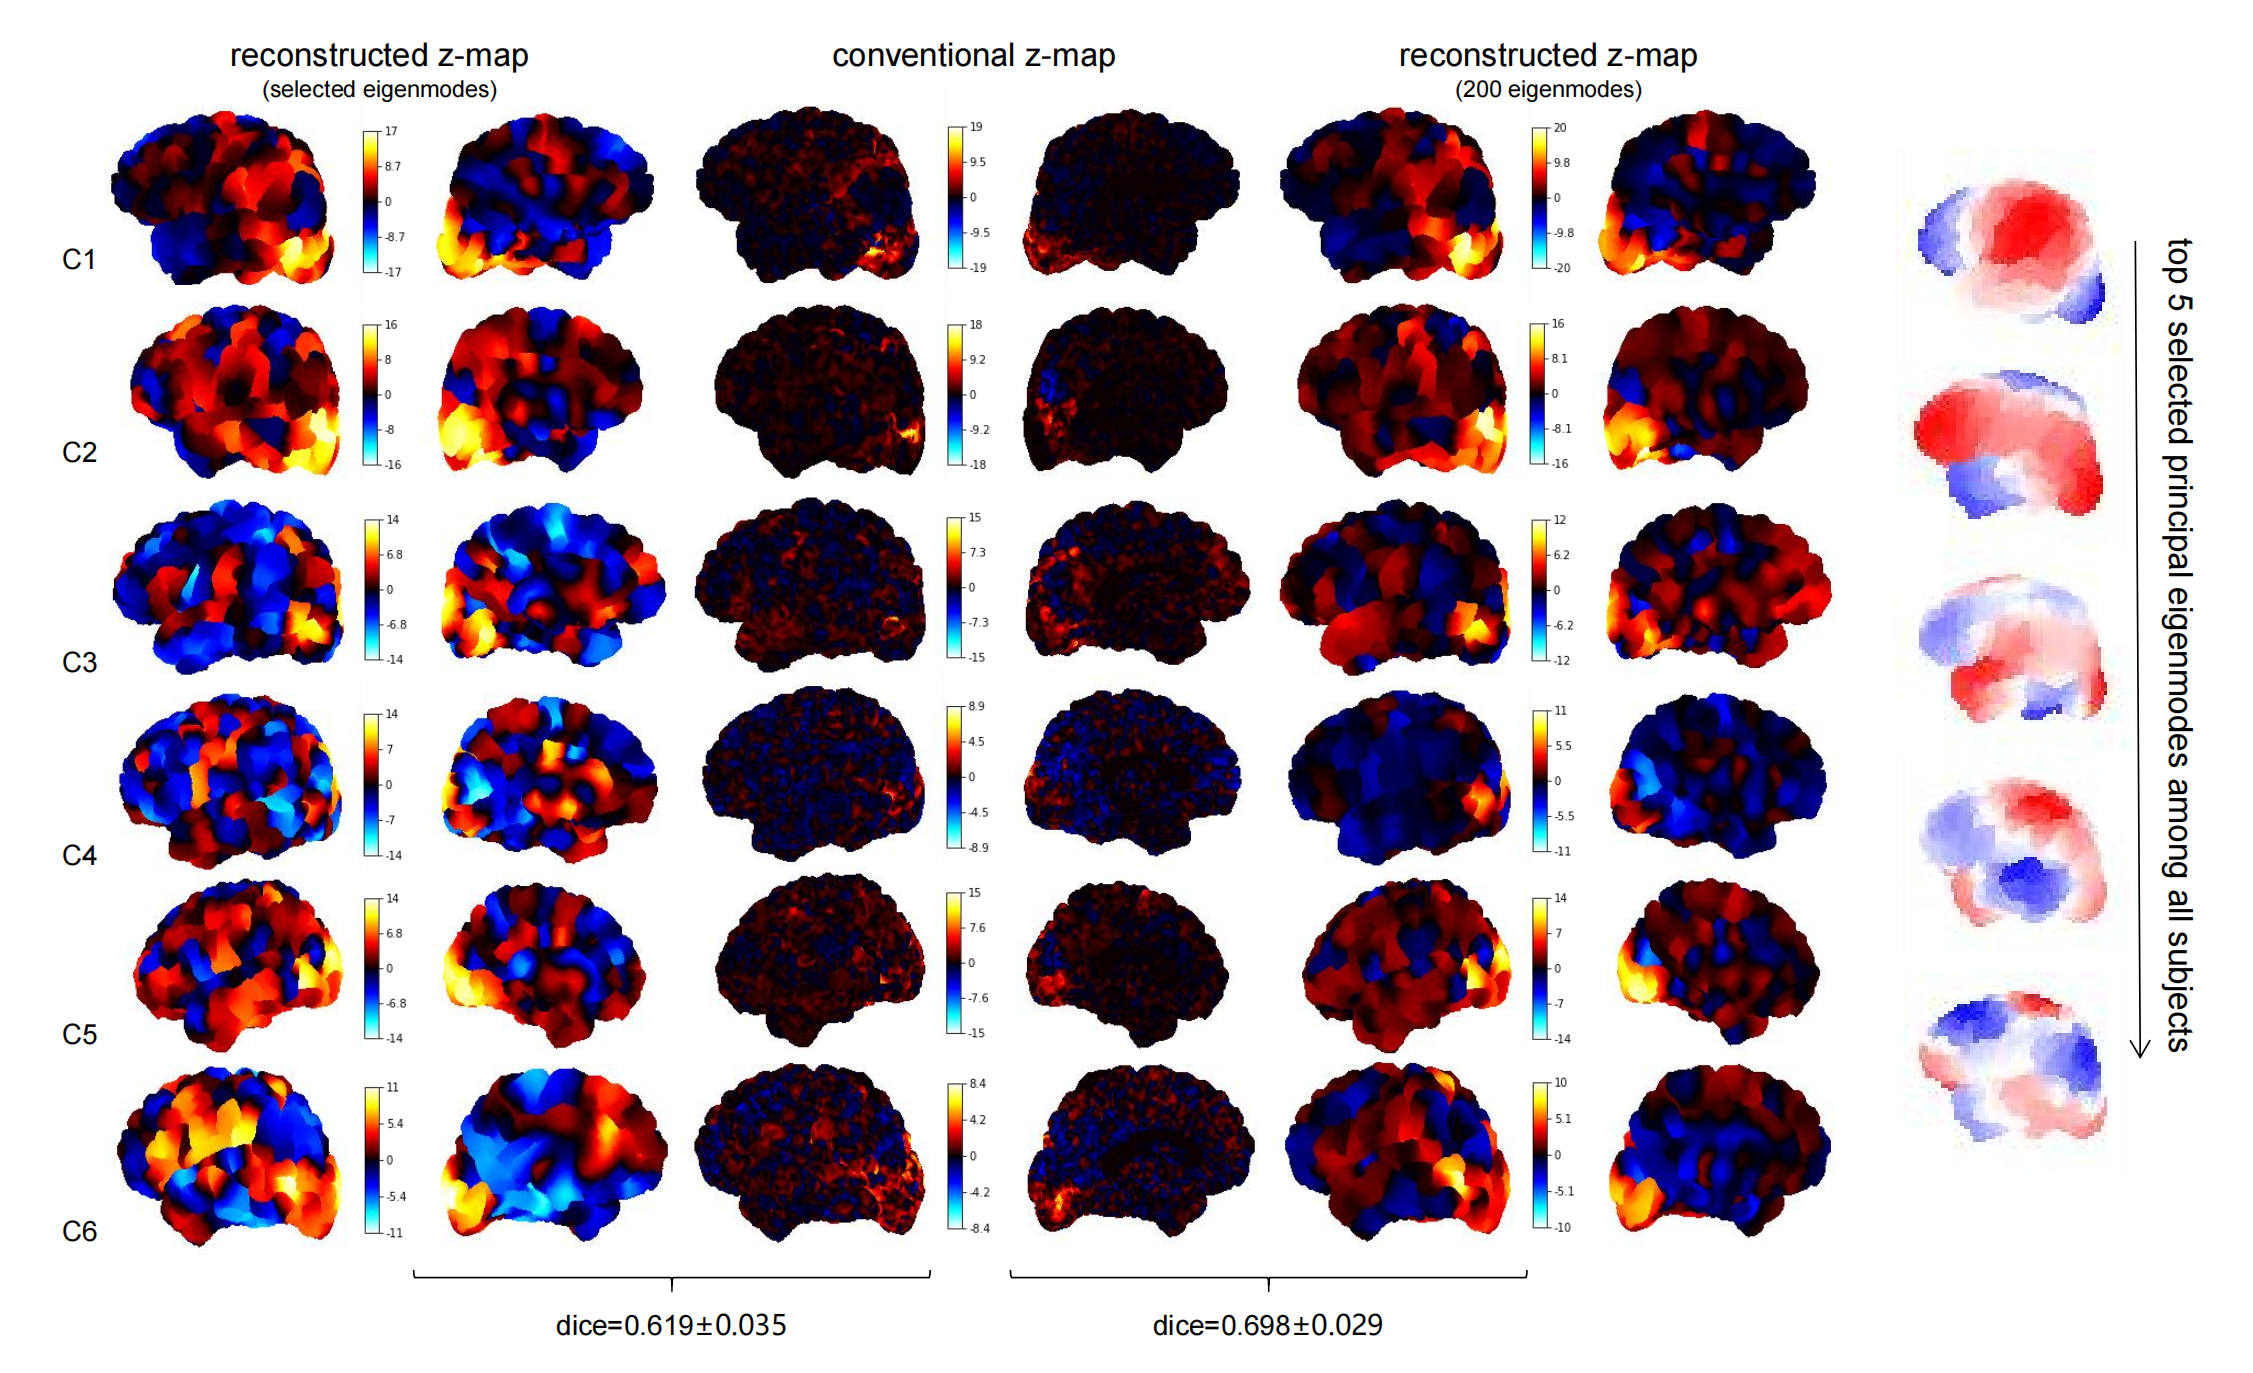
Our eigenmode-based GLM method generated consistent z-map results with the conventional GLM method. By visual inspection, reconstructed z-maps using both GLM-selected eigenmodes (Figure 1. Left 2 columns) and the total 200 eigenmodes (Figure 1. Right 2 columns) showed activated ROIs at the primary visual cortex and the middle temporal cortex, which was expected according to the visual tasks. We estimated the dice coefficient for each pair of reconstructed and conventional z-maps (Figure 1. Middle 2 columns). The mean dice coefficient between selected reconstructed z-map and the conventional z-map across subjects was 0.619±0.035, and between total reconstructed z-map and the conventional z-map across subjects it was 0.698±0.029. The dice coefficients showed a high similarity between the z-maps from the eigenmode-based and the conventional ones. Furthermore, we detected a specific set of spatial eigenmodes that contributed to the visual ROIs across all subjects. Top 5 principal eigenmode are listed (Figure 1. right), most of which showed an integral subregion at the occipital lobe. These eigenmodes not only explained the activation of the primary visual cortex and the middle temporal cortex, but also accounts for the extra activated areas in those reconstructed z-maps. This may indicate an intrinsic connection between the frontal and the occipital lobes.DISCUSSION
Previous eigenmode studies have focused on validating the capability of eigenmode decomposition to effectively explain data. The method proposed in this paper introduces a quantitative approach to analyze data using eigenmodes, addressing the limitations in their practical applications. Traditional activation maps based on BOLD-fMRI are influenced by various factors, leading to issues such as poor reproducibility, unstable spatial distribution of results, and a lack of well-defined boundaries. Reconstructing functional areas based on structural characteristics of the brain's gray matter cortex offers higher reproducibility. Additionally, the results of reconstructing structural activation areas based on the spatial features of the cortex provide a new perspective on the influence of vein distribution in BOLD-fMRI experimental results.CONCLUSION
Eigenmode-based GLM analysis can be used to predict task-related activation. It exhibits excellent consistency with the z-maps generated through traditional GLM methods. Additionally, eigenmodes contributing to the activation areas, selected from different subjects performing the same task, also demonstrate consistency.Acknowledgements
No acknowledgement found.References
[1] Pang, James C., et al. "Geometric constraints on human brain function." Nature (2023): 1-9.Figures