3444
Shift-invariant linearity and spatial variation of the negative BOLD response in human with high spatiotemporal functional MRI1Neurosurgery, The Unversity of Texas Health Science Center at Houston, Houston, TX, United States, 2Neuroscience, Baylor College of Medicine, Houston, TX, United States
Synopsis
Keywords: fMRI Analysis, fMRI (task based), neurovascular coupling, negative BOLD response, neural suppression
Motivation: Many fMRI studies have observed a negative BOLD response (NBR) that is often associated with neural suppression. However, the temporal dynamics of the NBR remains unclear.
Goal(s): Here, we investigate temporal linearity of the NBR and characterize spatial variations of the BOLD negative hemodynamic response function (nHRF) along cortical surface.
Approach: We examine temporal linearity of the NBR with a unilateral visual stimulus with various stimulus durations, then use the same stimulus with 2-s duration for spatial variation of nHRF.
Results: We found unique nHRF dynamics varying gradually along cortical surface, and non-linear behavior of the NBR with different stimulus duration.
Impact: The unique dynamics of the NBR can confound linear analyses of event-related fMRI experiments. In addition, our results with shift-invariant experiments with different stimulus durations suggest that temporal linearity does not hold for the NBR.
Introduction
The negative blood oxygen level dependent (BOLD) response (NBR), decrease BOLD signal, has been often observed in regions adjacent to positive BOLD response (PBR) as well as ipsilateral to unilateral stimulus in task-based function MRI experiments. Although the NBR is often assumed as consequence of neural suppression, it is still controversial its origin. In addition, the NBR is often assumed as an upside-down version of the PBR enabling usage of linearity assumption for the NBR like the PBR. However, its temporal characteristics including shift invariance linearity has not been fully investigated. Here, we test 1) shift-invariant linearity of the NBR comparing with the corresponding PBR and 2) spatial variation of the NBR along the cortical surface.Methods
We obtain a 0.7-mm iso-voxel volume reference anatomy for each subject using an MP-RAGE sequence: 2600-ms TR; minimum TE; 900-ms TI; 256 slices; 220-mm FOV; 8° flip angle. This volume is segmented using the high-resolution approach1 of the FreeSurfer software suite to delineate gray and white matter. We obtained high-resolution functional images using SMS-accelerated echo-planar imaging (EPI) sequence at 7T with 1.2-mm iso-voxel with 1.25-s TR, GRAPPA = 3, SMS = 2, and 28-ms TE. 40 quasi-coronal slices were obtained to cover primary visual cortex. Quasi-coronal slice orientation permitted the small FOV without need for outer-volume suppression. For each voxel, we calculate contrast-to-noise ratio (CNR) as the ratio of the peak amplitude to its standard error across trials. To permit satisfactory analysis, we choose voxels with CNR ≥ 3. Both PBR and NBR are obtained by spatially averaging the responses in this subset of voxels, and temporally averaging over the many stimulus events. To minimize partial volume effects, depth-averaged BOLD responses are obtained only from voxels located entirely in the gray matter.Stimulus consists of a color-changing fixation dot, and a unilateral sector subdivided into five subsectors with an eccentricity of 1–3° that covers a polar angle from 40–140° (right hemifield) on a mean-gray screen. Each subsector contains a high-contrast grating (spatial frequency 1 cpd) that reverses contrast at 4 Hz. For the negative hemodynamic response function (nHRF) experiments, the main task is a 2-s duration contrast-decrement detection. During each trial, there is a 50% chance that one of the five wedges has a lower contrast than the others. While maintaining fixation throughout, subjects have to specify if there is a contrast decrement in one of the subsectors of the stimulus by pressing a one of two buttons. To examine shift-invariant linearity, we obtain NBR measurements evoked by different stimulus durations (2, 4 and 12 s). To maintain subject attention on the task without adaptation effects, we have consecutive tasks (each task lasting 1.7 s followed by a 0.3-s blank period for a response) based on stimulus duration (e.g., 6 consecutive tasks for 12-s stimulus). We then align six measured nHRFs in a row and superpose them to predict the NBR with 12-s stimulus.
Results
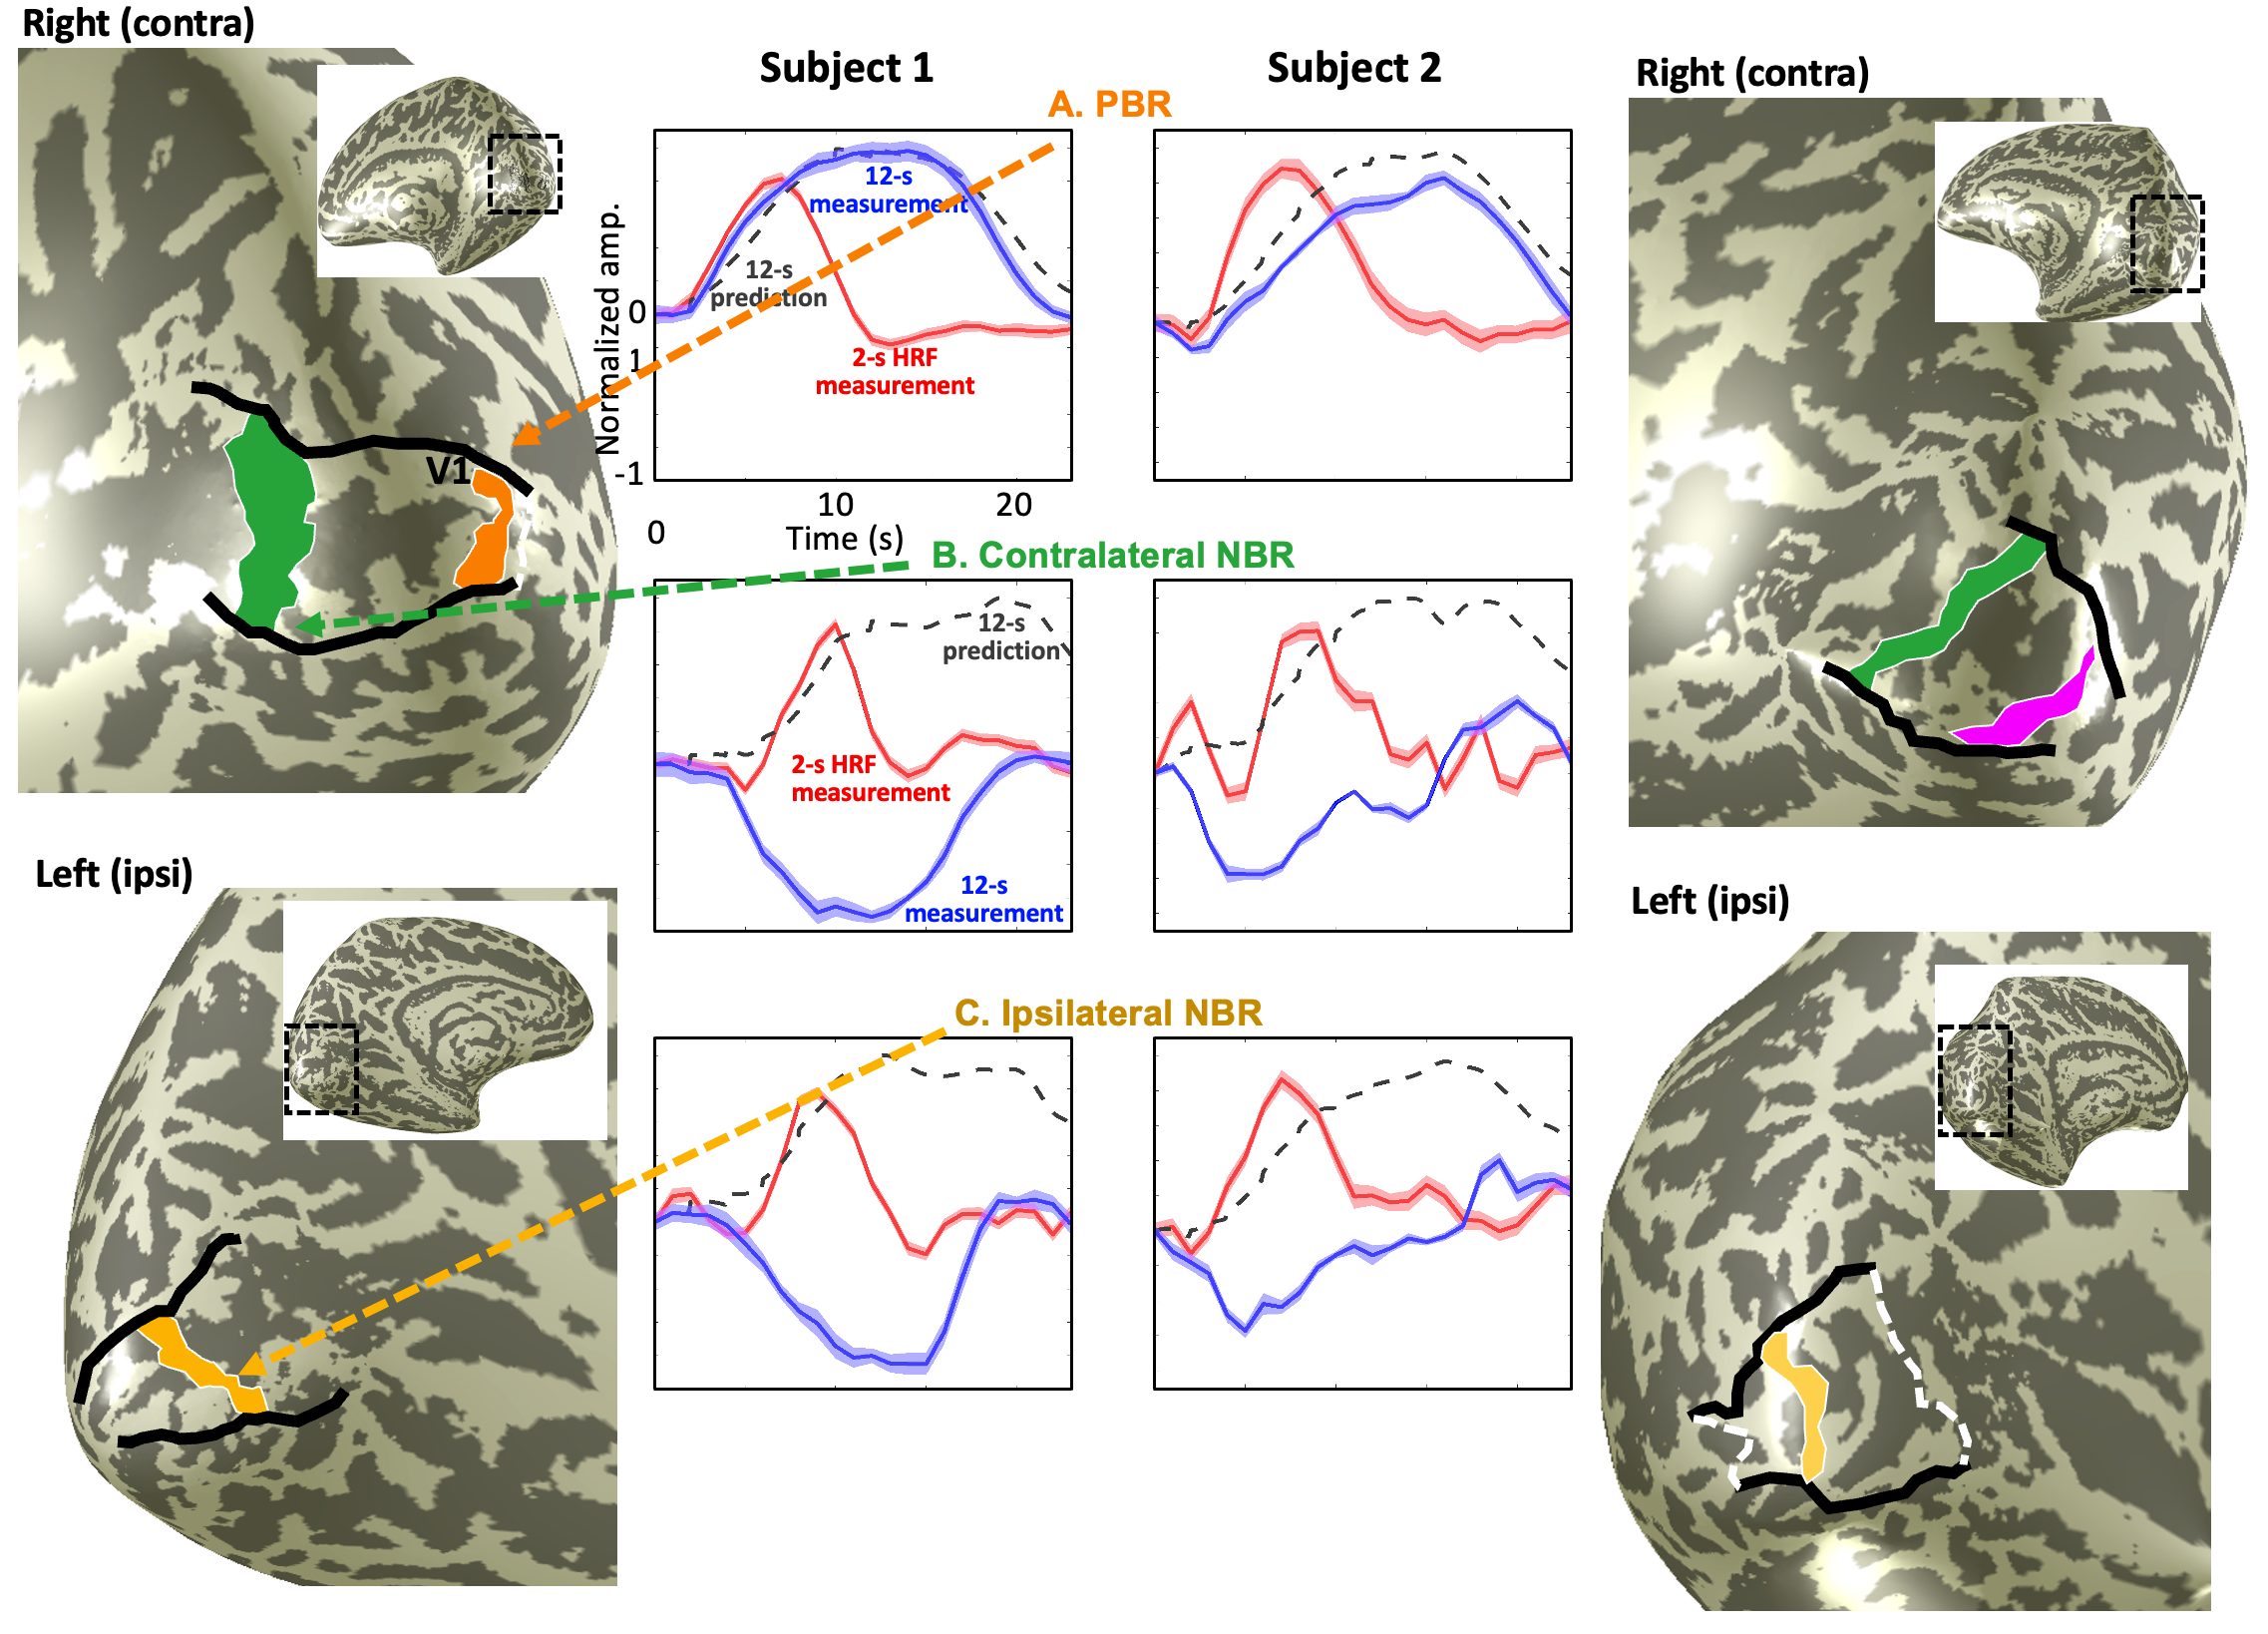
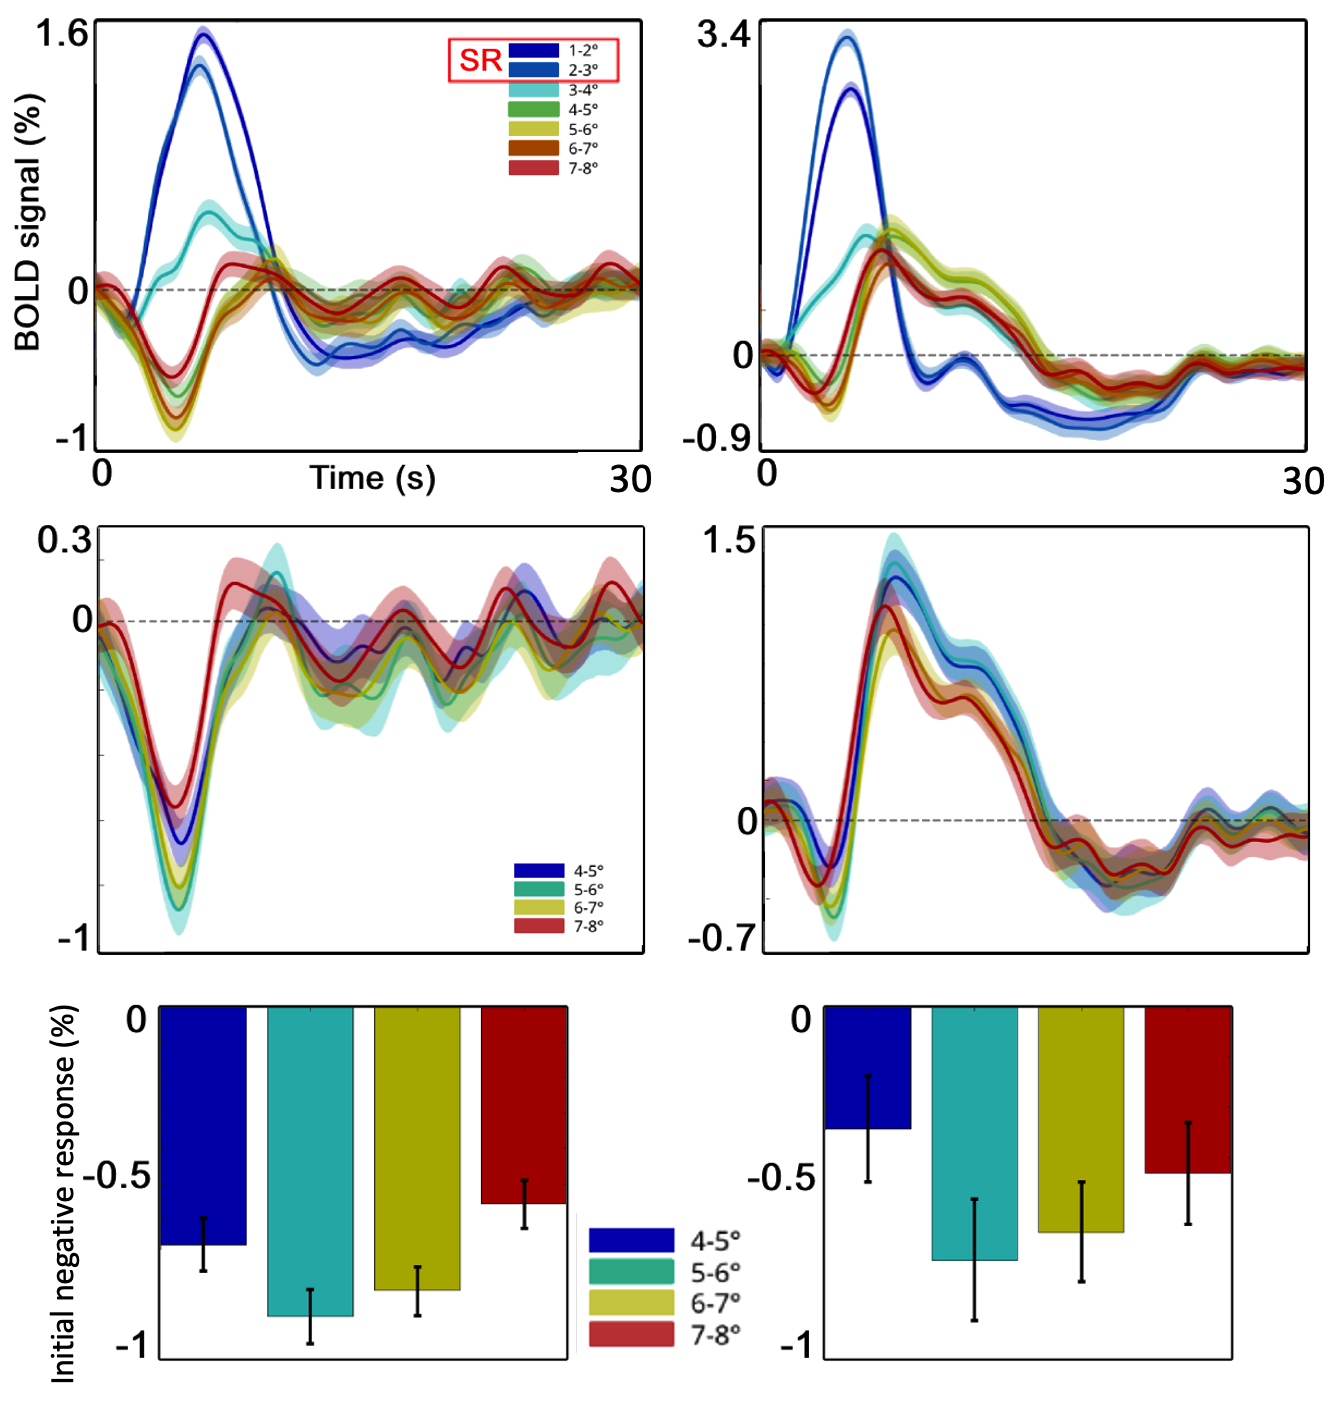
The block-design experiments (12-s stimulus) confirmed NBR adjacent to the PBR in contralateral V1, as well as broadly within ipsilateral V1. The observed spatial configuration of the NBR is consistent with block-design experiments previously performed2-5. We examined linearity of the NBR by calculating the response predicted by superposition of a rectangular function with the 2-s nHRF (red line) and compared the result to the measured NBR for two subjects, Fig. 1. the estimated PBR (dashed line) is similar to the measured PBR (blue solid line) demonstrating rough linearity of the PBR (R2 > 0.94), which is consistent with previous studies6, 7, Fig. 1A. On the contrary, non-linearity was clearly observed for the NBR. The distinct features of the nHRF, consisting of the initial negative response followed by a late positive peak, provided different estimates of the NBR from the measured NBR evoked by 12-s stimulus, Fig. 1B&C. As distance from the pHRF increases, the nHRF exhibits an amplified initial negative response. Nevertheless, beyond a specific threshold distance, a diminishing trend is observed in the magnitude of this initial negative response.Discussions
The measured NBR with 12-s stimulus duration is inconsistent with the NBR predicted with six nHRFs evoked by the same stimulus with 2-s stimulus duration, strongly suggesting that temporal linearity does not hold for the NBR. Initial negative response of the nHRF varied significantly with respect to cortical distance from the pHRF, suggesting a relationship with attentional suppression.Acknowledgements
We gratefully acknowledge the support of Dr. Danny Wang for valuable advice. This work was supported by the National Institutes of Health under awards R01NS121040 and R56NS095933.References
1. Zaretskaya N, Fischl B, Reuter M, Renvall V, Polimeni JR. Advantages of cortical surface reconstruction using submillimeter 7 T MEMPRAGE. NeuroImage. 2018;165:11-26.
2. Huber L, Goense J, Kennerley AJ, Ivanov D, Krieger SN, Lepsien J, Trampel R, Turner R, Möller HE. Investigation of the neurovascular coupling in positive and negative BOLD responses in human brain at 7 T. Neuroimage. 2014;97:349-62.
3. Kastrup A, Baudewig J, Schnaudigel S, Huonker R, Becker L, Sohns JM, Dechent P, Klingner C, Witte OW. Behavioral correlates of negative BOLD signal changes in the primary somatosensory cortex. Neuroimage. 2008;41(4):1364-71.
4. Pasley BN, Inglis BA, Freeman RD. Analysis of oxygen metabolism implies a neural origin for the negative BOLD response in human visual cortex. Neuroimage. 2007;36(2):269-76.
5. Shmuel A, Augath M, Oeltermann A, Logothetis NK. Negative functional MRI response correlates with decreases in neuronal activity in monkey visual area V1. Nature neuroscience. 2006;9(4):569.
6. Boynton GM, Engel SA, Glover GH, Heeger DJ. Linear systems analysis of functional magnetic resonance imaging in human V1. Journal of Neuroscience. 1996;16(13):4207-21.
7. Dale AM, Buckner RL. Selective averaging of rapidly presented individual trials using fMRI. Human brain mapping. 1997;5(5):329-40.
Figures