3443
Correlation of cerebrovascular reactivity (CVR) with baseline CBF, OEF, and CMRO21Department of Diagnostic and Interventional Radiology, Heidelberg University Hospital, Heidelberg, Germany, 2Divison of Radiology, German Cancer Research Center, Heidelberg, Germany, 3Divison of Medical Physics in Radiology, German Cancer Research Center, Heidelberg, Germany
Synopsis
Keywords: fMRI Analysis, fMRI
Motivation: Positive correlations between baseline cerebral blood flow (CBF) and BOLD-cerebrovascular reactivity (CVR), both between- and within-subjects were reported. However, there are no studies showing the correlation between CVR and other physiological parameters such as oxygen extraction fraction (OEF) and cerebral metabolic rate of oxygen (CMRO2).
Goal(s): In this study, these baseline parameters were measured using MRI, and the correlations between CVR and baseline CBF, OEF and CMRO2 were investigated.
Approach: Arterial spin labeling and quantitative BOLD were performed to quantify CBF and OEF.
Results: Positive correlations between CBF and CVR, CMRO2 and CVR were found. Negative correlation between OEF and CVR was found.
Impact: This study presents the correlation of CVR in healthy brain with baseline CBF, OEF, and CMRO2. Positive correlations between CBF and CVR, CMRO2 and CVR were found. Negative correlation between OEF and CVR was also found.
INTRODUCTION
Cerebrovascular reactivity (CVR) mapping with BOLD fMRI is an important indicator of hemodynamic function (1) , particularly in small cortical blood vessels (2), and is increasingly utilized in research and clinical applications. There is evidence that the baseline vascular state is coupled with CVR. A positive correlation between baseline CBF and CVR, both between- and within-subjects has been reported (3,4). However, there are no studies showing the correlation between CVR with other physiological parameters such as oxygen extraction fraction (OEF) and cerebral metabolic rate of oxygen (CMRO2). In this study, these baseline parameters were measured with MRI and the correlations between CVR and baseline CBF, OEF and CMRO2 were investigated.METHODS
Six healthy volunteers (2 female, 4 male, aged 33 ± 6 years) were examined prospectively using a 20-channel head coil on a 3T scanner (Magnetom Prisma, Siemens Healthineers, Erlangen, Germany). All participants provided written informed consent, and the study was approved by the institutional ethics committee. To measure CVR, breath-hold (BH) respiratory challenges were integrated into the brain imaging protocol: for block-designed BH tasks, 110 measurements were obtained, which include five and a half BH/FB (free breathing) cycles with 20 measurements (32s) per cycle and 10 measurements (17s) per half cycle. To measure CBF, a pseudo-continuous arterial spin labeling (pCASL) sequence with 3D gradients and spin-echo imaging (GRASE) readout was applied. Presaturation before labeling and background suppression during postlabeling delay (PLD) were added. Oxygen extraction fraction (OEF) was based on a gradient-echo sampling of spin-echo (GESSE) pulse sequence. Cerebral metabolic rate of oxygen (CMRO2) was calculated from CBF and OEF. Specific sequence parameters and data analysis are as follows.CVR: FOV=220×220 mm2, matrix size=64×64×28, resolution=3.4×3.4×3.5 mm3, slice gap=0.7 mm, in-plane iPAT factor=2, multiband factor=2, bandwidth = 1776 Hz/px, TE= 27.08 ms, TR=1700 ms. In conventional CVR analysis, measurements of end-tidal CO2 (Et-CO2) are required and used in a linear regression equation (5). Without the measurement of Et-CO2, the CVR was estimated by replacing Et-CO2 with the mean signal of gray matter in our case.
CBF: FOV=220×220 mm2, matrix size=64×64×24, resolution=3.4×3.4×5 mm3, slice and plane PF=6/8, slice oversampling=16.7%, FA=120°, segments=2, Bandwidth = 2298 Hz/px, labeling duration = 1.8s, PLD=1.8 ms, TE=17.18 ms, TR=4500 ms. This sequence had 20 tag and 20 control volumes and one M0 volume, for a total scan time of approximately 7 min. CBF was calculated using ASLtbx (6). A labeling efficiency of 0.86 was assumed in the calculation.
OEF: FOV=256×192 mm2, partial Fourier=6/8, matrix size=128×96×30, resolution=2×2×3 mm3, slice gap = 0.9 mm, TE=51ms; TR=105ms, number of total echoes=64, number of echoes before echo center=20, averages=3, acquisition time was about 10 min. For OEF analysis a feedforward ANN (artificial neural network) was used because of its high capability for nonlinear regression problems (7). The ANN consisted of a 64-dimensional input layer, two hidden layer (32 and 10-dimensional), and a 4-dimensional output layer and was implemented using the Neural Network Toolbox provided by Matlab. The ANN was trained based on the full quantitative BOLD (qBOLD) model. Thereby, artificial BOLD signals with a known ground truth were simulated for plausible ranges of the input variables SSE, R2, λ, and OEF. To reduce overfitting artifacts, noise was added to the simulated BOLD signals before the actual ANN training was initialized.
CMRO2: After smoothing and normalization of CBF and OEF into MNI space, CMRO2 was calculated as (8):
$$CMRO_{2}=CBF\cdot OEF \cdot [H]_{a}$$
The oxygenated heme molar concentration in arterioles [H]a was assumed to be 7.377 μmol/mL.
RESULTS
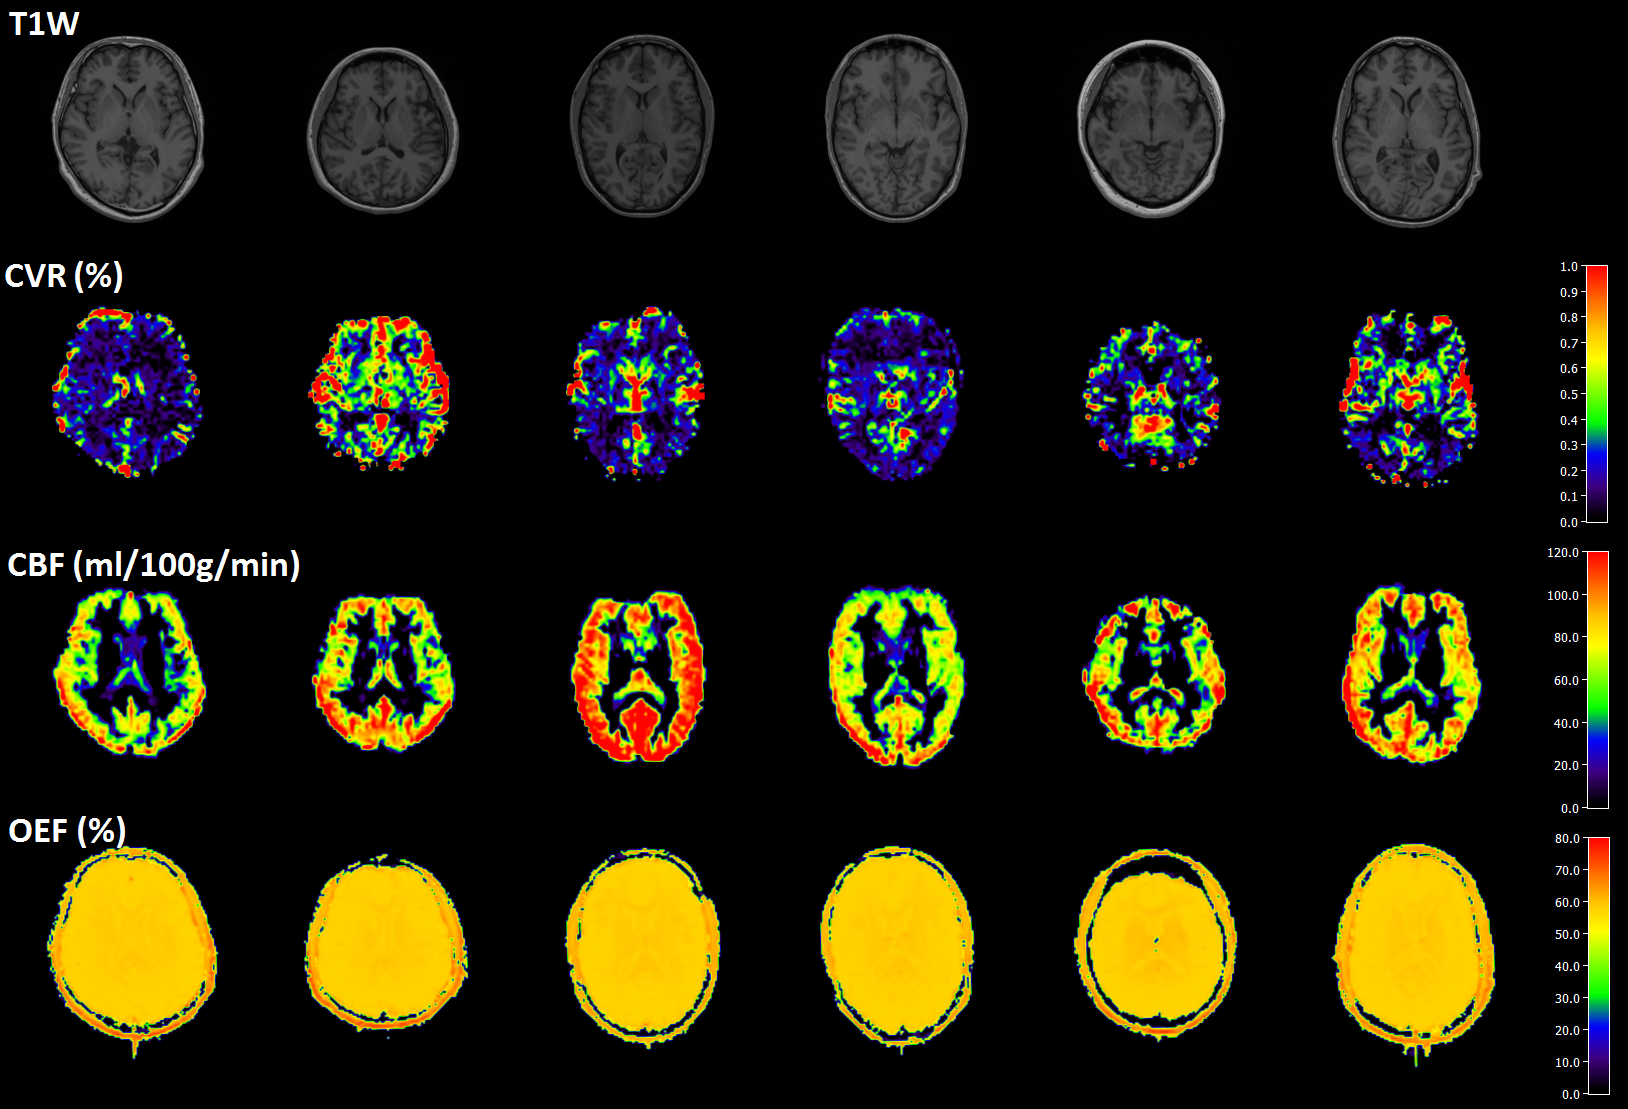
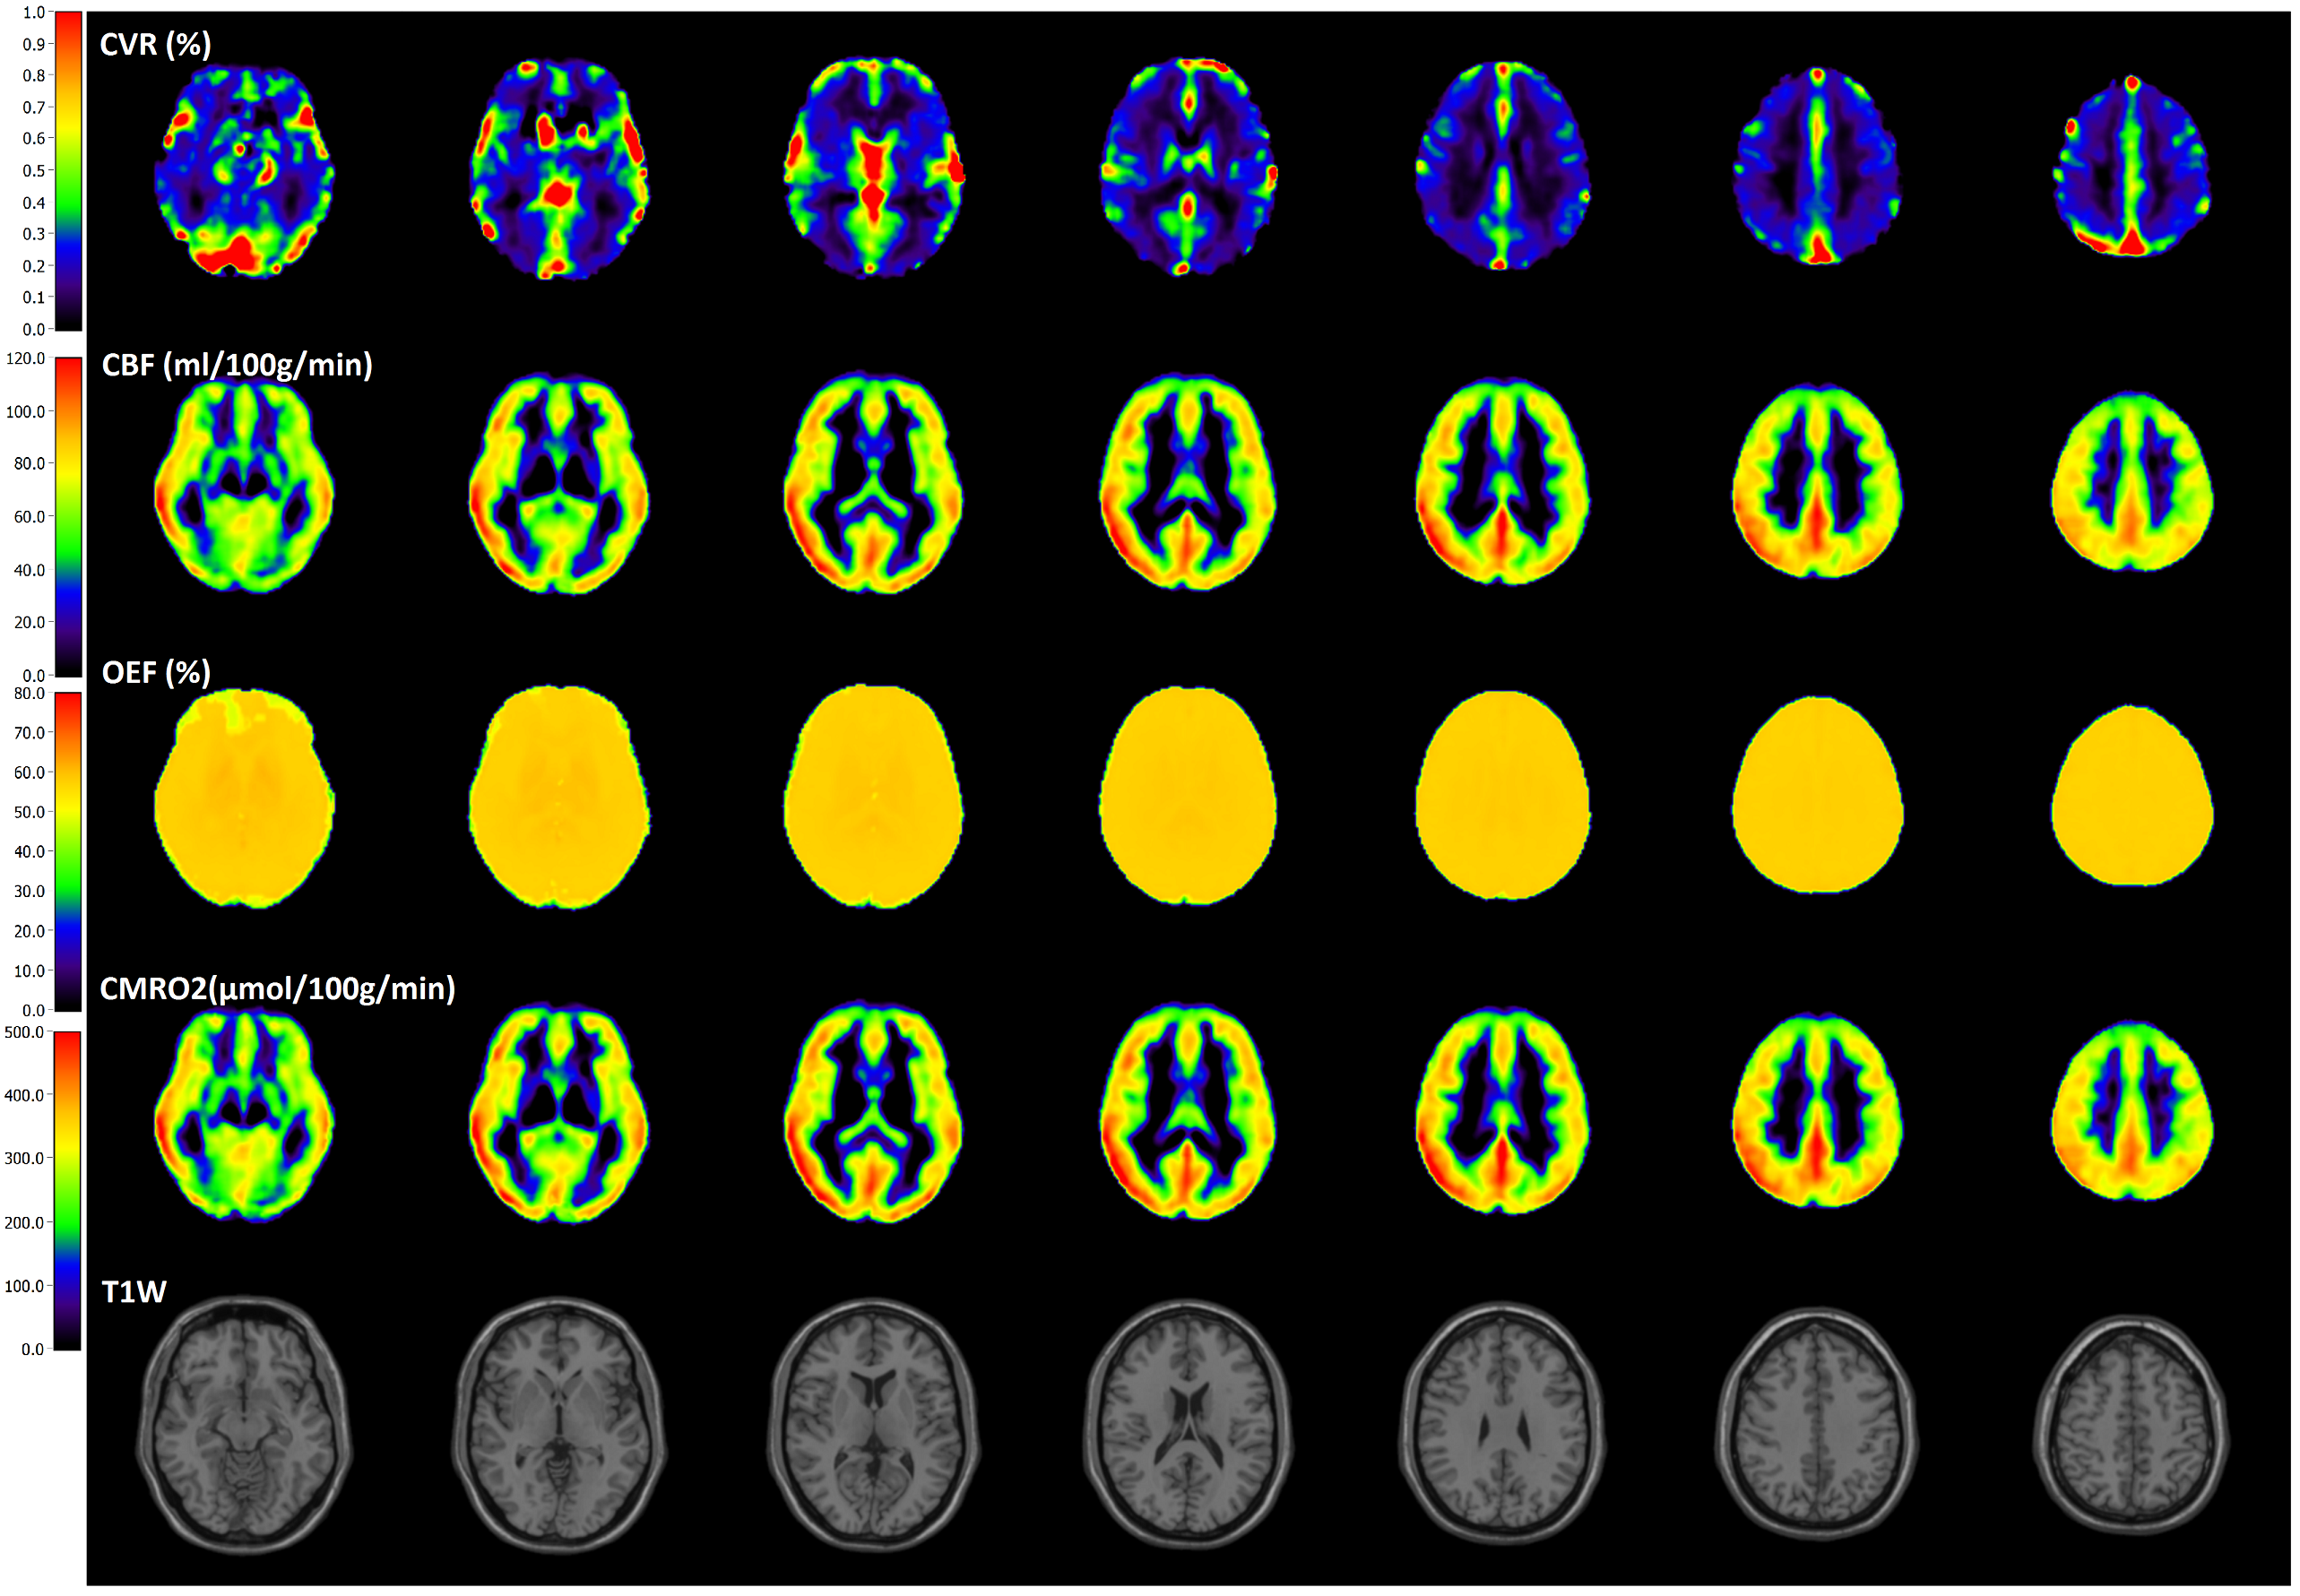
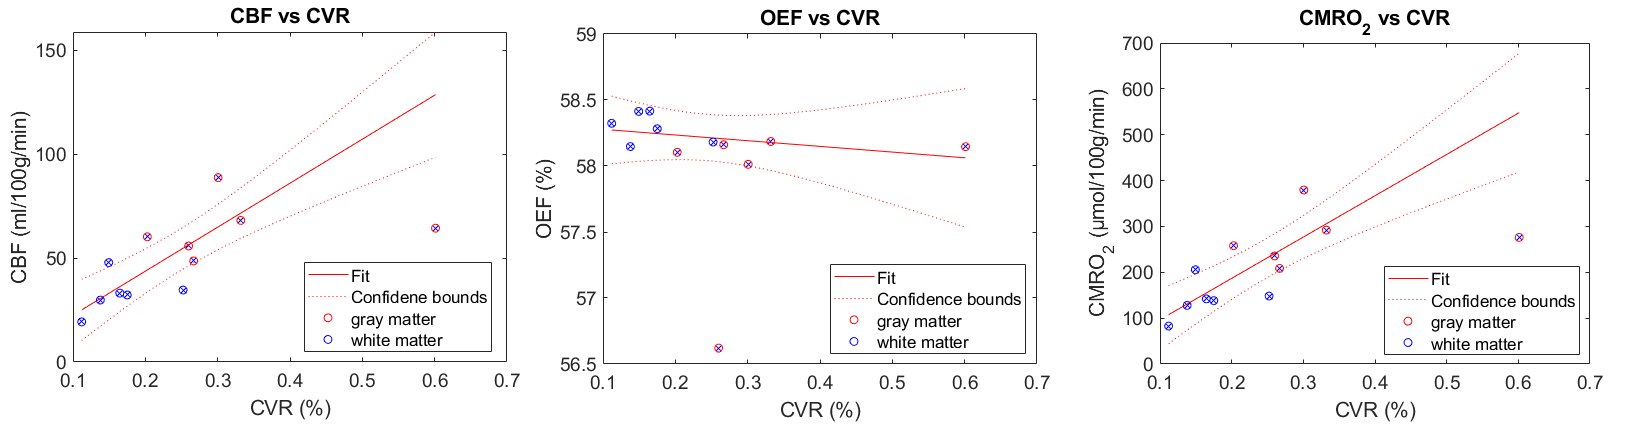
The individual CVR, CBF and OEF could be calculated and respective maps are shown in Fig. 1. Normalized and averaged maps are presented in Fig. 2. A positive correlation between CBF in gray matter and white matter and CVR across subjects was found. Conversely, negative correlations between OEF in gray matter and white matter and CVR was found. Positive correlations between CMRO2 in gray matter and white matter and CVR across subjects were also found. Specific results are presented in Fig. 3.DISCUSSION
Gradient-echo (GE) BOLD signal originates from the venous concentration of deoxyhemoglobin (9). Accordingly, we measured CVR based on GE BOLD. Comparing to previous studies, a positive correlation between CBF and CVR was confirmed in our case (3,4). The observed negative correlation between OEF and CVR may be due to venous oxygenation: Yv is the venous oxygenation, defined as the fraction of oxyhemoglobin in the venous blood, and OEF=1-Yv: This means that if OEF increases, Yv decreases and CVR decreases.CONCLUSION
This study presents the correlation of CVR in healthy brain with baseline CBF, OEF, and CMRO2.Acknowledgements
No acknowledgement found.References
1. Sleight E, Stringer MS, Marshall I, Wardlaw JM, Thrippleton MJ. Cerebrovascular Reactivity Measurement Using Magnetic Resonance Imaging: A Systematic Review. Front Physiol 2021;12:643468. 2. Fisher JA, Venkatraghavan L, Mikulis DJ. Magnetic Resonance Imaging-Based Cerebrovascular Reactivity and Hemodynamic Reserve. Stroke 2018;49(8):2011-2018.
3. Leoni RF, Oliveira IA, Pontes-Neto OM, Santos AC, Leite JP. Cerebral blood flow and vasoreactivity in aging: an arterial spin labeling study. Braz J Med Biol Res 2017;50(4):e5670.
4. Stickland RC, Zvolanek KM, Moia S, Caballero-Gaudes C, Bright MG. Lag-Optimized Blood Oxygenation Level Dependent Cerebrovascular Reactivity Estimates Derived From Breathing Task Data Have a Stronger Relationship With Baseline Cerebral Blood Flow. Front Neurosci 2022;16:910025. 5. Liu P, De Vis JB, Lu H. Cerebrovascular reactivity (CVR) MRI with CO2 challenge: A technical review. Neuroimage 2019;187:104-115.
6. Wang Z, Aguirre GK, Rao H, Wang J, Fernandez-Seara MA, Childress AR, Detre JA. Empirical optimization of ASL data analysis using an ASL data processing toolbox: ASLtbx. Magn Reson Imaging 2008;26(2):261-269.
7. Domsch S, Murle B, Weingartner S, Zapp J, Wenz F, Schad LR. Oxygen extraction fraction mapping at 3 Tesla using an artificial neural network: A feasibility study. Magn Reson Med 2018;79(2):890-899.
8. Hubertus S, Thomas S, Cho J, Zhang S, Wang Y, Schad LR. Comparison of gradient echo and gradient echo sampling of spin echo sequence for the quantification of the oxygen extraction fraction from a combined quantitative susceptibility mapping and quantitative BOLD (QSM+qBOLD) approach. Magn Reson Med 2019;82(4):1491-1503.
9. Ogawa S, Menon RS, Tank DW, Kim SG, Merkle H, Ellermann JM, Ugurbil K. Functional brain mapping by blood oxygenation level-dependent contrast magnetic resonance imaging. A comparison of signal characteristics with a biophysical model. Biophys J 1993;64(3):803-812.
Figures